Seems that a bounce may take place soonFrom the chart of COIN, it is near the long-term upward supporting trendline. A bounce may take place soon. Based on its trading range, it may head toward US$250 if this support trendline manages to hold its ground.
COIN-M

#ZECUSDT #1D (Binance Futures) Descending channel breakoutZcash broke-out printing a morning star, looks good for recovery towards 100EMA resistance.
⚡️⚡️ #ZEC/USDT ⚡️⚡️
Exchanges: Binance Futures
Signal Type: Regular (Long)
Leverage: Isolated (2.0X)
Amount: 5.9%
Current Price:
36.12
Entry Zone:
36.05 - 33.55
Take-Profit Targets:
1) 41.83
1) 47.12
1) 52.42
Stop Targets:
1) 28.92
Published By: @Zblaba
SEED_DONKEYDAN_MARKET_CAP:ZEC BINANCE:ZECUSDT.P #1D #Zcash #Privacy z.cash
Risk/Reward= 1:1.2 | 1:2.1 | 1:3.0
Expected Profit= +40.4% | +70.8% | +101.3%
Possible Loss= -33.8%
Estimated Gaintime= 1-2 months

$SPY Short Term Bullish atm.. idea for BullsWell... seeing is we hit my target, I thought I might bless the Bulls with a little bit of Eye Candy.... This is what you want...
The Fib breakdown of the Golden Pocket above at the 1.61... we hit the retracement... and now back to the .78
We hold here and it can get bullish quick.
Bearish Path in Next post... otherwise we make a lower high and fall to $525 and fast.

TOTAL Marketcap at important support?Upcoming period could be more positive?
Many cryptocurrency dominance charts, as well as Nasdaq and stock charts too, showing the same pattern. Is the reversal starting?
We’ll see.
This is not investment advice. Please do your own research.
Wishing you best.
-YusufDeli

Worldcoin $WLD Child Sam Altman (CEO of OpenAI) Worldcoin Project Analysis
Worldcoin is a cryptocurrency aimed at providing secure global economic access through innovative technology, primarily utilizing iris biometric identification. Co-founded by Sam Altman(CEO of OpenAI) , the project merges AI, blockchain, and decentralized finance for identity verification and equitable economic participation.
Key Innovations
Iris Biometric Technology : Unique method of online identity verification, addressing identity fraud concerns.
Layer 2 Ethereum Solution : Enhances transaction speed and security within the crypto landscape.
World ID and Orb: Users get a digital identity with unique IrisHash, promoting human verification against systems designed to prevent Sybil attacks.
Market Forecasts
Long-term Growth Potential: Analysts suggest potential price increases, a maximum of $6$, until the end of 2025
Current Market Condition: Despite innovations, Worldcoin’s WLD token is trading at an all-time low, emphasizing market volatility.
Regulatory Challenges
Privacy Concerns: Investigated in multiple countries for data protection, raising ethical questions regarding biometric data usage.
I mpact on Market Launch: Ongoing regulatory scrutiny may delay the global rollout, particularly in the US.
Investment Outlook
Pros:
- Innovative approach offers unique value in the crypto space.
- Significant token allocation for community support adoption.
- Focus on security enhancements and compliance could improve market perception.
Cons:
-Regulatory investigations may impact growth and trust.
-Current low market performance showcases potential investor skepticism.
-Ethical concerns surrounding biometric data handling may deter users.
Conclusion: Worldcoin holds significant long-term growth potential due to its innovative identity verification technology and economic paradigm shift towards equitable participation. However, market conditions, regulatory challenges, and privacy concerns pose serious investor risks. Monitoring regulations and technological developments will be crucial for potential investors in navigating this complex landscape.
Best regards EXCAVO

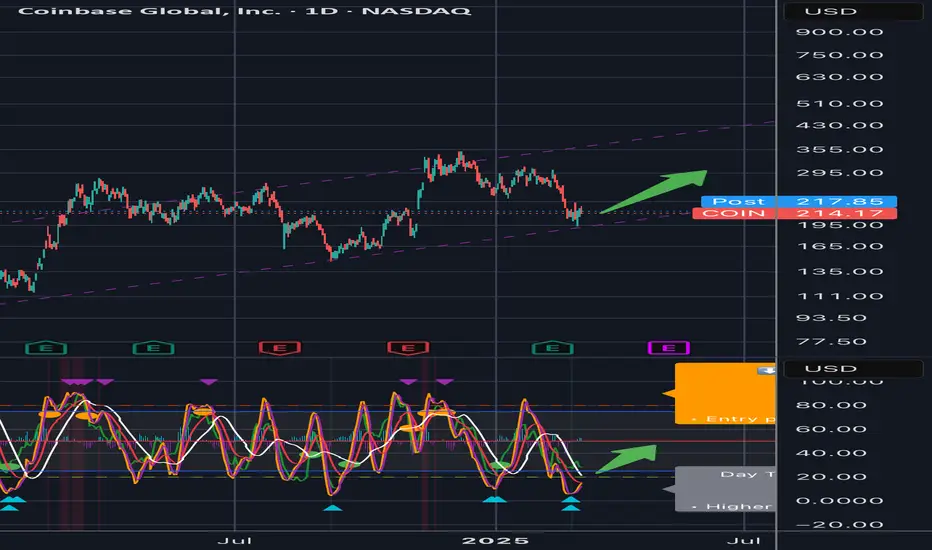
Bottom is in IMHO - Long term bullish COIN game plan # **Coinbase (COIN) – Technical Analysis**
## **Current Market Overview**
- **Price:** $214.17
- **Trend:** Bullish within an **ascending channel**
- **Support Zone:** $200 - $205 (Trendline Support)
- **Resistance Levels:**
- **Short-Term:** $230 - $240
- **Mid-Term:** $270
- **Long-Term:** $300+
---
## **Chart Patterns & Indicators**
### **1. Ascending Channel**
- Price is **respecting the lower trendline**, indicating a potential bounce.
- **Holding above the trendline** supports a continuation towards $270+.
### **2. Stochastic RSI – Oversold**
- Deeply oversold **(below 20)**, signaling potential upward momentum.
- Historically, price has bounced after hitting this level.
### **3. Volume & Confirmation**
- Need a **break above $230 with volume** to confirm upside strength.
---
## **Trade Plan & Price Targets**
### **Short-Term (1-2 weeks)**
- **Bias:** Bullish
- **Entry Zone:** $210 - $215
- **Stop Loss:** Below $200 (trendline break invalidates setup)
- **Target 1:** $230 (resistance level)
- **Target 2:** $240 (next key level)
### **Near-Term (1-3 months)**
- **Bias:** Bullish
- **Price Target:** $270 (upper range of channel)
- **Risk:** Medium (watch for rejection at $230)
### **Long-Term (6-12 months)**
- **Bias:** Strongly Bullish
- **Target 1:** $300 (upper trendline resistance)
- **Target 2:** $350+ (breakout scenario)
---
## **Risk Considerations**
- A **break below $200 invalidates** the setup.
- Macro conditions and crypto market correlation **impact price action**.
---
### **Final Thesis**
✅ **Bullish continuation likely if price holds $205-$210.**
🚀 **Breakout above $230 needed for strong upward momentum.**
⚠️ **Break below $200 = potential trend shift, bearish risk.**
COINBASE: Reached the bottom of the 1 year Channel Up.Coinbase is bearish on its 1D technical outlook (RSI = 39.040, MACD = -17.200, ADX = 47.118) and has hit the bottom of its 1 year Channel Up following a 4H Death Cross. This is typically seen at the end of downtrends and with the 4H RSI already rebounding after turning oversold, we technically have the best buy opportunity since September 6th 2024. The trade is long, TP = 395.00.
## If you like our free content follow our profile to get more daily ideas. ##
## Comments and likes are greatly appreciated. ##

THE CLV WHALES BREAK..THE CLV WHALES BREAK..
CLV interesting for new voluume
Always manage the risk since it has shown an increased trend of 60% to risky to enter directly with no plan.
There is high chance this coin can break up $0,10 coming time

Bitcoin (BTC/USD) Technical Analysis & Trading PlanBitcoin (BTC/USD) Technical Analysis & Trading Plan – February 28, 2025
Market Overview
The Bitcoin (BTC/USD) price is currently trading at $79,770, showing a -0.74% decline in the latest 4-hour candlestick. The chart illustrates a falling wedge trading pattern, which is considered a bullish reversal signal. The price is approaching the lower boundary of the wedge, signaling a potential breakout to the upside.
Technical Indicators & Key Observations
Falling Wedge Pattern:
The price has been making lower highs and lower lows within a falling wedge formation (red and green trendlines).
A breakout above the upper boundary of the wedge could trigger a strong bullish rally.
Support and Resistance Levels:
Immediate support: $76,665
Major support: $67,679
Key resistance levels:
$88,671
$91,271
$95,497
$108,329 (Major long-term resistance)
Momentum Indicators:
RSI (Relative Strength Index): 22.26 (oversold), indicating potential upward momentum.
Stochastic Oscillator: 16.14, also in the oversold region, confirming a possible reversal.
Money Flow Index (MFI): Showing weak inflow, but a reversal at these levels could indicate increasing buying pressure.
Cipher_B Divergences: Potential bullish divergence forming, adding confluence to the breakout scenario.
Professional Trading Plan
Entry Strategy
Aggressive Entry: If Bitcoin closes a 4-hour candle above the wedge's upper trendline (~$80,500), an early entry can be considered.
Conservative Entry: Wait for confirmation above the $82,000 level with strong volume before entering a long position.
Profit Targets
First Target: $88,671 (previous local high)
Second Target: $91,271 (psychological level)
Third Target: $95,497 (strong resistance)
Ultimate Target: $108,329 (major long-term resistance)
Stop-Loss Strategy
For aggressive traders: Below $76,500 (recent low)
For conservative traders: Below $74,000 to reduce risk exposure
Risk Management
Risk-to-reward ratio: 1:3 or higher (entry should be calculated to maintain proper risk-reward)
Position Sizing: Allocate 2-5% of capital to this trade, considering volatility.
Conclusion
Bitcoin is currently trading at a critical support level within a falling wedge. The RSI, Stochastic, and MFI indicators suggest oversold conditions, indicating a potential bullish breakout. Traders should watch for a confirmed breakout above the wedge with strong volume before entering a position. Targets remain between $88,000 and $108,000, with well-defined stop-loss levels to minimize risk.
💡 Recommendation: Monitor price action closely, especially in the next few 4-hour candles. If BTC breaks above the wedge, prepare for a bullish move towards resistance levels.

Revised COIN price targets - the blood is on the streets
ByBit exogenous news is wildcard so we’ve broken down support as all hell broke loose.
Here is the revised outlook of the trading plan:
Trading Plan Based on Risk Appetite
Aggressive Trader (Short-Term)
• Long Entry: $234-$236 (oversold conditions).
• Stop-Loss: Below $230.
• Target: $248-$252.
Swing Trader (1-2 Weeks)
• Long Entry: On confirmation above $248.
• Stop-Loss: Below $234.
• Target: $263-$272.
Investor (Long-Term)
• Buy Range: Accumulate in dips between $220-$234.
• Target: $280-$310 in a bullish case.
Conclusion
• COIN has broken key support levels but is now in a critical demand zone ($234-$236).
• The next 24-48 hours will be crucial—if price stabilizes, we may see a bounce.
• A further breakdown below $234 opens the door to $220.
• A reclaim of $252-$263 will confirm a short-term bullish reversal.

Coinbase shortterm bounce opportunity This is beaten down. So much so, that it’s beaten down on many time frames. In my book it’s a contrarian opportunity here. My indicator tells me the same.
The COIN stock is showing oversold conditions based on momentum indicators.
• The 3H chart suggests a potential reversal or at least a short-term relief bounce.
Timeframe Analysis
Short-Term (3H - Intraday to Few Days)
• Current Price Action:
• Price is hovering above a strong liquidity zone near $246-$250.
• The stochastic-based oscillator at the bottom is in the oversold region with blue triangles indicating potential buying interest.
• Previous Break of Structure (BoS) & Change of Character (CHoCH) events confirm short-term trend shifts.
Key Levels to Watch:
• Resistance: $270 (previous rejection), $280-$285 (key range high).
• Support: $246-$250 (buying zone); a break below could send it toward $234.
• Short-Term Probabilities:
• Bounce to $270: ~60% chance if support holds. [
• Break below $246: ~40% chance leading to $234-$236.

BITCOIN SWING LONG|
✅BITCOIN is going down
To retest a very strong wide
Horizontal support level
Around 90,000$ and as we
Are bullish biased on the coin
We will be expecting a
Further bullish move up
LONG🚀
✅Like and subscribe to never miss a new idea!✅

Coinbase: Brief BreakoutCoinbase’s positive earnings initially served as a catalyst for a brief breakout from the previously established range, with shareholders enjoying a nearly 16% gain. However, the euphoria was short-lived, and the stock quickly retreated. We attribute the current fluctuation to the blue wave (v), which should provide further increases and ultimately complete the larger magenta wave above the resistance at $343.92. Adjustments to our wave count will only be necessary if the price falls below the support at $224 (probability: 33%).

$COIN The Retail Money PitCoinbase stock has consistently underperformed due to growing concerns about the companies long term viability. Despite good earnings, smart money knows strong quarterly reports will come and go with each cycle. Save your hard earned money and invest in a more fruitful buisness model.

Opening (IRA): COIN March 21st 220 Covered Call... for a 215.96 debit.
Comments: High IV + weakness. Selling the -85 delta call against shares to emulate the delta metrics of a 16 delta short put, but with the built-in defense of the short call. Going lower net delta due to the shorter duration (35 DTE).
Metrics:
Buying Power Effect/Break Even: 215.96/share
Max Profit: 4.04
ROC at Max: 1.87%
50% Max: 2.02
ROC at 50% Max: .94
Will generally look to take profit at 50% max, roll out short call if my take profit is not hit.

Renaissance of FinTech and $ARKF recent outperformanceSince the bear market lows of 2022, ARK ETF have gained some ground since then. Today we specifically look at the AMEX:ARKF which holds the fintech stocks. Since then, the ETF has seen a renaissance and has broken out of various Fib retracement levels. When we look at the fintech stocks like NASDAQ:UPST , EURONEXT:ADYEN , NASDAQ:PYPL , NYSE:LMND , NASDAQ:HOOD , $ COIN, NASDAQ:SOFI , $XYZ. Even the traditional stocks like NYSE:ICE and NASDAQ:NDAQ have a similar chart.
In terms of chart there was a huge bottom formation, and the recent price action has shown that the Fintech ETF is breaking out of the huge base. The next levels to watch will be 0.618 and 0.786 Fib levels with up to 25% upside potential in price.
Long $ARKF.

COIN Coinbase Global Options Ahead of EarningsIf you haven`t bought COIN before the previous earnings:
Now analyzing the options chain and the chart patterns of COIN Coinbase Global prior to the earnings report this week,
I would consider purchasing the 285usd strike price Calls with
an expiration date of 2025-2-14,
for a premium of approximately $7.65.
If these options prove to be profitable prior to the earnings release, I would sell at least half of them.

Bearish $COIN? $315 then down? Or straight down?NASDAQ:COIN has earnings tomorrow, and while I don't know how earnings will turn out, I lean towards a bearish outcome based on the chart.
I could see a move up to $295 or $315, but if price can't break above and flip those levels as support, then I think post earnings will lead to continuation to the downside.
We're seeing a red cloud form on the daily, which usually indicates the start of a bearish trend, not the end of one. Therefore, that combined with price breaking out of a bear flag, combined with red heikin ashi candles on all larger timeframes, I think price will end up with a bearish outcome.
If that is the case, then I lean towards us hitting the lower support before we continue the bull trend, because there's a lack of balance on the chart with the uptrend, but it's also possible to find support in the $191-171 range.
Let's see how it plays out.

ONDO - The Sweet Spot!Hello TradingView Family / Fellow Traders. This is Richard, also known as theSignalyst.
📈After rejecting the $2 round number, ONDO has been in a correction phase and it is currently approaching the lower bound of its rising broadening wedge marked in blue.
Moreover, the green zone is a strong support and round number $1.
🏹 Thus, the highlighted blue circle is a strong area to look for buy setups as it is the intersection of the $1 round number and lower blue trendline acting as a non-horizontal support.
📚 As per my trading style:
As #ONDO approaches the blue circle, I will be looking for bullish reversal setups (like a double bottom pattern, trendline break , and so on...)
📚 Always follow your trading plan regarding entry, risk management, and trade management.
Good luck!
All Strategies Are Good; If Managed Properly!
~Rich

COIN- Cup and Handle FormationThere is more to this, but the basic formation is here. Other systems seem to also support the formation (such as Gann, and Harmonics).
There are a few 6 month candles overlaid in the entry to this that I was creating- illustrating the 6 month gains to form the cup. The handle portion did catch me off guard as we are typically use to seeing a cup form at the initial correction, but this one seems to have formed inside of the down move (very interesting).
Lets see how it works out. If true- its 50% gain on the bone here.

COINBASE about to start a rally to $550Coinbase (COIN) broke above its 1D MA50 (blue trend-line) again yesterday, but is practically still consolidating around it for the past 2 weeks. Still, it has already broke above December's Channel Down, which on the wider, long-term bullish trend, is nothing but a Bull Flag pattern, similar to January 2024.
As you can see, both patterns were initiated after previously a Falling Wedge broke upwards and above the 1D MA50 and on all occasions, the price increase has been significant, with the smallest being +139.50%.
As a result, being also on a 1D MACD Bullish Cross, we expect the stock to kick-start the new Bullish Leg soon. Expecting to register at least another +139.50% Leg from the recent Low, our Target is $550.
-------------------------------------------------------------------------------
** Please LIKE 👍, FOLLOW ✅, SHARE 🙌 and COMMENT ✍ if you enjoy this idea! Also share your ideas and charts in the comments section below! This is best way to keep it relevant, support us, keep the content here free and allow the idea to reach as many people as possible. **
-------------------------------------------------------------------------------
💸💸💸💸💸💸
👇 👇 👇 👇 👇 👇

PYPL , PEPS, COIN | HOT STOCKSThere are a few stocks that could be good buys, and are approaching idea l buy zones.
PEPSICO VIE:PEPS
Pepsi is showing it's "annual correction" as we're finally getting close tot he apex of the correction, which may be an ideal buy zone.
PAYPAL NASDAQ:PYPL
Paypal is still on my watchlist, for great growth, further adoption and upside potential after finish of a clear bearish cycle:
COINBASE NASDAQ:COIN
Fairly recently released, coinbase could be a good buy for a long term hold. Also currently observing a pattern that can either be called an Inverse Head and Shoulders, or Cup and Handle.
________________

Halftime Update: COIN on a Crypto Rebound Play?After CRYPTOCAP:BTC rebounded above $100K and has since settled, stocks such as COIN has of course benefitted by seeing $1.162B in Trading Volume going into Halftime of Today's Trading Session.
It's currently trading above a Longer Resistance Level (as support) so this could push up along the bottom of our Purple Trend you see there, bouncing downward, delivery better entries on it's way up.
With that being said, we could see a $240-$246 retest before the push higher as it has dipped twice to those levels since Mid-Dec. 2024.
Just watching for now but stay tuned for more at @MyMIWallet by visiting our website and connecting with us everywhere you are! We'll be there!
