ALGOOAAALLLL ⚽️Hello TradingView Family / Fellow Traders. This is Richard, as known as theSignalyst.
As per my last idea (attached in the Related Ideas below), you know that I am keeping an eye on tokens that might get more exposure during the World Cup 2022.
Here is a quick reminder:
FIFA has teamed up with blockchain technology company Algorand to agree a sponsorship and technical partnership deal.
The agreement means Algorand will become the official blockchain platform of FIFA and provide the official blockchain-supported wallet solution. As per the sponsorship agreement, Algorand will be a FIFA World Cup Qatar 2022™ Regional Supporter in North America and Europe, and a FIFA Women’s World Cup Australia and New Zealand 2023™ Official Sponsor.
Source: Tweet attached on the chart
📉Technical Analysis:
ALGO lately rejected a weekly support zone 0.20 - 0.30 and since then it has been stuck inside a big range.
For the bulls to take over from a long-term perspective, we need a momentum daily candle close above the upper bound of the range (gray zone) around 0.440
Meanwhile, if ALGO rejected the upper gray zone and trades lower, we will be looking for short-term buy setups as it approaches the lower gray zone again.
Always follow your trading plan regarding entry, risk management, and trade management.
Good luck!
All Strategies Are Good; If Managed Properly!
~Rich
COIN-M

COIN Coinbase Options Ahead of EarningsLooking at the COIN Coinbase options chain, i would buy the $60 strike price Puts with
2023-1-20 expiration date for about
$8.00 premium.
Looking forward to read your opinion about it.

NWC - Short-Term and Long-Term View!Hello TradingView Family / Fellow Traders. This is Richard, as known as theSignalyst.
Here is a detailed update top-down analysis for NWC.
Which scenario do you think is more likely to happen? and Why?
Always follow your trading plan regarding entry, risk management, and trade management.
Good Luck!.
All Strategies Are Good; If Managed Properly!
~Rich

SAND - Wait For The Bulls!Hello TradingView Family / Fellow Traders. This is Richard, as known as theSignalyst.
on WEEKLY: (Left Chart)
SAND is sitting around a strong demand zone in blue so we will be looking for buy setups on lower timeframes.
on H4: (Right Chart)
SAND formed a valid wedge pattern in red. but it is not ready to go yet.
For the bulls to take over, a momentum candle close above the last major high (in gray).
Meanwhile, until the buy is activated, SAND can still trade lower inside the blue demand zone (0.5 - 0.7)
In this case, we will be looking for new buy setups to form.
Always follow your trading plan regarding entry, risk management, and trade management.
Good luck!
All Strategies Are Good; If Managed Properly!
~Rich

COIN breakout?$COIN has recently broken out of its bearish pennant pattern with some potential upside. However, this could very well be a fakeout and continue lower just like it had happened previously. We are in a bearish pennant and could move back to the downside, especially if overall market sentiment continues to be bearish. Personally, I will go long if we can hold above this pennant and resistance. I will look to go short if we confirm this is a fakeout and we start to trend lower.

✅JASMY SEEMS TO PREPARE FOR 105% INCREASE COMING TIMEJasmy seems to be ready for the new high increase, which could bring Jamsy to above 100% increase coming time.
We have seen before similar trend with 300% increase in jammy.
For this reason, we will follow Jasmy coming time to see the last trends.
When there will be a breakout high chance this will be a whale breakout depending on breakout wick trading.
Marketcap of the coin is just: $22,527,154 at this moment, and the plans go further on country currency. it will fly but that's another story.
We don't believe in coins or news: but follow the data, because data did prove more times to be right

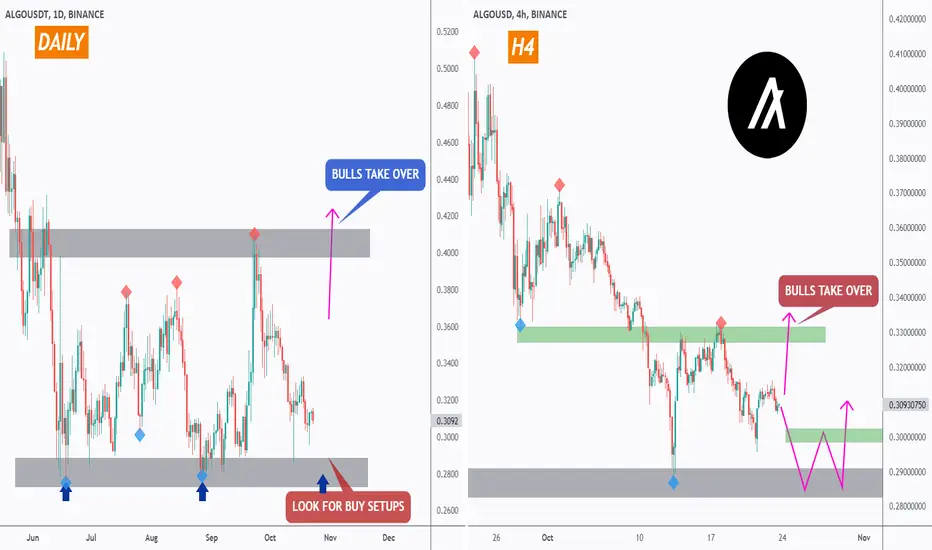
ALGO - Wait For The Bulls!Hello TradingView Family / Fellow Traders. This is Richard, as known as theSignalyst.
DAILY: Left Chart
ALGO has been stuck inside a range for a while.
For the bulls to take over from a long-term perspective, we need a break above the upper gray area (upper bound of the range)
Meanwhile, as we are approaching the lower bound of the range, we will be looking for buy setups on lower timeframes.
H4: Right Chart
From a medium-term perspective, we have been bearish making lower lows and lower highs.
For the bulls to take over, we need a momentum candle close above the last major high marked in green.
Meanwhile, until the buy is activated, ALGO can still trade lower till the gray zone where we will be looking for new buy setups.
Always follow your trading plan regarding entry, risk management, and trade management.
Good luck!
All Strategies Are Good; If Managed Properly!
~Rich
RLinda ! MATICUSDT-> will the decline continue? MATICUSDT in the global perspective is set to fall, after a slight rise to the 1.0547 mark, the chart shows the settings that portend a further decline in price.
On the global chart, after a correction from the 0.300 zone, an upward correction to 1.0500 is formed, after which the price forms a downward range with the goal of continuing to fall
On the local chart a "descending wedge" pattern is forming, but as we see, the price is not yet ready to break through resistance, after updating the local lows, the price is going to continue to fall
I assume that after the pullback to the resistance area, the fall will continue, and the price may reach the support area of 0.6900.
Regards R.Linda!

Weekly Analysis BTC via Ichimoku by TheSocialCryptoClubGood start to the week,
As usual, here is our analysis of the week looking at a glance at the daily chart of BINANCE:BTCUSDT using the Ichimoku Kinko Hyo indicator with traditional settings. We used in support other indicators that we have developed and released Open Source, you can find them at the end of the analysis.
Trend:
Kumo has been red for 44 days and is stable (currently at around 5%). In concert the situation is bearish. Now the price is on the Kijun - which recently went below the Tenkan having lost the bullish move of mid-September in its calculation. As we note, the first major resistance is the Kijun itself.
The Kijun Trend indicator continues to indicate the search for short positions.
Heikin-Ashi:
The Heikin-Ashi confirms the bearish movement with several red candles without shadow above.
Supports and resistances:
- 25000.00 Fibonacci
- 24600.00 Tenkan Weekly
- 23400.00 Chikou cusp level or flat zones of Kijun and Tenkan
- 22400.00-22600.00 Chikou cusp level or flat zones of Kijun and Tenkan
- 20200.00 Chikou cusp level or flat zones of Kijun and Tenkan
- 20000.00 psychological threshold
- 19100.00-18900.00 Chikou cusp level or flat zones of Kijun and Tenkan
- 17080.00Chikou cusp level or flat zones of Kijun and Tenkan
- 12700.00 from Hosoda waves
- 11000.00-13000.00 Chikou cusp level or flat zones of Kijun and Tenkan
For the various static price structures it is possible to refer to the chart where the structures identified by the flat moments of Tenkan, Kijun, Senkou Span A and Senkou Span B on different timeframes are plotted, also Chikou for the daily timeframe.
In addition, recall that the various Ichimoku lines serve as dynamic price structures: the Tenkan Sen (short-term), the Kijun Sen (medium-term) as well as the Senkou Span A and Senkou Span B (long-term).
Fibonacci:
The Fibonacci levels on the Daily still show us a long-term negative sentiment and places the 0 downside at 25000.00.
Conclusion:
The situation is bearish.
Hosoda waves indicate a bearish ABC pattern with targets at 20765, 19210, 17655, 17365.
From a fundamental point of view, the war, the energy crisis and inflation still do not see a solution.
It is important to assess the close of the week and during the week on the following price structures:
- Bullish/Lateral: 20400
- Bearish: 18400
Altcoin Cycle:
For Bitcoin Dominance and the Altcoin Cycle we can consider the weekly variation:
- Total cryptocurrency market capital: Decreased.
- Dominance of BTC: Decreased.
- Price of BTC: Decreased.
- Alt cycle expectation: Stable.
Thanks for your attention, happy to support the TradingView community.
Indicators used:
Analysis Tool
Kijun Trend Indicator
Ichimoku Support and Resistance
Chikou Support and Resistance

✅ETHEREUM LOCAL LONG🚀
✅ETHEREUM will soon retest a key support level
So I think that the pair will make a rebound
And go up to retest the supply level above
LONG🚀
✅Like and subscribe to never miss a new idea!✅

Final Equilibrium of BTC Entropy states It appears that #BTC is nearing is entropies' final state and about to embark on slow harmonic rise with lower volatility cycles as evident from historical data analysis.

Bitcoin - Low volume foreshadows upcoming liquidity issues The price of Bitcoin stayed flat over the weekend. Additionally, nothing significant has occurred in the cryptocurrency market; therefore, we have no reason to change our bearish views on BTCUSD. This week, we will continue to pay close attention to volume levels hovering around monthly lows and reflecting a little interest in Bitcoin among new investors, making it impossible to reverse the primary trend from bearish to bullish.
Despite that, we continue to see an increase in false calls for the market bottom. That confirms no capitulation has occurred, and indeed, retail investors continue to buy dips, feeding wild rallies predestined to fall later. We expect this behavior to persist throughout the second stage of the bear market, increasing overall volatility.
Additionally, we expect the same from the FED pursuing another rate hike in November 2022. Accordingly, we think this will worsen economic conditions and lead to another selling frenzy. Thus, we remain committed to our price targets and expect them to be hit by the year's end. After that, we expect the market to start slowly progressing into the third stage of the bear market, characterized by the distress selling and abandonment of hopes and dreams among those who once fed the bubble.
Our price targets are 17 500 USD and 15 000 USD.
Illustration 1.01
Illustration 1.01 displays the daily chart of BTCUSD. The red arrow shows declining volume, hinting at liquidity issues in the system. To confirm our bearish thesis, we would like to see a pick-up in volume accompanying a decline in the price.
Technical analysis - daily time frame
RSI, MACD, and Stochastic are all bearish. DM+ and DM- are neutral. Overall, the daily time frame is slightly bearish; however, the trend is still weak.
Illustration 1.02
Illustration 1.02 shows the daily chart of BTCUSD. The yellow arrow points to the exhaustion we presented a few days ago. Interestingly, the price halted its rise slightly above the 50-day SMA.
Technical analysis - weekly time frame
RSI, MACD, Stochastic, DM+, and DM- are all bearish. Overall, the weekly time frame is bearish.
Please feel free to express your ideas and thoughts in the comment section.
DISCLAIMER: This analysis is not intended to encourage any buying or selling of any particular securities. Furthermore, it should not be a basis for taking any trade action by an individual investor. Therefore, your own due diligence is highly advised before entering a trade.

DERO Could Pump From Here Greetings everyone!
This is my first idea to publish. Correct me if I am wrong but it seems to me Dero is looking at a nice move up. But first it will retrace as it shows on my chart.
It had a heavy pump last year, plus the project is amazing in my opinion.
Not financial advise trade at your own risk.


S&P 500 Another Alternative Bearish Perspective. 😁this chart complete over sold not go down complete all correction ready to big run 🤷 US500 .

$BTC Bitcoin is clearly forming a bearish downtrend rising wedgeAs you can see in my chart Bitcoin is forming a Bearish downtrend Rising Wedge in Daily TF. Success rate of this pattern is 65%-70% and target is $19.2k
At this point, Bitcoin tackles a resistances at $25k-25.5k level, SMA-100 and Ichimoku Cloud...

CHZ all my ideasHere are some ideas im looking on chz coin . comment below what yuo think and if yuo have some other ideas on this coin

COIN MORE BLOOD TO BE SPILLED $$$You may recall from my earlier analysis of COIN that it was trading in an ascending channel. However, following today's market sell-off, COIN has broken that support and is now trading in an ascending wedge channel, signaling that the bloodbath isn't quite finished.

COIN BULLISH AND BEARISH SCENARIO $$$As you can see, after breaking the major support, COIN formed an ascending channel showcasing higher highs and higher lows indicating that it wants to retest the support turned resistance; if the bulls are able to break through, we can expect bullish price action with the resistance turning back to the support however if we fail to break through, we can expect bearish price action.

Weekly Analysis BTC via Ichimoku by TheSocialCryptoClubGood start to the week,
As usual, here is our analysis of the week looking at a glance at the daily chart of BINANCE:BTCUSDT using the Ichimoku Kinko Hyo indicator with traditional settings. We used in support other indicators that we developed and released Open Source, you can find them at the end of the analysis.
Trend:
Kumo has been red for 30 days and is expanding (currently at about 9.8%). In concert the situation is bearish and slightly flat over the long term. Now the price is on the Tenkan so in a balanced situation on the short term.
The Kijun Trend indicator continues to indicate looking for short positions.
Heikin-Ashi:
The Heikin-Ashi confirms the bearish movement.
Supports and resistances:
- 25000.00 by Fibonacci
- 24600.00 Tenkan Weekly
- 23400.00 Chikou cusp level or flat zones of Kijun and Tenkan
- 22400.00-22600.00 Chikou cusp level or flat zones of Kijun and Tenkan
- 20200.00 Chikou cusp level or flat zones of Kijun and Tenkan
- 20000.00 psychological threshold
- 19100.00-18900.00 level cusps Chikou or flat zones of Kijun and Tenkan
- 17080.00level cusps Chikou or flat zones of Kijun and Tenkan
- 12700.00from the waves of Hosoda
- 11000.00-13000.00 level cusps Chikou or flat zones of Kijun and Tenkan
For the various static price structures, reference can be made to the chart where the structures identified by the flat moments of Tenkan, Kijun, Senkou Span A and Senkou Span B on different timeframes, also Chikou for the daily time frame, are plotted.
Also, recall that the various Ichimoku lines serve as dynamic price structures: the Tenkan Sen (short term), the Kijun Sen (medium term) as well as the Senkou Span A and Senkou Span B (long term).
Fibonacci:
The Fibonacci levels on the Daily still show us a positive long-term sentiment and places the 0 to the upside on 75000.00. Price is moving away from level 1 represented by 250000.00
Conclusion:
The situation is bearish as all the lines indicate.
Hosoda waves indicate an ABC pattern with targets at 17741.19, 22414.21, 27087.23, 27472.02.
From a fundamental point of view, between war, inflation, and energy issues, the situation is not changing and the markets will probably not improve before these issues are resolved either. Etherium's move to PoS has also been received more as a "sell the news."
It is important to assess the close during the week on the following price structures:
- Bullish/Lateral: 21800.00-22400.00
- Bearish: 18773.00
Altcoin Cycle:
For Bitcoin Dominance and Altcoin Cycle we can consider the weekly variation:
- Total cryptocurrency market capital: Decreased
- BTC Dominance: Increased.
- Price of BTC: Decreased.
- Alt Cycle Expectation: Decreased fast.
Thanks for your attention, happy to support the TradingView community.
Indicators used:
Analysis Tool
Kijun Trend Indicator
Ichimoku Support and Resistance
Chikou Support and Resistance


Litecoin: Fundamental "Good", Position for Long with TechnicalLitecoin (LTC) is a cryptocurrency that was designed to provide fast, secure and low-cost payments by leveraging the unique properties of blockchain technology.
To learn more about this project, check out our deep dive of Litecoin.
The cryptocurrency was created based on the Bitcoin (BTC) protocol, but it differs in terms of the hashing algorithm used, hard cap, block transaction times and a few other factors. Litecoin has a block time of just 2.5 minutes and extremely low transaction fees, making it suitable for micro-transactions and point-of-sale payments.
Litecoin was released via an open-source client on GitHub on Oct. 7, 2011, and the Litecoin Network went live five days later on Oct. 13, 2011. Since then, it has exploded in both usage and acceptance among merchants and has counted among the top ten cryptocurrencies by market capitalization for most of its existence.
The cryptocurrency was created by Charlie Lee, a former Google employee, who intended Litecoin to be a "lite version of Bitcoin," in that it features many of the same properties as Bitcoin—albeit lighter in weight.
Buy Setup
Entry : 43.80 - 52.50
SL : 38.13
TP1: 54
TP2: 56
TP3: 59
TP4: 62
TP5: 66
TP6: 70
TP7: 75
TP8: 81
TP9: 90
TP10: 100
TP11: 112
TP12: 125
TP13: 140
TP14: 155
TP15: 170
TP16: 187
TP17: 214
Spot and Future (1x, 2x, or 3x)
Run and keep it enjoy!
Follow me! Copy my trades!
TradeSetup_Reza

Bitcoin Monthly chartWe see a lot of supports in the area of 11-14K. Also, there are large volumes around 9K that the price can touch by some long squeeze. We need just a reason to panic.
The way to make money is to buy when blood is running in the streets
Best regards EXCAVO
