Is Gala breaking descending trendline?As we can see on the chart Gala seems breaking its trendline. It may increase up to its ath point or beyond.
If it cannot breaks trendline, it may continue to dropping between two blue lines.
Note: This is not a financial advise. This is just for personal training.
COIN-M

CoinBase - Price Objective... LESS THAN ZEROThis raging POS of Junk Co is doomed.
One by one the ALT CONs are failing.
Poof another one.
Oh no, another.
Eff me, WTF... another.
Tether me this... why are Investors unable
to recover their funds?
WHY?
Cuz they are being stolen...
Ding, winner.
Don't end up a whiner in whiner world,
you can always trade Futures in BTC/ETH
and not be a Bilbo Baggins.
______________________________________
CON.Base will go kablewie...it will crack and
fail.
iron Man said so, Tony Stark... isn't wrong.

Bitcoin - Bullish inverse head and shoulder formation Looks like Bitcoin is forming a Bullish inverse head and shoulder in 4h TF.. target of this H&S should be 24-25k

Bitcoin UpdateSo far Bitcoin Still hold above the MA-100 and the bottom of the Ascending Channel ...
Seems to me like a Bear TRAP 🐻🩸😁

COIN- Fundamental and technical analysis****NOT THE INVESTMENT ADVICE**** I'm neutral in my assessment. Please do your own due diligence.
In this analysis, I leave out external and macro factors such as crypto adoption and regulatory concern. Rather, I want to focus on things Coinbase can control.
Main points-
To start off, I believe Coinbase has the bright future and its biggest risk is the execution risk. However, in order for it to succeed, few conditions need to be fulfilled.
***The big bets need to take off (NFT market place, potential derivative offerings & Dapp marketplace and Coinbase wallet). When they do, the subscription and service revenue would go up and the decoupling may happen (crypto market price crash will have less effect on the COIN price) or at the very least Coinbase will be less dependent on the trading revenue, which currently accounts for 87% of the total revenue).
***NFT marketplace must take off next year- Both FTX and Binance have tried, but they failed to win the significant market share from OpenSea. What other strategies does Coinbase have to win market shares from OpenSea other than enhanced social features and trading fee waiver when the overall pie isn’t growing? (NFT trading volume and floor price are trending lower)
***Coinbase wallet must acquire more market share- How can Coinbase monetize the wallet when the market-leader MetaMask is provided for free? The success of Coinbase wallet is essential so Coinbase doesn’t become just another fiat on-ramp provider. It’s also instrumental to Coinbase’s overarching strategy of becoming all-encompassing platform where users can access all crypto-related activities.
***How to extract more revenue from institutional investors? Any strategies to increase the custodial fee and commerce fee?
The upside-
Cardano staking- Most of the subscription and service revenue come from the blockchain reward and the blockchain reward itself is consisted of mostly staking revenue. Cardano staking may further boost the blockchain reward revenue when it’s already the second biggest revenue source for Coinbase.
Coinbase is focusing on its long-term vision- DeFi, Protocols+Web Infra and NFT/Mertaverse account for 60% of Coinbase’s ventu res portfolio. This is important as most major use cases in crypto ecosystem come from DeFi, NFT and DAO space.
Still the most trusted brand with advanced and industry-leading security features. It has the security infrastructure and regulatory compliance advantage against international competitors such as FTX and Binance. While against domestic competitors such as Gemini and Kraken, it has the crypto offering advantage.
Strong balance sheet enables Coinbase to acquire competitors during the crypto winter. Most of its long-term debts are convertible notes with the earliest maturity date in 2026.
Still the leader of regulated U.S exchanges based on the spot volume, around 46% in 2021. Coinbase has recently become the first-ever crypto firm to join the Fortune 500 list of the largest U.S. firms by revenue. One caveat is that there are no strong barrier and switching cost that would prevent Coinbase customers from going to another exchange. More sustainable moat can be achieved if Coinbase can create a platform that provides all-access to crypto activities, realizing its long-term vision of becoming the Amazon of crypto services.
Problem diagnosis-
Verified user, trading volume, MTU and ATRPU are the most important metrics to watch out for in addition to other common financial metrics.
The persistent theme is that the the declining trade volume and MTU (Monthly transacting users) are hurting Coinbase.
Trading revenue accounts for 87% of overall revenue, the rest in subscription and service revenue, mostly in blockchain reward from staking.
Retail only accounts for 23% of trading volume, but it accounts for 95% of trading revenue- Retail actually pays 14x the fee compared to institutional. Not much revenue is generated from institutional clients even though they dominate the trading volume because they receive deep discount for executing large trade, bringing in the flow, proving liquidity and acting as market makers. As soon as there’s some regulatory clarity, trading fee erosion can happen when bigger financial institutions and banks decide to enter the space, leading to the race to the bottom effect.
Decline in retail trading volume while Institutional trading volume actually went up during the same time- Altcoins now account for fully 55% of transaction volumes and they are likely contributing to the rapid decline of retail transaction volume. Retails trade a lot of altcoins during the bull market and they stop trading altcoins in bearish market or when the volatility is low. Institutionals, on the other hands, trade mostly in Bitcoin and Ethereum and their trading volume is less affected by the market downturn. One could argue that this is the downside of adding more risky assets on the platform as it adds more volatility during the bear market, though these same assets flourish and bring in a lot of revenue during the bull market. Therefore, it’s a double edged sword.
Increase in verified users and MTU may not translate to increase in ATRPU- Increasingly, users are engaging in more non-trading activities such as yield-generating staking which generates far less revenue than high-fee trading activities. This is not necessarily a bad thing as Coinbase has always been pushing for a more diversified revenue stream.
In summary, Coinbase will likely continue to have more verified users, but even if those verified users become MTU, it may still experience the decline in revenue and ATRPU because of the decline in retail trading volume, trading activity and trading fee unless Coinbase can somehow find ways to extract more revenues from institutional clients and increase the percentage of the subscription and service revenue in total revenue.
The downside-
Weakening guidance as the company anticipated further decline in trading volume and MTU in 2022
Horizontal analysis revealed that Equity-Based Compensation (EBC) and SG&A ballooned while revenue suffered this quarter, leading to the weakening operating leverage. This concern is somewhat addressed during the recent 18% layoff as Coinbase aims to keep the EBITDA loss around 500 mil in the face of decline ATRPU, NOPAT and FCF.
Impairment cost rule means Coinbase could suffer more non-cash loss on its crypto asset investment in the near future if the market selloff triggered by the Terra/Luna debacle and over-leverage unwind continues.
Despite the strong balance sheet, customer custodial funds account for nearly 50% of the total asset, making Coinbase susceptible to the potential bank run risk.
Coinbase recently filed shelf registration statement with the SEC. Just a minor concern as It has no intention to issue any new stocks anytime soon.
Structural and ecosystem risk- Coinbase has strong interdependent and venture capital relationship with many crypto firms it invests and supports in its venture portfolio. Any insolvency and liquidity issues these firms experience during the prolonged bear crypto market could potentially have the negative impact on Coinbase’s operation.
In summary, Coinbase has never been hit by bad macro environment and crypto downturn at the same time. In order for it to navigate through the current bear crypto market, Coinbase needs to apply the combination of financial prudence and execution nimbleness while making sure the development of high-priority product and service can continue unaffected.

COIN - QQQ OverlayCOIN appears to be trading more in line with the NASDAQ than Bitcoin, I think there are better plays out there if you are bearish on BitCo(i)n.

Coinbase - JunkCo $5 to $10 aheadJunkCo Junk.
Network is too slow.
Fees too high...
Race for exits... oh, sorry... we're down due to Bits and Bites.
Yer screwed, trapped, and gapped.
Don't be a sucka.

Bitcoin - Is choppy price action due to end in a week?Bitcoin continues its choppy price action within the rectangle pattern (neutral zone). Its recent failures to move substantially higher from the resistance level suggest that not enough buyers are stepping into the market. That is also reflected in the low volume, which is significantly lower than just a few months ago. In addition to that, on 15th June 2022, the FED is set to increase interest rates and proceed with further steps toward economic tightening. We expect these developments to put more pressure on the U.S. stock market, to which Bitcoin is highly correlated. As a result, we expect the stock market to halt the bear market rally and reverse downward. Therefore, we have no reason to change our bearish view on BTCUSD; our price target stays at 25 000 USD.
Illustration 1.01
The picture shows the hourly chart of BTCUSD. It can be observed that Bitcoin has been moving mostly sideways for the past few weeks. As a result, the rectangle was formed; the upper bound acts as resistance while the lower bound acts as support. Red arrows indicate recent false bullish breakouts from the pattern.
Technical analysis - daily time frame
MACD is bullish but stays in the bearish area. Stochastic is bullish. RSI is neutral. DM+ and DM- produce whipsaws. ADX declines. Overall, the daily time frame is neutral.
Illustration 1.02
The picture above shows the difference in volume size between the previous bull market and the current bear market.
Technical analysis - weekly time frame
RSI, MACD, Stochastic, DM+, and DM- are all bearish. Overall, the weekly time frame is bearish.
Please feel free to express your ideas and thoughts in the comment section.
DISCLAIMER: This analysis is not intended to encourage any buying or selling of any particular securities. Furthermore, it should not serve as a basis for taking any trade action by an individual investor. Therefore, your own due diligence is highly advised before entering a trade.

$COIN BIG % GAINERZWe can play the break of 57.99 here and look for a quick scalp due to price being so far out from the baseline causing an oversold disequilibrium we should be more careful with holding these ones overnight

COIN will go up It's about me reason of this corp.. COIN will go by 123 GAP strategy to 65$ - 105$.
This is not a financial advice LMAO.

XRPUSDTHello trader
#XRPUSDT
⚜️Type: SELL/SPOT
🎚EP: 0.3988
✅TP1: 0.3944
✅TP2: 0.3900
✅TP3: 0.3864
✅TP4: 0.3829
✅TP5: 0.3777
✅TP6: 0.3714
⛔️SL:0.4040
if you like this position or you have any comments for it leave a comment here for me and share it with your friends.

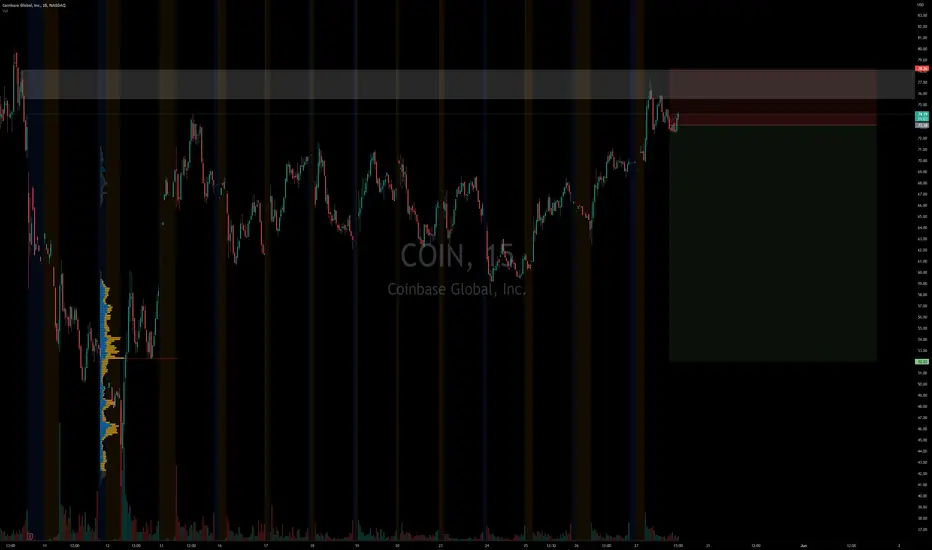
BTCUSD / COINBASE Correlation I have been watching how the Coin base equity stock is trading compared to Bitcoin . We are able to spot very good trading opportunities, such as the bear trap shown above.
As of now, $COIN closed at 75.29 on Friday afternoon, which is above last weeks highs. Most people will try to go long because they consider that a breakout.
On the other hand, on Friday BTCUSDT was near the lows of last weeks. Now, its at near highs.
I have already published another idea explaining why COIN is a sell. Will be following my stop loss and take profit levels.
I'll be quick to switch sides if i see the right price action.

Luna Classic , from the ashes we rise Anything can happen wil luna classic , its like dogecoin now
The new luna will launch on 28th may (tomorrow)
Fresh new start , goodluck all
NO FINANCIAL ADVICE

Weekly Analysis BTC via Ichimoku by TheSocialCryptoClubGood weekend,
As usual, here is our analysis of the week looking at a glance at the daily chart of BINANCE:BTCUSDT using the Ichimoku Kinko Hyo indicator with traditional settings. We used additional indicators that we have developed and released Open Source, you can find them at the end of the analysis.
Trend:
Kumo has been red for 35 days, getting even thicker than last week (now at about 17.64%), and continues to slope downward. The only flat line is the Tenkan, all others indicate a downtrend.
The Kijun Trend indicator always indicates looking for short positions.
Heikin-Ashi:
Throughout the week the Heikin-Ashi indicates indecision but still downtrend and price is attracted to the Tenkan.
Supports and resistances:
- 75000.00 from Fibonacci
- 67000.00 from all-time high
- 66001.41 from all-time high of Chikou
- 51800.00-52600.00 from Ichimoku Flat/cusp areas of the Chikou
- 49000.00-51000.00 Fibonacci, psychological threshold and Kijun Weekly
- 44400.00-45600.00 from Ichimoku Flat/cusp areas of the Chikou
- 41200.00 from Ichimoku flat/cusp areas of the Chikou
- 39400.00 from Ichimoku flat/cusp areas of the Chikou
- 37000.00 from Ichimoku flat/cusp areas of the Chikou
- 35700.00 from Fibonacci
- 35000.00 from Ichimoku flat/cusp areas of the Chikou
- 33500.00 from Ichimoku flat/cusp areas of the Chikou
- 30300.00 from Ichimoku Flat/cusp areas of the Chikou
- 25000.00 from Fibonacci
For the various static price structures you can refer to the chart where the structures identified by the flat moments of Tenkan, Kijun, Senkou Span A and Senkou Span B on different timeframes are plotted, also Chikou price for the daily time frame.
Also, recall that the various Ichimoku lines serve as dynamic price structures: the Tenkan Sen (short term), the Kijun Sen (medium term) as well as the Senkou Span A and Senkou Span B (long term).
Fibonacci:
The Fibonacci levels on the Daily still show us positive long-term sentiment and places the 0 upside on 75000.00. Price is now between level 1 at 25000.00 and 0.786 on 35700.00.
Conclusion:
BTC continues to be in a downtrend on the daily and weekly time frame. All lines confirm this and only the Tenkan is flat. The Weekly Kijun is falling abruptly.
The well-known exponential moving averages often used in the Crypto market on the 200, 50 and 20 periods are also lined up in downtrend and continue to fan out.
An interesting element is the Hosoda waves that signal an ABC pattern with the C point on the 2022-05-12 low, there are no rising lows and in fact the NT target is at 16245.00 while the N target is at 37734.84. Levels to consider.
From a fundamental point of view, we can always consider the correlation with U.S. equities in this inflationary situation, as well as aspects related to conflict and rising commodity prices.
It is important to evaluate the closing of the week and during the week on the following price structures:
- Bullish: 31600.00
- Bearish: 29000.00
Altcoin Cycle:
For Bitcoin Dominance and Altcoin Cycle we can consider the weekly variation:
- Total cryptocurrency market capital: Increased.
- BTC Dominance: Increased.
- Price of BTC: Increased.
- Alt Cycle Expectation: Decreased.
Thanks for your attention, happy to support the TradingView community.
Indicators used:
Analysis Tool
Kijun Trend Indicator
Ichimoku Support and Resistance
Chikou Support and Resistance

Bitcoin and the LineSo yes, since April 21, the line has been important to the price as both support and resistance. Over it on a 4 hour candle and it's a go to the upside, probably 32,500. Cracking down from here would be bearish. The fact that they keep hanging around the line make me think they want to cross it, but of course that can change on a dime.

It's all over now, baby BTCUnder 20k likely by June but then a nice bounce for the faithful. I explain why in the video. Enjoy

COINBASE and its unique signalCoinbase (COIN) has been trading within a long-term Channel Down ever since its November 09 2021. It is trading both below the 1D MA50 (blue trend-line) and the 1D MA200 (orange trend-line). Even though the 1D RSI rebound below the 30.000 oversold levels, resembles the Lower Low January 28, it is the MACD that offers the best tradeable signal.
As you see, every time the MACD on the 1D time-frame makes a clear Bullish Cross, the price rises. Those short-term rebounds have been +11.70%, +20.26%, +23.00% and +28.50%. Our suggestion is to wait for the bullish cross and then buy for at least a +11% rebound. If contained below the 1D MA50, the Channel Down will remain valid.
--------------------------------------------------------------------------------------------------------
Please like, subscribe and share your ideas and charts with the community!
--------------------------------------------------------------------------------------------------------

Coinbase: Lawsuits over 'stablecoins'!!Coinbase
Short Term - We look to Sell at 79.05 (stop at 97.30 )
The primary trend remains bearish. We are assessed to be in a corrective mode higher. A move higher faces tough resistance and we remain cautious on upside potential. Preferred trade is to sell into rallies. Further downside is expected.
Our profit targets will be 30.50 and 25
Resistance: 70.00 / 75.00 / 80.00
Support: 65.00 / 60.00 / 55.00
Please be advised that the information presented on TradingView is provided to Vantage (‘Vantage Global Limited’, ‘we’) by a third-party provider (‘Signal Centre’) . Please be reminded that you are solely responsible for the trading decisions on your account. There is a very high degree of risk involved in trading. Any information and/or content is intended entirely for research, educational and informational purposes only and does not constitute investment or consultation advice or investment strategy. The information is not tailored to the investment needs of any specific person and therefore does not involve a consideration of any of the investment objectives, financial situation or needs of any viewer that may receive it. Kindly also note that past performance is not a reliable indicator of future results. Actual results may differ materially from those anticipated in forward-looking or past performance statements. We assume no liability as to the accuracy or completeness of any of the information and/or content provided herein and the Company cannot be held responsible for any omission, mistake nor for any loss or damage including without limitation to any loss of profit which may arise from reliance on any information supplied by Signal Centre.

COIN COINBASE heading for 50/51 coinbase on NasdaqCOIN COINBASE heading for 50/51 coinbase on Nasdaq

I've had the same conversation every day this week...Diversifying from crypto... you're doing it wrong.

coinbase. from hereMost likely exhaustion volume is here. Shes down 85% .. earnings were okay.. balance sheet is okay....
IT CAN go lower probably does... however, active trade it bullish / day trade and start accumulating smaller...? 10 shares a week ?

btc harmonic patternhi
We can consider the possible path of bitcoin in this way in the most optimistic way possible
