COIN Don't Miss Out
## 🚨 COIN WEEKLY TRADE IDEA (Aug 4–8)
**Bullish Setup Despite Mixed Signals — \$330 CALL ON WATCH**
---
### 🧠 Model Consensus:
* **📈 Weekly RSI** = bullish recovery potential
* **📉 Daily RSI** = bearish pressure, short-term caution
* **📊 Volume** = Institutional activity spotted
* **🧠 AI Models**:
* **Grok & Claude** = Bullish bias ✅
* **Gemini** = Bearish, sees distribution ❌
* **Meta & DeepSeek** = Neutral, sit-tight ⚖️
🧭 **Net Bias: MODERATE BULLISH** (But choppy daily tape)
---
### 🔍 Trade Setup:
| 🎯 Strike | 🎯 Entry | 🎯 Target | 🛑 Stop | ⏳ Expiry | 🎯 Confidence |
| ---------- | -------- | --------- | ------- | -------- | ------------- |
| \$330 CALL | \$4.00 | \$5.00 | \$2.50 | Aug 8 | 65% ✅ |
📍 **ENTRY TIMING:** At open
📍 **VIX Conditions:** Supportive (low-vol = favor gamma grind)
📍 **Risk Trigger:** Exit on close under \$315 or stop hit
---
### ⚠️ Key Risks:
* Daily RSI → 🟥 still bearish = choppy path
* Sector-wide pressure (crypto news, SEC)
* Negative macro or earnings = fast invalidation
---
### 🔥 Tags:
`#COIN #Coinbase #OptionsTrading #CallOption #BullishBias #GammaSqueeze #AITrade #TradingView #WeeklySetup #MomentumPlay`
Coinanalysis

Coinbase (COIN) Shares Reach All-Time HighCoinbase (COIN) Shares Reach All-Time High
According to the chart of Coinbase Global (COIN), the share price of the cryptocurrency exchange has reached a historical all-time high (closing price).
The bullish sentiment has been supported by the following factors:
→ Bitcoin price rally. Yesterday, we analysed the BTC/USD chart and anticipated that bulls might attempt to set a new record. Following the publication, Bitcoin made a strong upward move, breaking above the $118,000 level.
→ Passage of the GENIUS bill in the US , which establishes a regulatory framework for the use of stablecoins.
Can COIN stock continue to climb?
Technical Analysis of Coinbase (COIN) Share Price
At the end of June, our analysis of the COIN chart highlighted the following:
→ From a broader perspective, COIN’s price fluctuations over the past year had formed an ascending channel (marked in grey).
→ The ongoing intermediate rally (marked in blue) had the potential to drive the price towards the upper boundary of this grey channel.
This scenario has materialised: today, COIN shares are trading near the upper edge of the grey channel. However, several factors now warrant a bearish outlook:
→ The upper boundary of the channel may act as resistance;
→ The psychological level of $400 could also serve as resistance;
→ Shareholders may be tempted to lock in profits;
→ A potential bearish divergence on the RSI indicator.
It is possible that in the near term, COIN bulls will attempt to break through the $400 level. However, if buying momentum weakens, the conditions may favour a price correction — which would appear justified after a nearly 60% rally since early June.
This article represents the opinion of the Companies operating under the FXOpen brand only. It is not to be construed as an offer, solicitation, or recommendation with respect to products and services provided by the Companies operating under the FXOpen brand, nor is it to be considered financial advice.

Coinbase (COIN) Shares Hit Year-to-Date HighCoinbase (COIN) Shares Hit Year-to-Date High
As we reported six days ago, shares of Coinbase Global (COIN) received a strong bullish boost after the US Senate approved the GENIUS bill, which sets out regulations for the use of stablecoins.
As the Coinbase Global (COIN) stock chart shows, the rally is ongoing. Yesterday, the price surged by over 12%, once again becoming the top performer in the S&P 500 index (US SPX 500 mini on FXOpen).
Bullish sentiment is being fuelled by news that:
→ Two funds managed by Cathie Wood’s Ark Invest acquired around 4,200 Coinbase shares;
→ Analysts at Benchmark raised their target price for Coinbase Global (COIN) from $301 to $421.
Could the COIN share price continue to rise?
Technical Analysis of the Coinbase (COIN) Stock Chart
From a broader perspective, the COIN share price has formed an ascending channel over the past year (marked in grey), and only once — in reaction to news about Trump tariffs — did the price briefly fall outside of this channel.
Based on this, it is reasonable to assume that the developing intermediate rally (highlighted in blue) could reach the upper boundary of the grey channel. However, the psychological level of $350 — near the 2024 peak — appears to be a significant resistance point on this path.
It is possible that we will soon see this level act as resistance on the COIN stock chart, leading to the formation of a correction — which would seem appropriate after a nearly 40% price increase since the start of the month.
This article represents the opinion of the Companies operating under the FXOpen brand only. It is not to be construed as an offer, solicitation, or recommendation with respect to products and services provided by the Companies operating under the FXOpen brand, nor is it to be considered financial advice.

Coinbase: Surging HigherCoinbase has surged sharply above the $275.90 level, prompting us to consider green wave finished. Now, we see the stock advancing in wave , which still has more upside potential to finalize light green wave a. Afterward, we expect a corrective pullback in wave b, which may dip below $275.90, before green wave c resumes the advance, thus completing orange wave b distinctly above $275.90.
📈 Over 190 precise analyses, clear entry points, and defined Target Zones - that's what we do.

Coinbase Shares Rise Following Stablecoin Legislation ApprovalCoinbase (COIN) Shares Rise Following Stablecoin Legislation Approval
Shares in Coinbase Global (COIN) surged by 11% yesterday, making the company the top performer in the S&P 500 index (US SPX 500 mini on FXOpen).
The sharp rise was driven by news that the US Senate has approved the GENIUS stablecoin bill, which sets out a regulatory framework for the use of stablecoins — crypto assets whose value is pegged to another currency or financial instrument, such as the US dollar.
The bill (which still requires approval from the House of Representatives) would pave the way for banks, fintech companies, and other financial market participants to use stablecoins. This development acted as a strong bullish catalyst for COIN shares.
Technical Analysis of Coinbase (COIN) Share Price Chart
In our previous analysis of the COIN share price chart, we:
→ identified an ascending channel (shown in blue);
→ suggested that the COIN share price could rise towards the psychological level of $300.
That projection has played out — the price is now very close to the $300 mark. So, what comes next?
In a bold, optimistic scenario, buyers may hope for a continuation of the rally, with the share price pushing towards the upper boundary of the long-term ascending channel, especially following the recent news. In the medium term, the blue ascending channel may remain relevant, given the strong signal of improved cryptocurrency regulation in the US legislative framework.
However, we also note some vulnerability to a pullback, as:
→ the $300 level may act as significant resistance;
→ the price is approaching the upper boundary of the blue channel, which also shows resistance characteristics;
→ once the initial wave of positive sentiment fades, some investors may look to take profits, especially given the more than 20% rise in Coinbase (COIN) shares since the beginning of the month.
This article represents the opinion of the Companies operating under the FXOpen brand only. It is not to be construed as an offer, solicitation, or recommendation with respect to products and services provided by the Companies operating under the FXOpen brand, nor is it to be considered financial advice.

Why Coinbase (COIN) Shares Are RisingWhy Coinbase (COIN) Shares Are Rising
As the Coinbase (COIN) stock chart shows, trading closed yesterday above the $200 mark — for the first time since March.
Since the beginning of April, COIN's share price has risen by nearly 20%, while the S&P 500 index (US SPX 500 mini on FXOpen) has declined by approximately 2%.
Bullish Drivers Behind COIN’s Price Rise
According to media reports, several factors are contributing to the bullish momentum:
→ Yesterday’s announcement that Coinbase and PayPal are expanding their partnership in the areas of crypto payments and decentralised finance (DeFi). The collaboration aims to increase the adoption of the PYUSD stablecoin and integrate it into merchant settlements.
→ The anticipated adoption of US stablecoin legislation, designed to establish a regulatory framework for the use of stablecoins. This is being supported by the Trump administration’s progressive stance on cryptocurrencies, including the appointment of crypto-friendly officials, the creation of a strategic crypto reserve, and other pro-crypto initiatives.
Technical Analysis of COIN Stock
The psychological level of $150, which served as strong support in 2024, has proven resilient again in April 2025. However, despite the rapid rise in price from $150 to $200 in under three weeks, there are reasons to believe that bullish sentiment may begin to fade:
→ The COIN share price remains within a downward trend, highlighted by a channel originating in early 2025.
→ The upper boundary of the channel may act as a resistance level.
→ Bears have previously demonstrated control in the $225–240 zone, where the price declined sharply (marked with a red rectangle).
This article represents the opinion of the Companies operating under the FXOpen brand only. It is not to be construed as an offer, solicitation, or recommendation with respect to products and services provided by the Companies operating under the FXOpen brand, nor is it to be considered financial advice.

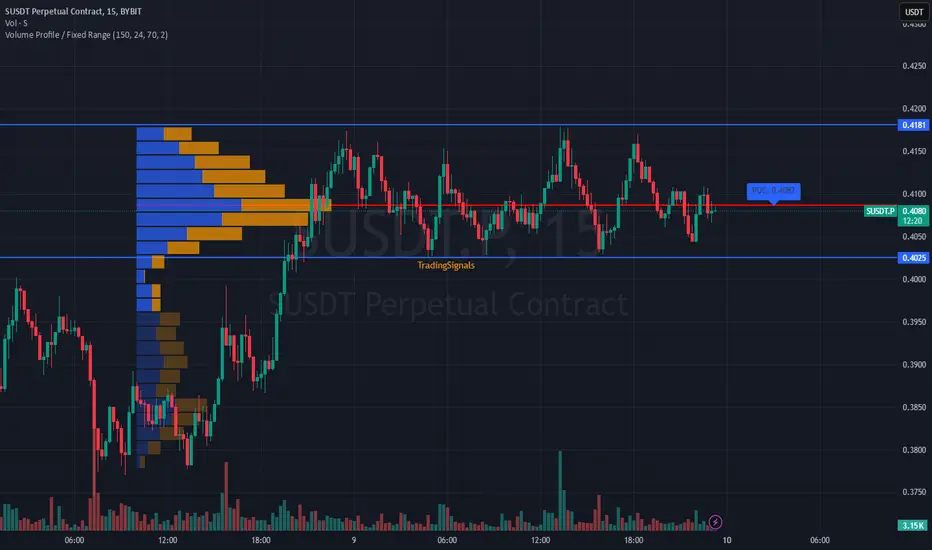
Analysis of #SUSDT – Watching for a Breakout📊 Analysis of BYBIT:SUSDT.P – Watching for a Breakout
15M TF
✅ Overview:
➡️ BYBIT:SUSDT.P is trading within a range, consolidating between $0.4025 (support) and $0.4181 (resistance).
➡️ POC (Point of Control) at $0.4087 represents the highest liquidity area, making it a key level where price could decide its next move.
➡️ A breakdown below $0.4025 could lead to further downside, as there is little strong support below this level.
➡️ If the price holds above $0.4181, we could see a push toward higher resistance levels.
⚡ Plan of Action:
📈 Bullish Scenario:
➡️ If price holds above $0.4087 (POC) and breaks $0.4181, an upward move is expected with increased momentum.
📉 Bearish Scenario:
➡️ If price drops below $0.4087 and breaks $0.4025, expect accelerated downside movement.
🚀 BYBIT:SUSDT.P is in a consolidation phase – preparing for a breakout!
📢 BYBIT:SUSDT.P is in an accumulation phase, and a breakout of key levels will determine the next trend.
📢 Watch volume closely – an increase on a breakout will confirm a stronger move.