Whales taking profits, BTC testing $30,000Bitcoin reached a new high of $31,818 last Thursday. The next day, we voiced concern over the potential trend reversal due to the falling number of Bitcoin addresses with balances exceeding 100 and 1000 tokens, implying that big players were taking profits (the same thing happened in April 2023 after Bitcoin rose above $31,000, preceding the drop below $25,000). Since then, Bitcoin has been continuously testing psychological support at $30,000. At the same time, technical indicators like RSI, MACD, and Stochastic started to develop bearish structures on the daily time frame, and volume remained relatively low. To support the bearish thesis in the short-term, we would like to see Bitcoin drop below support at $29,508. In addition to that, we would like to see MACD cross below the midpoint and DM+ and DM- converge (eventually performing a bearish crossover). Contrarily, to support a bullish thesis, we would like to see Bitcoin stabilizing above $30,000 in the next week or so (and some technical improvements on the daily chart). With regard to this possibility, we will continue to pay attention to the number of wallets with large balances. If the decline among big holders stops, it will be slightly positive (and very positive if the number starts to grow again, suggesting accumulation among big players).
Illustration 1.01
Illustration 1.01 shows the daily chart of BTCUSD and simple support/resistance levels. The red arrow indicates a decreasing volume over the past month, accompanying the rising price, which raises a question about the lack of buyers at elevated price tags (which is somewhat worrisome, considering that big players are selling).
Illustration 1.02
Illustration 1.02 displays the weekly RSI. Interestingly, during recent highs in the price of Bitcoin, the RSI peaked only slightly below 70 points. A failure of the RSI to peak above 70 points is often associated with bear markets.
Technical analysis gauge
Daily time frame = Slightly bearish
Weekly time frame = Slightly bullish
*The gauge does not necessarily indicate where the market will head. Instead, it reflects the constellation of RSI, MACD, Stochastic, DM+-, ADX, and moving averages.
Please feel free to express your ideas and thoughts in the comment section.
DISCLAIMER: This analysis is not intended to encourage any buying or selling of any particular securities. Furthermore, it should not be a basis for taking any trade action by an individual investor. Therefore, your own due diligence is highly advised before entering a trade.
Coins

Bitcoin is stuck between $30,000 and $31,500There has not been much going on in the cryptocurrency market, with Bitcoin being stuck between $30,000 and $31,500 for nearly a month now. During this time, the volume decreased, and indicators like RSI and MACD started to show signs of weakness on the daily chart. In addition to that, Bitcoin began to lag with gains behind the tech sector, which was previously exhibiting a high positive correlation with it. So, with the current choppiness in the price, we continue to wait for a breakout from the range. If Bitcoin breaks to the upside, it will be bullish for the short-term. Contrarily, if Bitcoin breaks below $30,000, it will be bearish.
Illustration 1.01
Illustration 1.01 shows the bearish setup.
Technical analysis gauge
Daily time frame = Slightly bullish (with signs of exhaustion)
Weekly time frame = Bullish
*The gauge does not necessarily indicate where the market will head. Instead, it reflects the constellation of RSI, MACD, Stochastic, DM+-, ADX, and moving averages.
Please feel free to express your ideas and thoughts in the comment section.
DISCLAIMER: This analysis is not intended to encourage any buying or selling of any particular securities. Furthermore, it should not be a basis for taking any trade action by an individual investor. Therefore, your own due diligence is highly advised before entering a trade.

BTC dominance, correlation with tech, and uncertain outlookBitcoin has been holding up above $30,000 for multiple days. At the same time, the number of large holders began to increase again (slightly), suggesting that whales are waiting for better prices and not selling yet. Overall, that is quite positive, but there are still a few things to watch out for that can cause the rally to reverse quickly. As a result, we are paying close attention to the daily chart, where several technical indicators show little signs of exhaustion. For example, MACD is flattening (potentially leading to a bearish crossover between the MACD and signal lines), RSI is struggling below 70 points, Stochastic points to the downside, and volume is very low. Ideally, for Bitcoin to continue higher, we would like to see all these components start rising again, with RSI breaking above 70 points; in such a scenario, we would expect the breakout above $31,458 and potentially $32,000. However, if RSI fails to cross 70 points to the upside in the next few days, it will be bearish for the short-term; the same will apply to the falling Stochastic and MACD.
Besides watching these technical indicators, we also look at Bitoin’s market dominance and correlation with the U.S. tech sector. In regard to market dominance, Bitcoin has been taking away a market share from its competitors for the past few months. There have been numerous factors contributing to this situation, with one being regulatory scrutiny of altcoins. We believe this trend will persist in the next few months, with the U.S. Securities Exchange Commission labeling more assets that are now deemed “cryptocurrencies” as “securities,” sparking further capital outflow from the altcoin market. In our opinion, that will help Bitcoin solidify its first place in the cryptocurrency market (and going into the future). Now, in relation to Bitcoin’s correlation with the tech sector, we saw that in late May 2023, these two markets started to decorrelate slightly. This fact has been reflected in the correlation coefficient shown in Illustration 1.03. However, when Bitcoin rose above $30,000 in late June 2023, the correlation coefficient began to tick up. Considering that the U.S. stock market valuations seem to be stretched, we think it would be prudent to watch out for what is happening in the tech sector, as its weakness can once again weigh on the risk assets like Bitcoin.
Illustration 1.01
The picture above displays the daily chart of BTCUSD. The green and red arrows show the divergence between the price and RSI from January 2023 until April 2023. We want to point out how RSI does not show significantly more strength (during the most recent rebound in Bitcoin’s price) compared to the mentioned period.
Illustration 1.02
Illustration 1.02 shows the weekly chart of BTC.D, representing Bitcoin’s market dominance.
Illustration 1.03
Illustration 1.03 portrays the daily chart of BTCUSD. Below the main chart is the correlation coefficient. It can be viewed that the positive correlation between Bitcoin and Nasdaq 100 Index started to strengthen in late June 2023.
Technical analysis gauge
Daily time frame = Bullish (with signs of exhaustion)
Weekly time frame = Bullish
*The gauge does not necessarily indicate where the market will head. Instead, it reflects the constellation of RSI, MACD, Stochastic, DM+-, ADX, and moving averages.
Please feel free to express your ideas and thoughts in the comment section.
DISCLAIMER: This analysis is not intended to encourage any buying or selling of any particular securities. Furthermore, it should not be a basis for taking any trade action by an individual investor. Therefore, your own due diligence is highly advised before entering a trade.

Young Coins - VRAUSDT This is an example of what I would call a 'young coin'. One that hasn't broken out extremely on the RSI and on chart.
These 'youngins' I would opt into heavily right now over some older coins. Extreme volatility can be your friend in some cases.
Just wait for a full breakout on the RSI, you will see the potential then. Some other coins like this include, ENS and MATIC.
This is the Monthly timeframe.

TradingView Binance All Futures USDT Pair TXT Import USDⓈ-MFull Binance USDT Futures Pairs for watchlist upload (Updated 11/06/23)
Procedure:
1.) In a new Notepad, copy and paste the list below and save as ".txt" file.
2.) Go to your watchlist (Suggest creating a new watchlist for this one) and click the 3 dots (...)
3.) Click Import list and select the file.
4.) Enjoy!
Binance:1000FLOKIUSDT.p
Binance:1000LUNCUSDT.p
Binance:1000PEPEUSDT.p
Binance:1000SHIBUSDT.p
Binance:1000XECUSDT.p
Binance:1INCHUSDT.p
Binance:AAVEUSDT.p
Binance:ACHUSDT.p
Binance:ADABUSD.p
Binance:ADAUSDT.p
Binance:AGIXBUSD.p
Binance:AGIXUSDT.p
Binance:ALGOUSDT.p
Binance:ALICEUSDT.p
Binance:ALPHAUSDT.p
Binance:AMBUSDT.p
Binance:ANKRUSDT.p
Binance:ANTUSDT.p
Binance:APEUSDT.p
Binance:API3USDT.p
Binance:APTBUSD.p
Binance:APTUSDT.p
Binance:ARBUSDT.p
Binance:ARPAUSDT.p
Binance:ARUSDT.p
Binance:ASTRUSDT.p
Binance:ATAUSDT.p
Binance:ATOMUSDT.p
Binance:AUDIOUSDT.p
Binance:AVAXUSDT.p
Binance:AXSUSDT.p
Binance:BAKEUSDT.p
Binance:BALUSDT.p
Binance:BANDUSDT.p
Binance:BATUSDT.p
Binance:BCHUSDT.p
Binance:BELUSDT.p
Binance:BLUEBIRDUSDT.p
Binance:BLURUSDT.p
Binance:BLZUSDT.p
Binance:BNBBUSD.p
Binance:BNBUSDT.p
Binance:BNXUSDT.p
Binance:BTCBUSD.p
Binance:BTCDOMUSDT.p
Binance:BTCUSDT.p
Binance:C98USDT.p
Binance:CELOUSDT.p
Binance:CELRUSDT.p
Binance:CFXUSDT.p
Binance:CHRUSDT.p
Binance:CHZUSDT.p
Binance:CKBUSDT.p
Binance:COMBOUSDT.p
Binance:COMPUSDT.p
Binance:COTIUSDT.p
Binance:CRVUSDT.p
Binance:CTKUSDT.p
Binance:CTSIUSDT.p
Binance:CVXUSDT.p
Binance:DARUSDT.p
Binance:DASHUSDT.p
Binance:DEFIUSDT.p
Binance:DENTUSDT.p
Binance:DGBUSDT.p
Binance:DODOBUSD.p
Binance:DOGEBUSD.p
Binance:DOGEUSDT.p
Binance:DOTUSDT.p
Binance:DUSKUSDT.p
Binance:DYDXUSDT.p
Binance:EDUUSDT.p
Binance:EGLDUSDT.p
Binance:ENJUSDT.p
Binance:ENSUSDT.p
Binance:EOSUSDT.p
Binance:ETCUSDT.p
Binance:ETHBTC.p
Binance:ETHBUSD.p
Binance:ETHUSDT.p
Binance:FETUSDT.p
Binance:FILUSDT.p
Binance:FLMUSDT.p
Binance:FLOWUSDT.p
Binance:FOOTBALLUSDT.p
Binance:FTMBUSD.p
Binance:FTMUSDT.p
Binance:FXSUSDT.p
Binance:GALABUSD.p
Binance:GALAUSDT.p
Binance:GALUSDT.p
Binance:GMTUSDT.p
Binance:GMXUSDT.p
Binance:GRTUSDT.p
Binance:GTCUSDT.p
Binance:HBARUSDT.p
Binance:HFTUSDT.p
Binance:HIGHUSDT.p
Binance:HOOKUSDT.p
Binance:HOTUSDT.p
Binance:ICPUSDT.p
Binance:ICXUSDT.p
Binance:IDEXUSDT.p
Binance:IDUSDT.p
Binance:IMXUSDT.p
Binance:INJUSDT.p
Binance:IOSTUSDT.p
Binance:IOTAUSDT.p
Binance:IOTXUSDT.p
Binance:JASMYUSDT.p
Binance:JOEUSDT.p
Binance:KAVAUSDT.p
Binance:KEYUSDT.p
Binance:KLAYUSDT.p
Binance:KNCUSDT.p
Binance:KSMUSDT.p
Binance:LDOBUSD.p
Binance:LDOUSDT.p
Binance:LEVERUSDT.p
Binance:LINAUSDT.p
Binance:LINKUSDT.p
Binance:LITUSDT.p
Binance:LPTUSDT.p
Binance:LQTYUSDT.p
Binance:LRCUSDT.p
Binance:LTCBUSD.p
Binance:LTCUSDT.p
Binance:LUNA2USDT.p
Binance:MAGICUSDT.p
Binance:MANAUSDT.p
Binance:MASKUSDT.p
Binance:MATICBUSD.p
Binance:MATICUSDT.p
Binance:MINAUSDT.p
Binance:MKRUSDT.p
Binance:MTLUSDT.p
Binance:NEARUSDT.p
Binance:NEOUSDT.p
Binance:NKNUSDT.p
Binance:OCEANUSDT.p
Binance:OGNUSDT.p
Binance:OMGUSDT.p
Binance:ONEUSDT.p
Binance:ONTUSDT.p
Binance:OPUSDT.p
Binance:PEOPLEUSDT.p
Binance:PERPUSDT.p
Binance:PHBUSDT.p
Binance:QNTUSDT.p
Binance:QTUMUSDT.p
Binance:RADUSDT.p
Binance:RDNTUSDT.p
Binance:REEFUSDT.p
Binance:RENUSDT.p
Binance:RLCUSDT.p
Binance:RNDRUSDT.p
Binance:ROSEUSDT.p
Binance:RSRUSDT.p
Binance:RUNEUSDT.p
Binance:RVNUSDT.p
Binance:SANDUSDT.p
Binance:SFPUSDT.p
Binance:SKLUSDT.p
Binance:SNXUSDT.p
Binance:SOLBUSD.p
Binance:SOLUSDT.p
Binance:SPELLUSDT.p
Binance:SSVUSDT.p
Binance:STGUSDT.p
Binance:STMXUSDT.p
Binance:STORJUSDT.p
Binance:STXUSDT.p
Binance:SUIUSDT.p
Binance:SUSHIUSDT.p
Binance:SXPUSDT.p
Binance:THETAUSDT.p
Binance:TLMUSDT.p
Binance:TOMOUSDT.p
Binance:TRBUSDT.p
Binance:TRUUSDT.p
Binance:TRXBUSD.p
Binance:TRXUSDT.p
Binance:TUSDT.p
Binance:UMAUSDT.p
Binance:UNFIUSDT.p
Binance:UNIUSDT.p
Binance:USDCUSDT.p
Binance:VETUSDT.p
Binance:WAVESUSDT.p
Binance:WOOUSDT.p
Binance:XEMUSDT.p
Binance:XLMUSDT.p
Binance:XMRUSDT.p
Binance:XRPBUSD.p
Binance:XRPUSDT.p
Binance:XTZUSDT.p
Binance:XVSUSDT.p
Binance:YFIUSDT.p
Binance:ZECUSDT.p
Binance:ZENUSDT.p
Binance:ZILUSDT.p
Binance:ZRXUSDT.p

Selloff is impendingYesterday, Bitcoin finally broke below $25,800 and established a new low at $25,389. This move came amid our recent speculation about Bitcoin potentially reversing the short-term/medium-term trend (from bullish to bearish). This fact is being reflected by Bitcoin making lower troughs and lower peaks after hitting $31,000 in April 2023. Due to that, we do not have any reason to change our bearish bias beyond the short term. Accordingly, we maintain our price targets of $15,000 and $13,000.
At the moment, we are paying close attention to the support at $25,270. If the price takes out this level, it will further bolster a bearish case in the short-term/medium-term. In addition to that, we are also watching RSI, MACD, and Stochastic on the daily chart; all of them are currently pointing to the downside, which is bearish. In fact, if RSI breaks below 30 points, it will likely be accompanied by significant selling pressure. Therefore, we are raising a voice of concern over the impending selloff in the cryptocurrency market.
Technical analysis gauge
Daily time frame = Bearish
Weekly time frame = Slightly bearish
*The gauge does not necessarily indicate where the market will head. Instead, it reflects the constellation of RSI, MACD, Stochastic, DM+-, ADX, and moving averages.
Please feel free to express your ideas and thoughts in the comment section.
DISCLAIMER: This analysis is not intended to encourage any buying or selling of any particular securities. Furthermore, it should not be a basis for taking any trade action by an individual investor. Therefore, your own due diligence is highly advised before entering a trade.

Uncertainty looms over the price of BitcoinOver the weekend, Bitcoin took off and broke above $27,666. Then, yesterday it reached a high of $28,452. However, Bitcoin failed to hold this level for an extended period and quickly faltered below the $28,000 price tag. What caught our attention is that Bitcoin fully retraced to the 50-day SMA, which successfully halted a buying spree. Furthermore, MACD and Stochastic started to reverse their direction to the upside, and DM+ and DM- performed a bullish crossover on the daily time frame. As a result, these developments leave us with a neutral outlook for the short-term/medium-term.
To support a bullish case (for the short-term/medium-term), we would like to see Bitcoin break above $28,500 and MACD and Stochastic continue rising on the daily chart. Conversely, to support a bearish thesis, we would like to see Bitcoin struggling to take hold of the $28,000 level and fall below $27,666; in addition to that, we would like to see DM+ and DM- start converging with MACD, Stochastic, and RSI reversing to the downside.
Illustration 1.01
Illustration 1.01 displays the daily chart of BTCUSD. The yellow arrow indicates the price retracement toward the 50-day SMA.
Technical analysis gauge
Daily time frame = Neutral
Weekly time frame = Neutral/Slightly bearish
*The gauge does not necessarily indicate where the market will head. Instead, it reflects the constellation of RSI, MACD, Stochastic, DM+-, ADX, and moving averages.
Please feel free to express your ideas and thoughts in the comment section.
DISCLAIMER: This analysis is not intended to encourage any buying or selling of any particular securities. Furthermore, it should not be a basis for taking any trade action by an individual investor. Therefore, your own due diligence is highly advised before entering a trade.

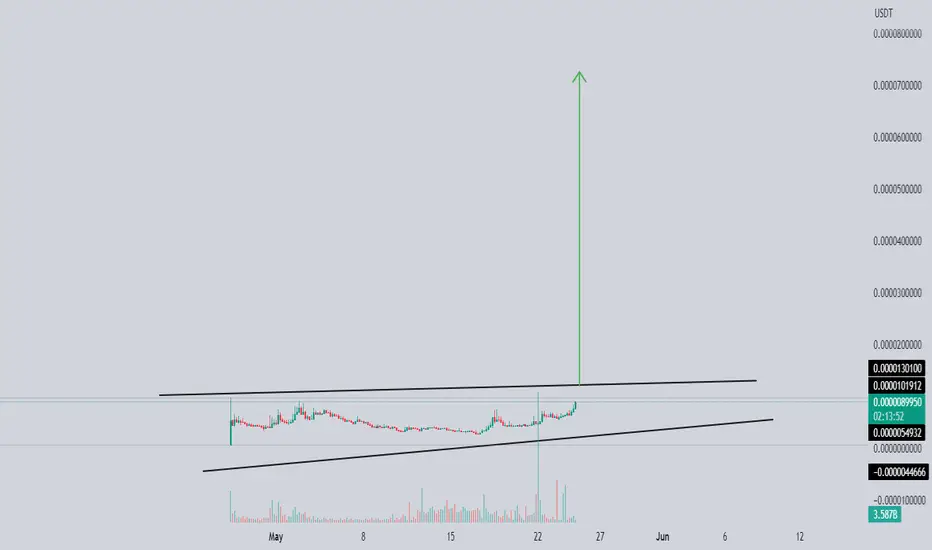
SHARBI: NEW UPTREND LEVEL 200% Meme coins are very risky and should only trading with plan.
This is TA based idea where we see depending on TA that this coin able to more then 200%
Waiting for the trend reversal to be confirmed or refutedDuring the weekend, Bitcoin's value slipped under the $27,000 mark. Despite that, the overall trading environment was quiet and without any significant technical developments that we could point to on Bitcoin’s chart. Because of that, we just continue to wait patiently for our thesis to be confirmed or refuted. To confirm the thesis about Bitcoin reversing short-term/medium-term trends (and finding increasingly more resistance when attempting to reclaim $31,000), we would like to see it drop below $25,800. Contrarily, to refute this proposition, Bitcoin would have to break above $27,666 (and then continue testing the resistance between $28,000 and $28,500). As for our general stance, it remains unchanged. We continue to think that the past six months of Bitcoin’s rally merely represent the most deceitful bear market rally up to date. With that assessment, we maintain price targets of $15,000 and $13,000.
Technical analysis gauge
Daily time frame = Bearish
Weekly time frame = Neutral
*The gauge does not necessarily indicate where the market will head. Instead, it reflects the constellation of RSI, MACD, Stochastic, DM+-, ADX, and moving averages.
Please feel free to express your ideas and thoughts in the comment section.
DISCLAIMER: This analysis is not intended to encourage any buying or selling of any particular securities. Furthermore, it should not be a basis for taking any trade action by an individual investor. Therefore, your own due diligence is highly advised before entering a trade.

Meme coinsIntroducing Meme-Coin Perspectives: Discovering the Art of Folly.
Are you familiar with the ubiquitous X's on Pepe, Doge, Shiba, and the like? These symbols have permeated the world of meme-coins, capturing the attention of many.
Now, let's delve into a captivating speculative concept known as the "Big Fool's Theory." Picture this: you knowingly acquire something seemingly worthless, fully aware that a bigger fool will emerge to purchase it at a higher price. In simpler terms, you anticipate someone eagerly buying an unnecessary wrapper at an exorbitant cost.
What lies in store for those who embark on this venture? The allure stems from witnessing numerous individuals amassing fortunes out of thin air. As a result, a fiery blend of FOMO and curiosity engulfs the hearts of onlookers, compelling them to impulsively dive into the realm of memecoins. They yearn to emulate someone else's triumph or, perhaps, acquire a memecoin that has been resold countless times, now soaring at its zenith.
Amusingly, some proponents extol the virtues of these whimsical tokens. When questioned about the benefits of such projects or their potential for growth, the answer is often a resounding, "someone else will buy."
This prompts us to ponder: how does this fundamentally differ from a casino?
In conclusion, the question remains: Can one truly profit by embracing the Big Fool's Theory, banking on the existence of a fool willing to pay a higher price? The resounding answer is yes.
Yet, pause for a moment and contemplate: Could you, in turn, become that very fool?
Best regards EXCAVO

BTC Just a retracement?BINANCE:BTCUSDT
For the home gamers stuck (forced) into HODL'ing, we can only hope....
Ribbit: $0.000 000 0 275 | one Meme to Link em All yes.. phase 3 or 4 in the playbook of the issuer is to integrate other meme coins
and DOMINATE the space
kinda like how LiNK aggregates or collects big data for curation
or how OPEN Ai ChatGPT sucks all the data across the world wide web and
turns into something COOL
depressed for allocation
playing dead for mis direction
fair launch at 100% float pre arranged for designated members of community and believers
Ribbit it GOOD
--
Cap: $11M
Designated Dealer: Bitget
Stabilizing Agent" MEXC ETH wallet: 0x0577d84512c5b834F9FB4a4cA5b9fCd3f18f2351
-
note:
exchange PETS (coins) in the meme sector go to $300M to $500M in one cycle

SHORT SETUP FOR COIN I will short COIN until 61.66 area!
The trade is very simple, we have a trend, we have a resistance and suport zones.

Binance halts BTC withdrawals and spooks the marketBitcoin futures closed slightly below the $30,000 mark (at $29,910) last Friday. However, the price took a nosedive over the weekend as Binance temporarily halted Bitcoin withdrawals and transfers, citing an overwhelming number of pending transactions. On Monday, Bitcoin futures opened at $29,105 and continued lower toward the $28,300 price tag where they currently trade. We pay close attention to MACD on the daily time frame, which continues to develop a bearish structure. In addition to that, we observe volume levels, which are considerably lower compared to a recent period when Bitcoin was moving sharply higher (in so-called spikes). That is an interesting development as the addresses with more than 100 and 1000 Bitcoins in the balance are not seen growing in number in the past two weeks; meanwhile, the number of addresses with much smaller balances continues to grow, suggesting that retail continues to accumulate. We previously expressed our beliefs that it is very likely that we will see a massive rag-pull being played on retail investors, and that continues to be the case. Our stance remains unchanged as we believe the most deceitful bear market rally continues to unravel. Accordingly, our price target for BTCUSD stays at $15,000 and $13,000.
Illustration 1.01
Illustration 1.01 displays the daily chart of Bitcoin's continuous futures. If the price breaks below the sloping support, it will bolster the bearish case in the short term. The same applies if MACD performs a crossover below 0.
Illustration 1.02
Illustration 1.02 displays the daily chart of BTCUSD across various exchanges. We would like to point out the similarity in volume trends on all these exchanges. Volume dropped significantly compared to the two previous major legs up (from around $17,000 to $25,000 and $19,500 to $31 000).
Illustration 1.03
The picture above shows simple support and resistance levels derived from peaks and troughs.
Technical analysis
Daily time frame = Neutral
Weekly time frame = Neutral
Please feel free to express your ideas and thoughts in the comment section.
DISCLAIMER: This analysis is not intended to encourage any buying or selling of any particular securities. Furthermore, it should not be a basis for taking any trade action by an individual investor. Therefore, your own due diligence is highly advised before entering a trade.

COINBASE - SHORT This chart does not look very good, we have a trend with sell and buy zones but also resistance and support zones.
We have a broken trend line so I entered short and I will close the profit in the support area where I mentioned on the chart.

Bitcoin enters proving groundsYesterday, we noted that a breakout above the Sloping resistance and 29 380$ would be bullish for Bitcoin in the short term. What led us to this quick assessment was the similarity of the pattern found on the 1-minute chart, which seemed very familiar to us. It was, once again, a quick spike in the price within a short interval (very similar to the ones we showed previously on 1-minute graphs). Shortly after that, the price broke to the upside, bringing Bitcoin to a critical zone above 30 000$.
Interestingly, this move precedes the start of earnings season in the banking sector, which helped to prop up the price recently with the crisis among regional banks. While Bitcoin’s reaction to the crisis might be considered the first potential sign of maturing and gaining more functions (than just being a speculative vehicle), let’s not forget that it still faces many obstacles that may derail it from the intended path.
These obstacles include a lack of the regulator’s clarity on its future plans, especially as central banks attempt to develop their own digital currency (CBDC). For example, there might be a potential cryptocurrency crackdown in the form of restricting money transfers to/from cryptocurrency institutions or any other forms that will make it very inefficient for a consumer to use them. Furthermore, the U.S. government still plans to unload its stash of more than 41 000 Bitcoins seized in connection to the Silk Road bust. This amount might not seem as much compared to the daily volume. Although we think this action's timing is also crucial and something that many people seem to underestimate; illiquid markets require less “firepower” to move the price (it applies to both directions).
In addition to that, high-interest rates finally start to manifest their impact on the consumer, for whom it is harder to service debt and pay for goods with elevated inflation. As a result, this might put many people in a position where they will have to decide whether to pay bills and get food or hold on to the cryptocurrency stash (rising unemployment will also contribute to this).
With these issues and many more, we think it is still premature to call the winning shots. Because of that, we will now focus on the area between the psychological level of 30 000$ and 32 951$ (which acted as support in early May 2022). To abandon our thesis about the bottom not being in, we would like to see Bitcoin consolidate in this area like it did around 28 000$ (just over the past two weeks). Furthermore, we would like to see a continuous build-up in volume accompanying higher prices. Then, we would also want to see a breakout above the zone, which would greatly diminish the odds of our thesis about Bitcoin retesting its 2022 lows. To support our bearish thesis, we would like to see Bitcoin struggling to hold above 30 000$ and a lack of volume in the market.
Illustration 1.01
Illustration 1.01 displays the 1-minute chart of BTCUSD. The yellow arrow indicates the first anomaly. We previously said that similar moves often kept accompanying the price to new highs, especially during the weekend or shortly after the futures market close (in generally illiquid markets).
Illustration 1.02
Illustration 1.02 shows the 1-minute chart of BTCUSD. The second anomaly occurred right after the futures market opened, where Bitcoin jumped by 500$ within the first three minutes of trading.
Technical analysis
Daily time frame = Bullish
Weekly time frame = Bullish
Illustration 1.03
The picture above shows the daily chart of BTCUSD. The yellow rectangle shows the critical zone between 30 000$ and 32 951$.
Please feel free to express your ideas and thoughts in the comment section.
DISCLAIMER: This analysis is not intended to encourage any buying or selling of any particular securities. Furthermore, it should not be a basis for taking any trade action by an individual investor. Therefore, your own due diligence is highly advised before entering a trade.

Ethereum shows some signs of exhaustionSince the summer of 2022, we have maintained a bearish stance on Ethereum, with price targets at $1000 and $900. Furthermore, throughout several months, we have repeatedly stated that the attractive area for short (re)entry is between $1500 and $1600, while the area near $1200 is associated with higher risk. Today, we continue to hold that notion. Despite bullish developments on multiple time frames, we disagree with calls for the primary trend reversal. That is because market sentiment and the rally's nature do not reflect a healthy recovery. Contrarily, the rally seems to be driven by emotions. In addition to that, the reality is that the FED is set to continue tightening, which will cause more problems in the stock market. Because of the high correlation between the stock and cryptocurrency markets, we expect this to weigh on the price of ETHUSD. Furthermore, we anticipate more problems on the institutional side of the market, threatening the overall market’s health. As a result, we have no reason to change our bias.
Illustration 1.01
Illustration 1.01 displays the daily chart of ETHUSD and sloping support. To support a bearish thesis, we want to see the price fail to break above Resistance 1. Otherwise, a breakout will suggest a short-term continuation of the rally.
Illustration 1.02
Illustration 1.02 shows a bullish build-up in volume that led ETHUSD to recent highs. However, near elevated price tags, volume can be seen dropping significantly. Therefore, we are very cautious.
Technical analysis
Daily time frame = Bullish
Weekly time frame = Slightly bullish
Please feel free to express your ideas and thoughts in the comment section.
DISCLAIMER: This analysis is not intended to encourage any buying or selling of any particular securities. Furthermore, it should not be a basis for taking any trade action by an individual investor. Therefore, your own due diligence is highly advised before entering a trade.

btc bitcoin to 30k after result hello traders i have an after result have posted the signal bitcoin to 30k so everyone can be on board if you were in this trade let me know comment down below it is not a guess work understanding price action and the mechanics behind it is the key to this . amazing trade few days hold only this is life changing big move on btc after a long accumulation

BITCOIN : Btc/usdt Inverted Cup shape BINANCE:BTCUSDT
Hi , Trader's as per my analysis , inverted Cup shape chart pattern forming Which indicate
Bearish reversal pattern , if this is the case than market could fall to 20k area again
There is significant profit booking at area of 28K buyer's exit there long position's
400m$ long position's exited till now from 28k area , which indicate's powerful reversal
Maximum 30k will be the target for btc .
Market need's to break 30k and candle of 4hr or daily closes above that point with good volume than market can keep it's bullish bias

CELR : INCREASE VIEWCELR is one of the coins at this moment that can be important for the next trend, we will follow to see if it's able to confirm the coming time.
In the last days on altcoins, there is a hard trend to find a building coin. Will clear be the next one? this is exactly what we are going to follow.

Are you ready to hold the bag?Over the past few days, the market situation calmed down a bit, and stocks reacted positively to the rescue of Credit Suisse and regional banks in the United States. We previously noted that a relief in Bitcoin would be closely tied to the rebound in stocks, which continues to be the case. People remain bullish, arguing that the recent aggressive uptick in prices only shows how bullish the market has become. One of the common arguments is that Bitcoin would not rise so steeply (and so fast) if we were in a bear market. However, we want to remind our readers that the enormous magnitude of the move-up does not necessarily mean we are out of the woods.
For example, during one particular correction in 2018, Bitcoin jumped almost 100% within two weeks. Yet, despite that aggressive move (accompanied by euphoria and bullish forecasts), Bitcoin still managed to erase over 73% of its value in the following months. The reality is that bear market rallies are well-known for their deceptive nature, which causes market participants to reassess their views, hook them on, and then surprise them with an abrupt change of direction (leaving them to hold the bags). We expect the current rally to be no different.
Why? Because in the big picture, nothing has changed. The FED is still poised to increase interest rates next week, further pressuring the (already) weak economy. As a result, we anticipate investors to sober up once they find out there is still no pivot on the table and more signs of recession appear. In turn, we expect this to weigh heavily on the stock market, which stays highly correlated to Bitcoin, dragging it down with it.
Illustration 1.01
Illustration 1.01 shows the correction of the downtrend in 2018 when Bitcoin rose nearly 100% within two weeks. Despite this enormous move, Bitcoin did not cease the bear market and ended up erasing over 73% of its value in the next 298 days.
Technical analysis
Daily time frame = Bullish
Weekly time frame = Neutral/Slightly bullish
Illustration 1.02
Illustration 1.02 displays the daily chart of Bitcoin around 2014/2015. A rally of more than 160% can be observed, taking place only within 19 days. Again, despite this abrupt move up, Bitcoin declined more than 84% over the course of the following year.
Illustration 1.03
The picture above shows the daily chart of Bitcoin. The yellow arrow hints at declining volume, which is highly worrisome.
Please feel free to express your ideas and thoughts in the comment section.
DISCLAIMER: This analysis is not intended to encourage any buying or selling of any particular securities. Furthermore, it should not be a basis for taking any trade action by an individual investor. Therefore, your own due diligence is highly advised before entering a trade.

Buy the dip? Last week brought Silicon Valley Bank's (SVB) collapse, accompanied by a spike in VIX and a selloff in stocks and cryptocurrencies. As if it was not enough, unemployment in the United States rose by 0.2%, flashing a strong recession signal. Subsequently, Bitcoin dropped below $20 000 before rebounding back above $22 000 over the weekend (amid the FED’s handling of the SVB). These developments prompted many people to buy the dip and tell you to do the same, hoping everything was alright and Bitcoin would continue to new highs above $25 000.
However, we are not nearly as optimistic as other market participants. In fact, we think the rebound in Bitcoin will be temporary and tied closely to the relief in stocks. Considering the recent data on the U.S. economy, we think serious trouble mounts for the U.S. economy, which will inadvertently affect Bitcoin in a negative way. Therefore, we raise a word of caution against “overly bullish” calls that ignore ominous developments in the market (more rate hikes, rising unemployment, housing crisis, etc.). With that said, we stick to our previous calls and remain bearish on Bitcoin. Our price targets stay at $15 000 and $13 000.
Illustration 1.01
Illustration 1.01 displays the daily chart of BTCUSD. It can be observed that Bitcoin rebounded above $21 376 and then also above the sloping support/resistance. We will pay close attention to both of these levels and seek a breakdown that will lead the price back below them; breakouts to the downside can be utilized as a trigger for a short position.
Technical analysis
Daily time frame = Neutral
Weekly time frame = Neutral
Illustration 1.02
The picture above portrays the daily chart of BTCUSD and two simple moving averages. Interestingly, the rebound coincides with the price’s retracement toward these SMAs. Such behavior often represents corrections, and therefore, we will pay close attention to whether the price will manage to hold above these indicators. If it doesn’t hold, it will be bearish.
Illustration 1.03
Illustration 1.03 shows the 1-minute chart of BTCUSD. It can be seen that rebound occurred very fast, and the price jumped up steeply in very quick time intervals. We outlined similar behavior in the past few months, when Bitcoin moved to new highs on weekends or when the futures market was closed (and when the volume was low, making Bitcoin more prone to price manipulation). In our opinion, this is not a healthy sign.
Please feel free to express your ideas and thoughts in the comment section.
DISCLAIMER: This analysis is not intended to encourage any buying or selling of any particular securities. Furthermore, it should not be a basis for taking any trade action by an individual investor. Therefore, your own due diligence is highly advised before entering a trade.

The faith of Bitcoin bulls is being put to the testFinally, Bitcoin showed strong signs of weakness, following our speculation that it might have topped (outlined in the article from 24th February 2023). Overnight, BTCUSD dropped to $22 000 before erasing some losses. The bearish crossover between DM+ and DM- accompanied the move, which we wanted to see in order to confirm our thesis about the bear market rally. However, despite these bearish developments, we have to reiterate that the confirmation of the short-term trend reversal has not yet been confirmed. Because of that, we remain very cautious and monitor the price action closely. If the price breaks and holds below the “Sloping support,” it will be very bearish; the same applies to the “Support 1”. However, if the price holds above the “Sloping support,” it may suggest that the price will stay in the upward-sloping channel for much longer before the final breakdown. As the majority of developments throughout the recent rally are characteristic of a bear market rally rather than a genuine primary trend reversal, we have no reason to change our bearish outlook beyond the short term. Accordingly, we stick to our view that BTCUSD will revisit its 2022 lows in the current year.
Illustration 1.01
Illustration 1.01 shows the daily chart of BTCUSD. Yellow arrows indicate volume, which suggests that fewer people were willing to buy Bitcoin in the second leg up than in the first one. Moving averages are flattening, which usually accompanies a neutral trend.
Technical analysis
Daily time frame = Bearish
Weekly time frame = Neutral
Illustration 1.02
The picture above shows the daily chart of BTCUSD. The orange line represents Nasdaq 100 continuous futures (NQ1!). Below this depiction is the correlation coefficient between BTCUSD and NQ1! (using a length of 50 days in the calculation).
*Pine script code used to generate the correlation coefficient*
//@version=4
study("BTCUSD/NQ1! Correlation Coefficient")
// Define the symbols for the two assets to be tested
symbol1 = input("BTCUSD", type=input.symbol)
symbol2 = input("NQ1!", type=input.symbol)
// Get the historical data for the two assets
asset1 = security(symbol1, timeframe.period, close)
asset2 = security(symbol2, timeframe.period, close)
// Calculate the correlation coefficient between the two assets
correlation = correlation(asset1, asset2, length=50)
// Plot the correlation coefficient on the chart
plot(correlation, title="Correlation", color=color.blue)
Please feel free to express your ideas and thoughts in the comment section.
DISCLAIMER: This analysis is not intended to encourage any buying or selling of any particular securities. Furthermore, it should not be a basis for taking any trade action by an individual investor. Therefore, your own due diligence is highly advised before entering a trade.
