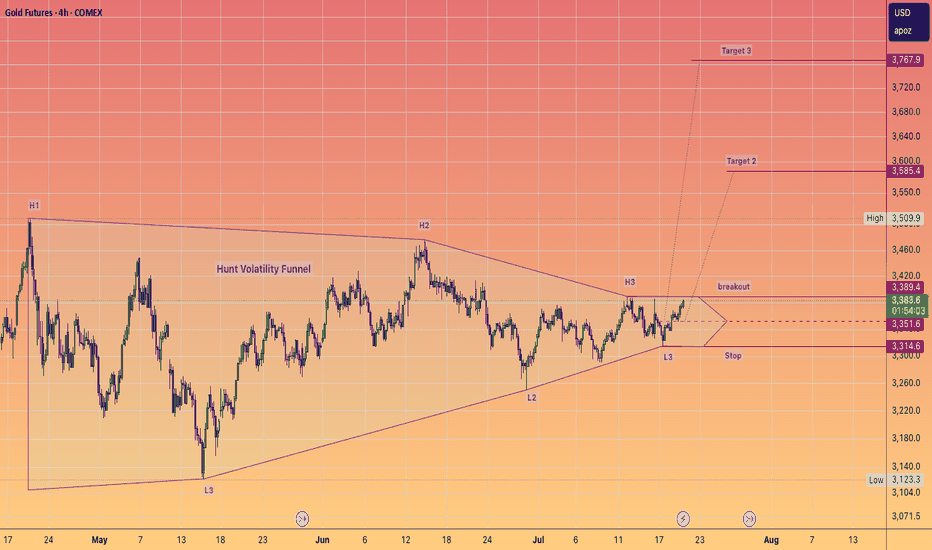
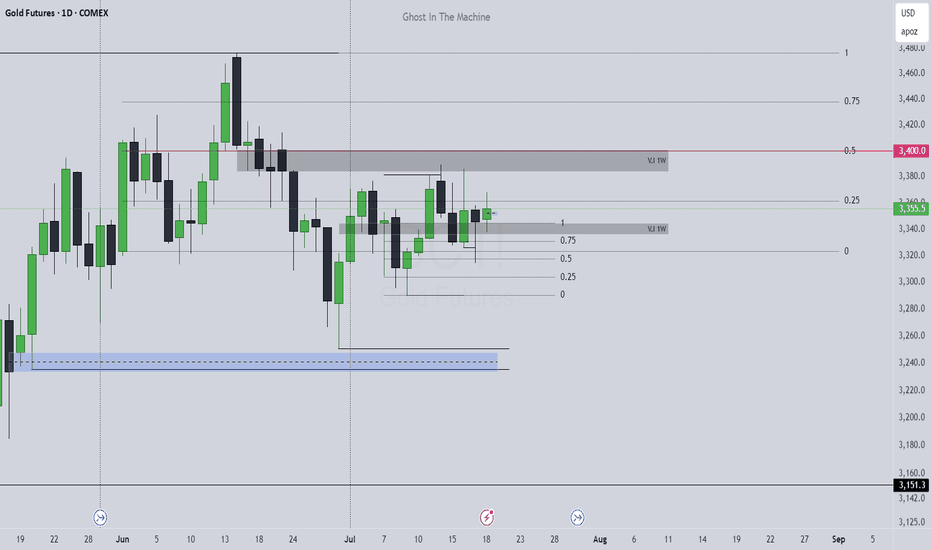
Comex
Gold Breaks All-Time-High !Gold surged above $2286 per ounce, marking yet another milestone in its remarkable ascent. This surge has persisted for two consecutive trading days, underscoring the enduring strength of the precious metal.
The driving force behind this meteoric rise is the mounting anticipation of an imminent interest rate cut by the US Federal Reserve in June. Such a move is expected to exert downward pressure on the US Dollar, consequently fueling further gains in Gold prices. Year-to-date, Gold has surged by an impressive 9.8%, with March alone witnessing a staggering increase of nearly 9.4%.
A closer examination from a technical standpoint reveals a bullish breakout from an ascending triangle formation, marked (in blue) which has been taking shape since early 2020. This breakout signals a robust indication of sustained bullish momentum in Gold prices over the long term. For traders, this presents a lucrative opportunity to capitalize on the prevailing bullish bias both in the intermediate and short term.
Going along the phrase of "The trend is your friend", a simple trade below may capture any retracement opportunities along this steep surge.
Entry: 2218
TP: 2320 (can be partial TP or pull up trail stop)
SL: 2149
Copper Futures to target 5.05 after crossing 3.85COMEX
On the weekly chart, a technical pattern has formed and the crossing confirmation above 3.85 will push the price up to 5.05 passing through several levels of resistance - shown on the chart.
Trading above 5.05 for more than a month, the long term target will be 5.6
Stop loss should be considered - 3.75
Gold up from here! Its gonna be the big oneYou can see very clearly why gold will break into its mew price territory. I used my own method of triangulation that has proven to be fairly accurate up to most of the time. I think that gold will become very expensive and soon become 5000 dollars but not before it bounces off of 3000 first then back up to test ath. 5000 next move take pay. Wave 2 8500 expected march 2023. Like and follow
Copper: Jump off! 👟The copper price has reached the lower edge of the pink trend channel within the turquoise target zone between $3.59 and $3.51 and has already shown a reaction to this line. Now, a far-reaching rise should occur, beyond the resistance at $4.19. There, the magenta wave (B) should then be finished and it should transition into sustained descents to the green target zone between $3.08 and $2.59.
Copper: A little further 🤏The price of copper is now falling further and further after initially rising on Thursday. This development is in line with our primary scenario as we expect the low of the magenta wave (x) to be a bit lower in the turquoise target zone between $3.59 and $3.51. Only when it's placed, the price can rise above the resistance at $4.19 and build wave (B) in magenta. A drop to the green target zone between $3.08 and $2.59 should follow from this point.
Gold at a Crossroad as Fed Tightening Near EndCOMEX: Micro Gold Futures ( COMEX_MINI:MGC1! ), Micro Silver Futures ( COMEX_MINI:SIL1! )
Is gold an inflation hedge, a risk protection, a precious metal commodity, or a speculative investment? I think it is all of the above. Sometimes it could be one of them, but quite often gold puts on multiple hats, as its price could be driven by competing forces.
Gold as an Inflation Hedge
Gold has historically been an excellent hedge against inflation because its price tends to rise when the cost-of-living increases. This is supported by actual data.
The US CPI Index has a base value of 100 set at years 1982-1984. Its latest reading in June 2023 is 305.1. Over the last 40 years, the average price of goods and services has tripled in the US. In other words, the purchasing power of US dollar has lost 2/3 of its value.
The year-end price of spot gold in 1982-1984 stood at $447, $380, and $308, respectively. Let’s use $378, the average of the three, as a base value for comparison. On July 28th, the bullion rose to $1,956 per ounce. This is a gain of 417% in the past four decades. Over the long run, investing in gold does help preserve your wealth.
Gold reached its all-time high of $2,075 in August 2020. Since then, CPI index gained 17.4% (from 259.9 to 305.1). But gold price retreated 5.7% from its record. It appears that hedging with gold does not work now. Maybe gold is wearing other hats?
Gold as a Precious Metal
As a commodity, gold is negatively correlated to the US dollar. Since gold is priced in dollar, a strong dollar raises the cost for foreign investors who must pay more with weakened foreign currency. This reduces the demand for gold. “Strong Dollar, Weak Commodities” is the general theme in global commodities market, gold included.
A closely related theme is “Higher Rates, Lower Prices”. Higher interest rates and Treasury bond yields raise the opportunity cost of holding non-yielding gold.
Unlike other commodities, gold is not consumed or used up every year. Therefore, gold mining output is not a major factor in the pricing of gold.
The 1-year chart below illustrates the inverse relationship between gold and the dollar index. However, correlation does not imply causation. As a matter of fact, both gold prices and the dollar index are strongly impacted by the Fed rate hikes, as shown in the chart.
Gold as a Safe Haven Investment
Gold retains its value in times of both financial chaos and geopolitical crises. People flee to its relative safety when world tensions rise. During such times, gold often outperforms other investments. In the past two decades, gold price peaked during:
• The 2008 financial crisis
• The 2010 European debt crisis
• The 2018-19 US-China trade conflict
• The outbreak of COVID pandemic
• The Russia-Ukraine conflict
• The March 2023 bank run
Gold as an Investment Class
Gold investment includes physical gold, gold ETF funds, gold futures, gold options, and gold-mining company stocks. As an investment class, gold competes for investor money along with stocks, bonds, cryptos and money-market funds.
Gold gained 8.3% year-to-date, significantly underperforming the S&P (+19.8%), the Nasdaq (+44.8%) and Bitcoin (+77.8%). Investors chased higher returns and moved money out of gold. Asset rotation certainly put price pressure on gold.
Outlook for Gold Price Drivers
Gold wears many hats and it’s the market narrative and sentiment help define its price move. Instead of putting out a bullish or bearish view on gold, I prefer to comment on the key factors affecting gold prices.
Here is my take:
1. Fed interest rate decisions
• Impact: Positive
• The Fed is likely near the end of its year-long rate hikes. CME FedWatch currently puts 80% odds on the Fed keeping rates unchanged in September;
• While interest rates remain high, the change of rate trajectory is positive for gold.
2. US inflation rates
• Impact: Mixed
• CPI comes down from 9.1% to 3.0% in a year. This is a main factor supporting the Fed to pause or stop rate hikes;
• Meanwhile, lower inflation risk reduces the demand for inflation hedge investment.
3. US unemployment
• Impact: Positive
• Nonfarm payrolls remain strong. Unemployment rate stays below 4%;
• The Fed may consider one more rate hike to cool the economy.
4. US GDP
• Impact: Negative
• The Bureau of Economic Analysis reports that US GDP grew at a 2.4% annual rate in the second quarter, speeding up from 2.0% in the first quarter;
• The probability of a US recession is much lower than previously expected. This give the Fed more room to combat inflation without breaking the economy.
5. US stock market
• Impact: Negative
• Strong stock market reduces the attractiveness in investing in gold.
6. Russia-Ukraine Conflict
• Impact: Prolonged conflict (neutral); Escalated tension (positive); Peace (negative)
• Geopolitical crisis is the biggest driver for gold price.
What’s the “Right” Price for Gold
Is the current gold price too rich? very cheap? or just about right? There is probably no right answer to this question.
To measure gold’s relative value, I rely on gold/silver ratio. Gold is mainly an investment instrument, while silver has a dual use of both investment and industrial material. Plugging in $1,998/ounce for gold and $24.475/ounce for silver, we get the ratio of 81.63.
In a 5-year timeline, we observe that the ratio has been as high as 120 and as low as 63. Current ratio places gold at the lower part of the relative value range. (See title chart)
For someone who is bullish on the gold/silver ratio, in other words, expecting the ratio to increase, he could set up a spread trade with long gold futures and short silver futures.
COMEX Micro Gold Futures (MGC) contract has a notional value of 10 ounces of gold. At $1,998, each is worth $19,980. One contract requires initial margin of $830.
Micro Silver Futures (SIL) contract is notional on 1,000 ounces of silver. At $24.475, each is worth $24,475. One contract requires initial margin of $1,700.
Regardless which direction gold price goes, the spread trade will make money if the gold/silver ratio expands and lose money if the ratio narrows. Trading in futures comes with a leverage that would supercharge the gain if you were on the right direction.
Happy Trading.
Disclaimers
*Trade ideas cited above are for illustration only, as an integral part of a case study to demonstrate the fundamental concepts in risk management under the market scenarios being discussed. They shall not be construed as investment recommendations or advice. Nor are they used to promote any specific products, or services.
CME Real-time Market Data help identify trading set-ups and express my market views. If you have futures in your trading portfolio, you can check out on CME Group data plans available that suit your trading needs www.tradingview.com
NZDUSD falling here we have a 2 scenario where in
1st one we are expecting nzdusd to fall from the current market price with 70 pips target
and in 2nnd one we are expecting nzdusd to go up like 30 pips and fall 100 pips down with this pattern we'll wait for this candle if it bullish we can wait for our point after 30 pips up
Short position - Silver futures (COMEX)Our semi-systematic programme, consisting of different trend-following models that we apply manually, is opening short positions in some futures contracts, including COMEX silver futures.
This position could also be executed via A-book CFDs or correlated ETPs.
Positions
1st sell stop: 20.515
1st guaranteed trailing stop loss: 21.370
Take profit: 18
2nd sell stop: 19.700
2nd guaranteed trailing stop loss: 20.515
Take profit: 18
Risk & portfolio management
Portfolio risk 1st position: 0.5%
Portfolio risk 2nd position: 0.3%
Portfolio exposure: 3%
Financial engineering
COMEX Futures
Trading model
TTW
Execution
Manual, semi-systematic.
The big silver move into 2023Lots of interest in silver again with just a few weeks left of 2022.
some interesting news about India's demand and COMEX, go check it out.
pull back to support S1 or S2 (extreme), then upwards to break yearly highs and possibly more!
watch the news, that's when u will look to sell x
merry xmas and happy new year