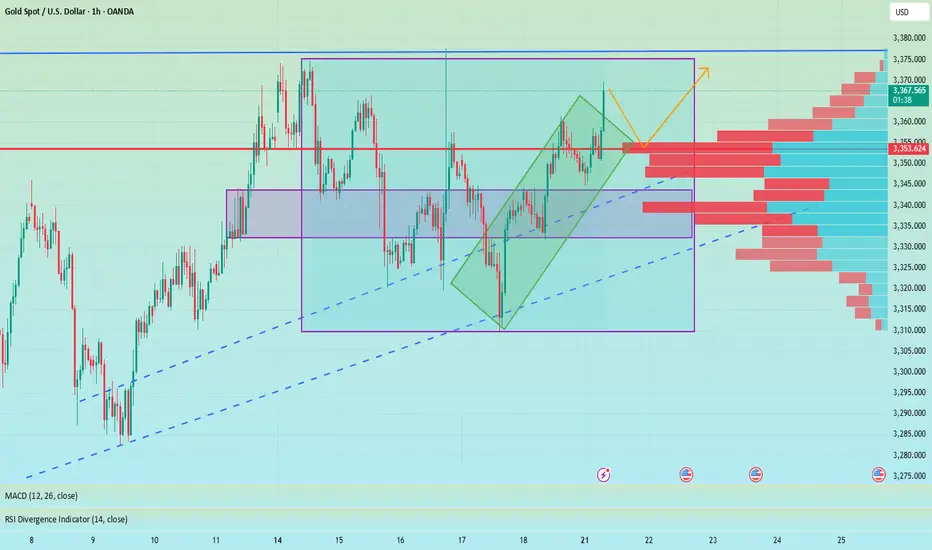
XAUUSD Analysis – Smart Money Perspective XAUUSD Analysis – Smart Money Perspective
🧠 Market Structure & BOS (Break of Structure):
The chart clearly shows multiple Break of Structure (BOS), confirming bullish intent.
After the final BOS around 3,370, price aggressively broke above resistance, forming a new high at 3,397.
This indicates bullish market momentum backed by strong demand.
🔎 Key Zones Identified:
🔼 Strong Resistance (3,390 – 3,400 Zone)
This level has been tested and now shows potential exhaustion, possibly trapping late buyers.
Price currently rejecting this zone with a bearish reaction.
🔽 Support Zone (3,300 – 3,320)
Prior consolidation and BOS originate from here.
Strong bullish OB and demand lie here—key area for future long setups.
📉 Expected Short-Term Move:
The projection arrow indicates a potential retracement toward 3,360, a previous BOS + potential FVG area.
This aligns with Smart Money's tendency to rebalance inefficiencies before continuation.
🔺 Volume Analysis (VRVP - Volume Profile):
Notice how high volume nodes align with the support and resistance zones.
Price is currently sitting in a low-volume gap, supporting the idea of a retracement to a more balanced area.
⚡ Momentum Shift Signal:
The steep angle of the last move up suggests possible liquidity grab above resistance.
Expectation: Price may dip to mitigate demand or OB before resuming the uptrend.
✅ Conclusion:
This chart illustrates a textbook SMC scenario:
Bullish BOS confirms structure shift.
Liquidity sweep above resistance may lead to a retracement.
3,360 is a key price point to watch for FVG fills or bullish continuation.
Commodities

GOLD → Breakthrough accumulation. Correction before growthFX:XAUUSD has been strengthening since the session opened and is heading towards the 3374 zone of interest. The price has previously broken through the consolidation resistance and may test this boundary before moving further.
Gold is rising amid trade risks and dollar weakness. After falling to $3310, gold resumed its growth, seeking to break through the $3368 level. Support for prices was provided by uncertainty surrounding Trump's tariff policy and expectations for Fed Chairman Powell's speech. The US dollar weakened temporarily as investors sought refuge in gold amid trade disputes with the EU, political instability in Japan, and criticism of the Fed from the White House.
Technically, the price is in a realization phase after breaking out of consolidation, but it has encountered resistance at 3368, which could lead to a correction. The focus is on the 3350-3355 zone. If the bulls hold their ground above this zone, the market may return to the realization phase.
Resistance levels: 3368, 3374
Support levels: 3345, 3332
The market is bullish and feels support, especially against the backdrop of a weak dollar. Traders are watching Trump and Powell. If the latter decides to cut rates, for example tomorrow at 12:30 GMT, gold could rally...
Technically, gold could test 3350 before rising.
Best regards, R. Linda!

Banana republic fears, gold tests $3,400Traders now price in a 60% chance of a Fed rate cut in September, as political pressure on the central bank intensifies.
Republican Rep. Anna Paulina Luna has officially accused Fed Chair Powell of perjury, while Treasury Secretary Scott Bessent has called for a full inquiry into the institution.
Earlier this month, former Fed Chair Janet Yellen told The New Yorker that these actions “...are the ones one expects from the head of a banana republic that is about to start printing money to fund fiscal deficits.”
Amid this backdrop, gold surged past $3,390 per ounce. The 1-hour XAU/USD chart shows strong bullish momentum supported by the Ichimoku cloud: price is well above the cloud with a clean breakout and lagging span confirmation. Immediate resistance sits at $3,400, with a potential extension toward $3,440–$3,450 if bullish pressure holds.
Meanwhile, EUR/USD remains in an uptrend on the daily chart, bouncing from pitchfork support. A sustained move above 1.1700 could reopen the path toward 1.1800+.

Natural Gas Crisis: Profits were made!Nat Gas plunged to a 1-week low Monday on the outlook for cooler US temperatures.
A report came out that Nat gas has heat peak demand which is scaring investors.
Nat GAs equities got demolished which could indicate that this breakdown is real.
We got rejected off the daily 50 MA & Knifed through the 200 Daily MA.
Some clear technical breakdowns are now in affect.
We banked on EQT put options that ran over 400%. This trade was called out free on our channel. You tube Short.

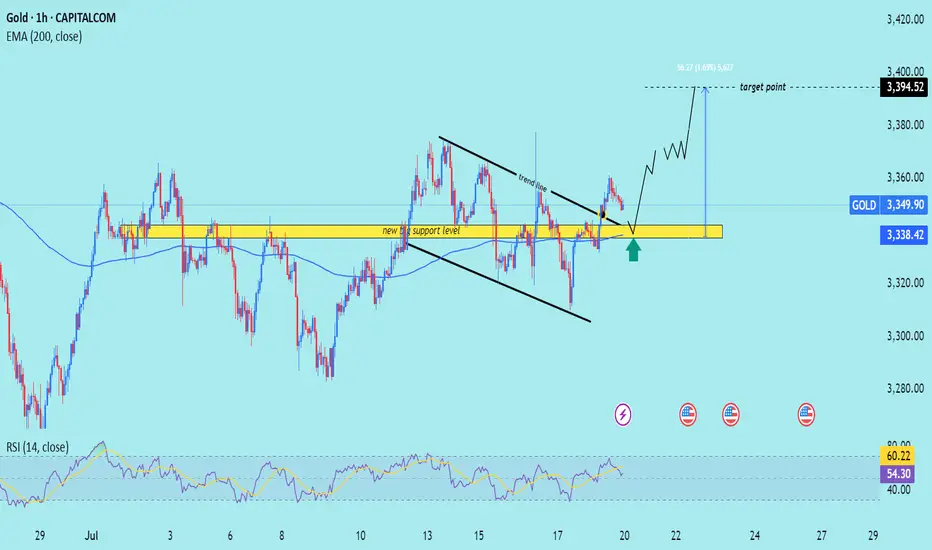
XAU/USD) Bullish trend analysis Read The captionSMC Trading point update
Technical analysis of XAU/USD (Gold) on the 1-hour timeframe. Here’s a breakdown
---
Technical Analysis Summary
Descending Channel Breakout
Price action previously formed a descending wedge/channel, shown by the two black trendlines.
A bullish breakout occurred above the trendline, signaling a shift in momentum from bearish to bullish.
Key Support Zone
The yellow highlighted zone (around $3,338–$3,340) is marked as the “new key support level”.
Price is expected to retest this area (confluence with 200 EMA), which aligns with standard bullish breakout behavior.
The green arrow indicates potential bounce confirmation.
Bullish Projection
After the retest, price is projected to climb steadily toward the target point at $3,394.52.
The setup anticipates around 56.27 points upside, or roughly +1.69% gain from the support zone.
---
Target
$3,394.52 – defined using the previous range breakout height and horizontal resistance.
---
Trade Idea
Entry: On bullish confirmation near $3,338 support zone.
Stop Loss: Just below the yellow zone (e.g., under $3,330).
Take Profit: Near $3,394.
Mr SMC Trading point
---
Conclusion
This is a classic breakout-retest-play, supported by trendline structure, a key horizontal support zone, and RSI strength. As long as price respects the highlighted support, the bullish outlook remains valid.
Please support boost 🚀 this analysis)
Accurate prediction, continue to buy after retracement to 3353📰 News information:
1. The Trump administration puts pressure on the Federal Reserve to cut interest rates
2. The continued impact of tariffs and the responses of various countries
📈 Technical Analysis:
Gold is currently rising rapidly, reaching a high near 3368, and the overall bullish trend has not changed yet. It is not recommended to continue chasing the highs at present. Those who are long at 3345 can consider exiting the market with profits. The technical indicators are close to the overbought area and there is a certain risk of a correction. Be patient and wait for the pullback to provide an opportunity. At the same time, 3353 has become the position with relatively large trading volume at present, and the top and bottom conversion in the short term provides certain support for gold longs. If it retreats to 3355-3345, you can consider going long again, with the target at 3375-3385. If it falls below 3345, look to 3333, a second trading opportunity within the day. If it falls below again, it means that the market has changed, and you can no longer easily chase long positions.
🎯 Trading Points:
BUY 3355-3345
TP 3375-3385
In addition to investment, life also includes poetry, distant places, and Allen. Facing the market is actually facing yourself, correcting your shortcomings, facing your mistakes, and exercising strict self-discipline. I share free trading strategies and analysis ideas every day for reference by brothers. I hope my analysis can help you.
FXOPEN:XAUUSD OANDA:XAUUSD FX:XAUUSD FOREXCOM:XAUUSD PEPPERSTONE:XAUUSD TVC:GOLD
XAUUSD 15m trade possibilitty 7/21/25This is what I'm looking at for the short term after the recent rally.
I'm targeting the green area for buys because that was the last consolidation and breakout zone.

XAUUSD 4H Golden Cross preparing a massive break-out.Gold (XAUUSD) has been trading on a 3-week Channel Up, which is approaching its top but at the same time, it's been trading within a 3-month Triangle, which is also approaching its top.
The key here is the formation today of a Golden Cross on the 4H time-frame, the first since May 28. Being at the end of the long-term Triangle pattern is technically translated to the structure's tendency to look for a decisive break-out above its top that attracts volume (buyers).
It is possible to see an initial rejection followed by a break-out that will re-test the top of the Triangle as Support and then follow the long-term trend dynamics. Those are technically bullish and previous break-out in April targeted the 2.618 Fibonacci extension. Our Target remains a little below it at $3770.
-------------------------------------------------------------------------------
** Please LIKE 👍, FOLLOW ✅, SHARE 🙌 and COMMENT ✍ if you enjoy this idea! Also share your ideas and charts in the comments section below! This is best way to keep it relevant, support us, keep the content here free and allow the idea to reach as many people as possible. **
-------------------------------------------------------------------------------
Disclosure: I am part of Trade Nation's Influencer program and receive a monthly fee for using their TradingView charts in my analysis.
💸💸💸💸💸💸
👇 👇 👇 👇 👇 👇

Barrick Gold Corp (B) – Riding the Gold SupercycleCompany Snapshot:
Barrick $B is a global gold and copper mining powerhouse, poised to thrive amid soaring gold prices and escalating macroeconomic uncertainty.
Key Catalysts:
Gold Bull Run Tailwind 📊
Spot gold is surging, with projections aiming for $2,700/oz. As a low-cost, large-scale producer, Barrick stands to gain significantly from margin expansion and free cash flow acceleration.
Global Diversification 🌍
Operations across North America, Africa, and Asia offer geographic balance—mitigating regional risk while ensuring strong production continuity.
Insider Confidence + Lean Costs 🔒
CEO Mark Bristow and other execs are actively buying shares, signaling deep conviction.
With industry-low all-in sustaining costs (AISC), Barrick boasts high operational leverage to gold’s upside, especially in an inflationary environment.
Investment Outlook:
Bullish Entry Zone: Above $18.00–$19.00
Upside Target: $28.00–$29.00, fueled by macro gold strength, disciplined execution, and insider alignment.
⛏️ Barrick is a prime gold cycle play, combining operational excellence with strategic global scale.
#BarrickGold #GoldStocks #GoldPrice #Commodities #InflationHedge #MiningStocks #InsiderBuying #AISC #PreciousMetals #MacroTailwinds #B

Crude oil------sell near 68.80, target 66.00-62.00Crude oil market analysis:
Recent crude oil is actually very easy to operate. Sell when it rebounds to a high position. Don't worry about the position. In addition, the daily K-line has also begun to decline, and it is difficult to form a large rebound. The new daily moving average begins to sort. If there is no fundamental support in the future, crude oil has a lot of room to fall, and it will fall below 58 in the future. Sell it when it rebounds to around 68.80 today.
Fundamental analysis:
Today is a holiday in Tokyo, Japan. In addition, there is no major data this week. We focus on the fundamentals. Trump's tariffs are still a focus.
Operational suggestions:
Crude oil------sell near 68.80, target 66.00-62.00

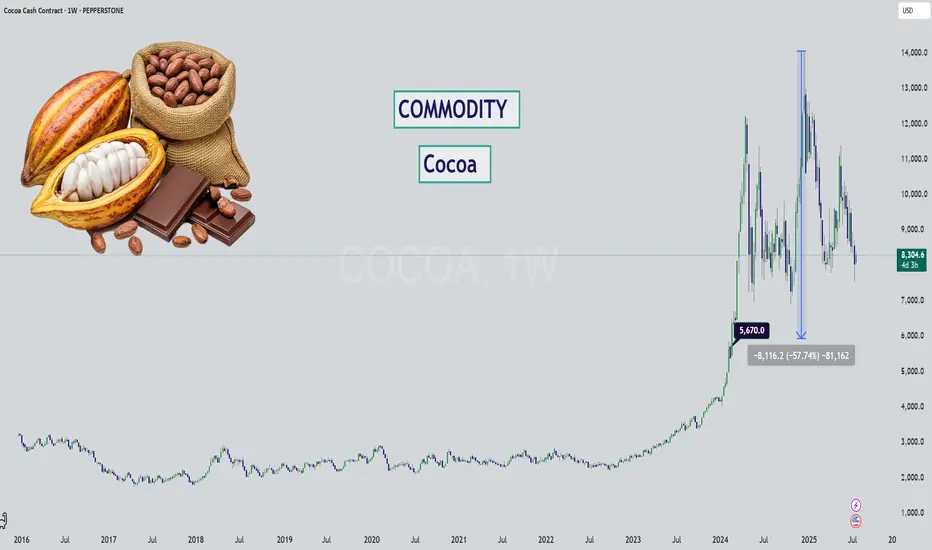
Cocoa - Chocolate is DIPPING (literally)Hello Market Watchers 👀
I bring today an update on your favorite commodity (mine actually)... 🍫
The weekly timeframe from a multi-year perspective is what's on the cover and one thing is clear - cocoa has never increased so much as it during May23' to Dec24'.
Sure inflation brought on by covid has a role to play. But even so, factoring in the amount of +509%? That is way out.
We could likely see this kind of stair step down movement on cocoa, since it has been following the logic of: " previous support = new resistance ".
Either way what this tells me is that cocoa has been running overly hot for too long... and it's time for a cooldown. Prices will likely never return to pre-covid levels, unless there is unfortunate weather or other supply chain issues.
Ultimately, a return back to the $5,600 zone would be a reasonable market correction for such a large increase.
XAU/USD Start July 20251. i start after XAU/USD break previous High and correction (fibbo 32.0) respected. based on elliot wave strategy we can targeting end of wave 3 at 3353 area and than correction wave 4 (target at fibbo 32.0 - 50.0). after target correction, continue wave 5 at target 3403 area.
2. fundamentally speaking, new months new quarter. there ins't new catalist and sentiment. Macro Economic this week focus on labour market at US and FED projection to cut rate.
3. War at Iran and Israel, Russia and Ukraine, India and Pakistan, Trade War case, etc,.
4. Will be update

GOLD - Price can rise to resistance line of wedgeHi guys, this is my overview for XAUUSD, feel free to check it and write your feedback in comments👊
The price has been trading within a large ascending wedge for an extended period.
The asset found significant support near the lower trendline of this formation, specifically in the 3205 - 3187 price area.
From that support, the price initiated a sustained upward movement back towards the upper parts of the structure.
Currently, XAU is facing a key horizontal resistance zone located between 3375 and 3390 points.
The price is actively attempting to break through this area, which has historically served as a critical pivot point.
I expect that once the price firmly breaks and consolidates above this resistance, it will continue its growth towards the upper boundary of the wedge, targeting the $3475 level.
If this post is useful to you, you can support me with like/boost and advice in comments❤️
Disclaimer: As part of ThinkMarkets’ Influencer Program, I am sponsored to share and publish their charts in my analysis.

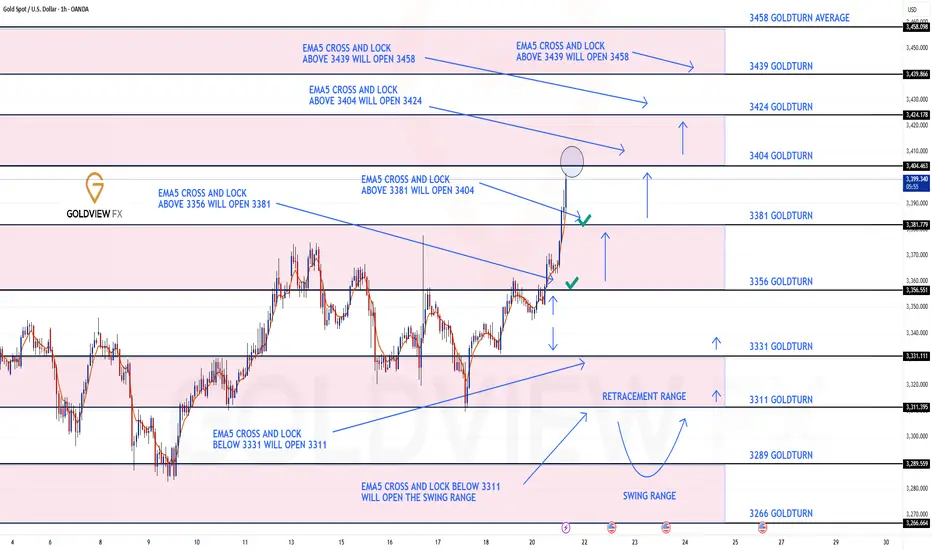
GOLD ROUTE MAP UPDATEHey Everyone,
Great start to the week with our chart idea playing out, as analysed.
We started with our Bullish target 3356 hit, followed with ema5 cross and lock above 3356 opening 3381. This was also hit perfectly completing this target. We now have a further ema5 cross and lock above 3381 leaving 3404 open with already a nice push up, just short of the full gap.
We will keep the above in mind when taking buys from dips. Our updated levels and weighted levels will allow us to track the movement down and then catch bounces up.
We will continue to buy dips using our support levels taking 20 to 40 pips. As stated before each of our level structures give 20 to 40 pip bounces, which is enough for a nice entry and exit. If you back test the levels we shared every week for the past 24 months, you can see how effectively they were used to trade with or against short/mid term swings and trends.
The swing range give bigger bounces then our weighted levels that's the difference between weighted levels and swing ranges.
BULLISH TARGET
3356 - DONE
EMA5 CROSS AND LOCK ABOVE 3356 WILL OPEN THE FOLLOWING BULLISH TARGETS
3381 - DONE
EMA5 CROSS AND LOCK ABOVE 3381 WILL OPEN THE FOLLOWING BULLISH TARGET
3404
EMA5 CROSS AND LOCK ABOVE 3404 WILL OPEN THE FOLLOWING BULLISH TARGET
3424
EMA5 CROSS AND LOCK ABOVE 3424 WILL OPEN THE FOLLOWING BULLISH TARGET
3458
BEARISH TARGETS
3331
EMA5 CROSS AND LOCK BELOW 3331 WILL OPEN THE FOLLOWING BEARISH TARGET
3311
EMA5 CROSS AND LOCK BELOW 3311 WILL OPEN THE SWING RANGE
3289
3266
As always, we will keep you all updated with regular updates throughout the week and how we manage the active ideas and setups. Thank you all for your likes, comments and follows, we really appreciate it!
Mr Gold
GoldViewFX
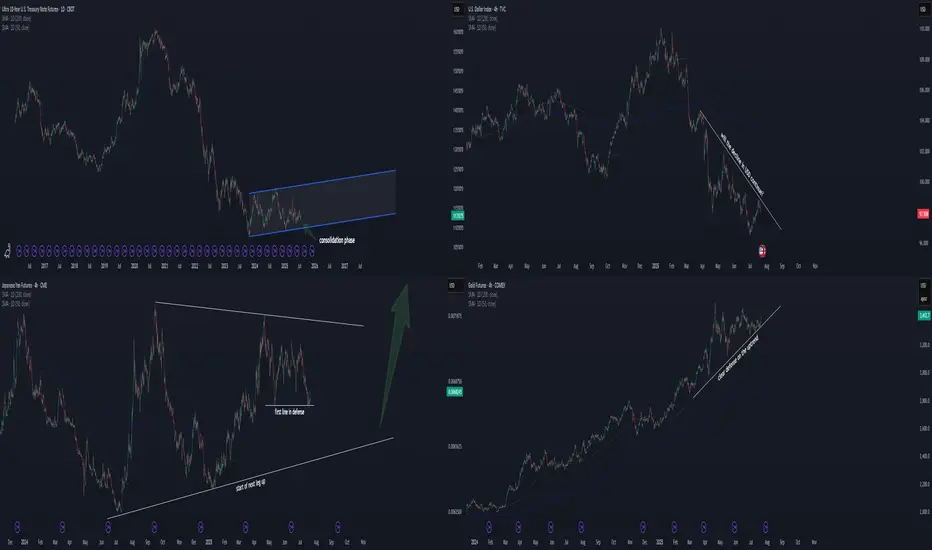
Time to invest in JPY and TN/bond? Hello FX/futures traders!
Market is at a pivotal point. Not in a bad way, but in a good way!
Chart 2: TVC:DXY
Let's start with the US Dollar . A declining USD was just well defended the last few days. If this is true, then the stock up, dollar down scenario is likely to continue. This is good for equities.
Chart 4: COMEX:GC1!
Gold defends its trendline as well. It seems like gold wants to go up more. A raising gold in the current scenario suggests declining USD TVC:DXY . This isn't always true, but we have to look at the current correlation and makes the best educated guess on this.
Logical Deduction 1:
Chart 1: CBOT:TN1!
A consolidation phase has been going on for almost 2 years now. This is definitely
a good sign to long bond, as at least we know the likely bottom for stoploss. With dollar leaning down and gold up, I think TN will defend its current level around 110-113.
Logical Deduction 2:
Chart 3: CME:6J1!
JPY is defending its first key level since May 2025. A wedge is forming, and the breakout is about to take place later this year. Likely the consolidation phase will take more time (with likelihood to breakout to either side). But with a declining USD side by side, I consider now a good entry point to long JPY with controllable risk.
Let me know what you think!
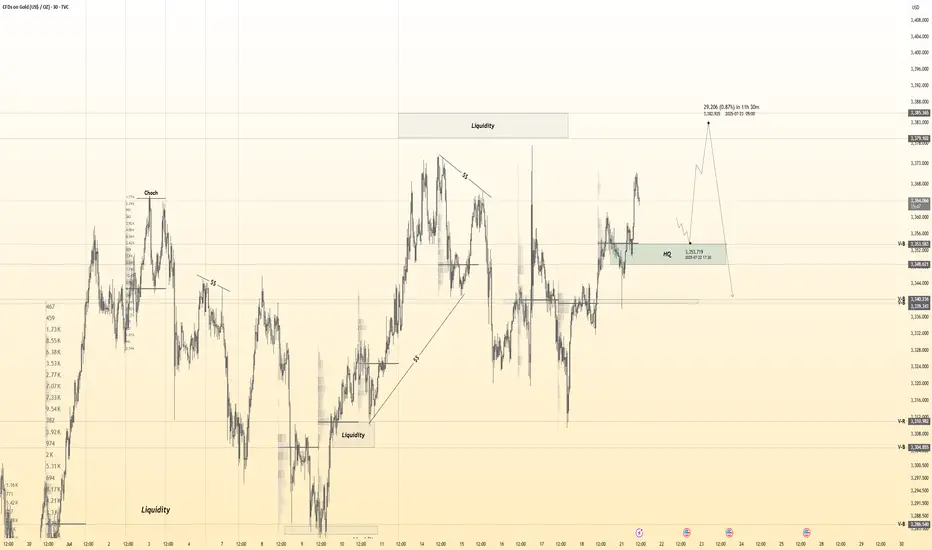
High probability that gold will fallHello,
I hope you're doing well. Here, I'm sharing my analysis of the gold futures market.
Now I see that there's a good chance, about 80%, that it will fall.
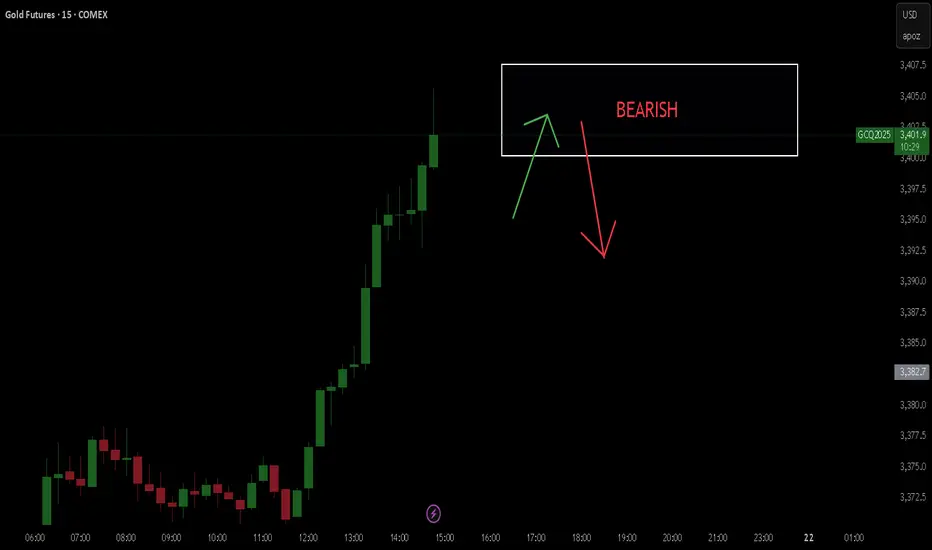
Gold 30Min Engaged ( Bullish & Bearish Reversal Entry's Detected————-
➕ Objective: Precision Volume Execution
Time Frame: 30-Minute Warfare
Entry Protocol: Only after volume-verified breakout
🩸 Bullish reversal : 3354.5
🩸 Bearish Reversal : 3379
➗ Hanzo Protocol: Volume-Tiered Entry Authority
➕ Zone Activated: Dynamic market pressure detected.
The level isn’t just price — it’s a memory of where they moved size.
Volume is rising beneath the surface — not noise, but preparation.
🔥 Tactical Note:
We wait for the energy signature — when volume betrays intention.
The trap gets set. The weak follow. We execute.
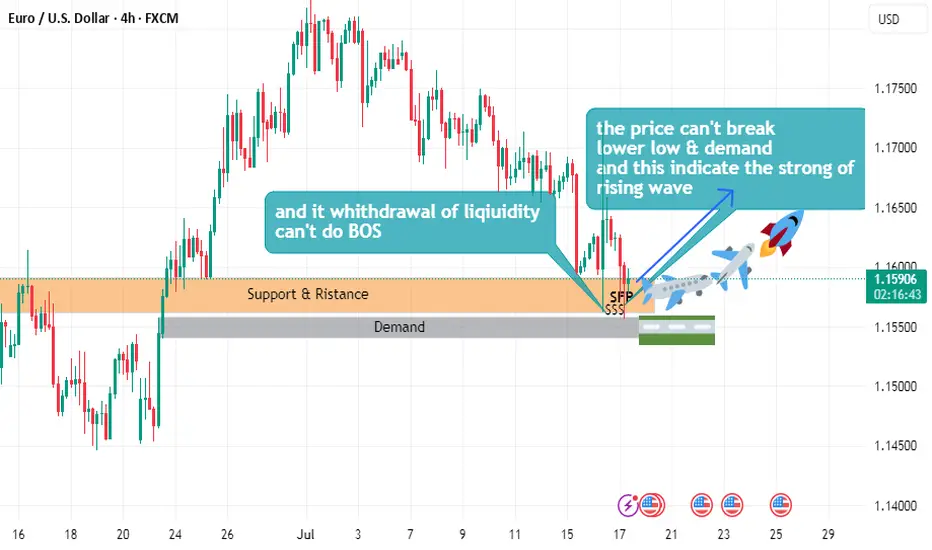
EURUSD buy plane Setuphello
the price can't break lower low
and can't demand
and this indicate the strong of uptrend wave
and it withdrawal of liquidity
and can't do beak of structure
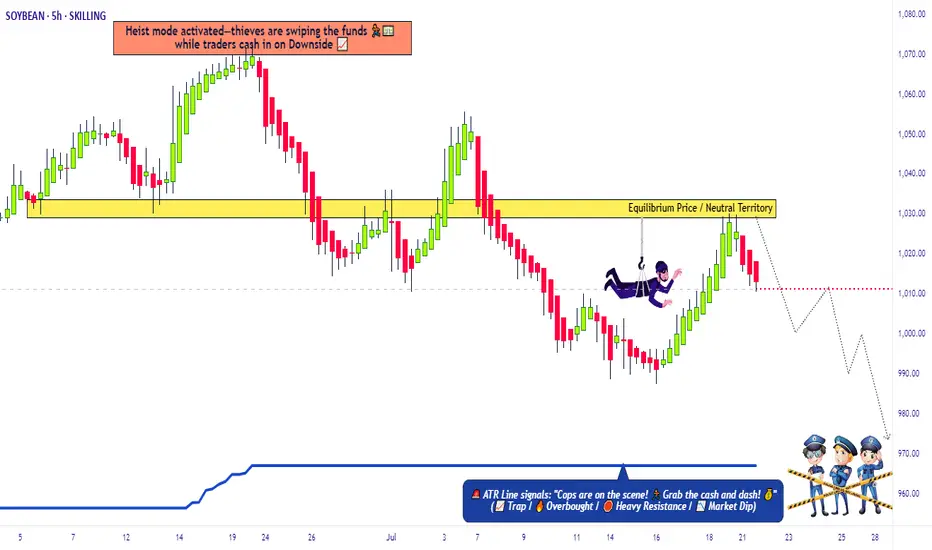
SoyBeans Price Reversal – Time to Swipe Bearish Profits🔓 Operation SoyBeans: Vault Breach Underway! 💼🌾
🌟Hi! Hola! Ola! Bonjour! Hallo! Marhaba!🌟
Calling All Market Bandits, Scalping Buccaneers & Swinging Looters 🕵️♂️💰💣
We've marked our next robbery target—the "SoyBeans" Commodities CFD Market.
This isn’t just a trade, it’s an orchestrated heist built off Thief Trading intelligence: a mix of technical traps, fundamental cues, and criminal market psychology. 🧠💸
🔎 🎯 Entry Point - Where the Safe Cracks Open:
The vault is wide open—grab bearish loot at any price!
But for maximum stealth, layer in buy limit orders on the pullback using the 15m or 30m timeframe near swing highs/lows.
(We thieves call this: DCA under the radar.) 🕳️📉
🛡️ 🚨Stop Loss - Our Escape Hatch:
Set SL at the nearest 4H candle wick swing high (1040.00).
Customize it based on your loot size (lot size), order count, & risk appetite.
A smart thief knows when to vanish! 🏃♂️💨
🏁 💰Target - The Vault Cash-Out Point:
Main Heist Target: 970.00
Or exit early if the cops (volatility) show up! 🚔🎯
💡 Scalper’s Note - Quick Grab & Dash:
If you’ve got a heavy bag 💼💸, scalp short aggressively.
If not, roll with the swing crew—use trailing SLs to lock the loot and flee clean. 💨📦
📉 Thief Insight – Why We're Robbing This Vault:
"SoyBeans" showing bearish breakdowns due to:
📰 COT Positioning
📦 Inventory & Storage Data
🕰️ Seasonal Weakness
💭 Sentiment Drift
🔗 Intermarket Signals
Get the full scoop—go dig deeper into your own thief intelligence sources. 📚🕵️♂️
⚠️ Stay Alert – Market Mayhem Incoming!
News drops = surveillance upgrades. Avoid new trades during major releases.
Protect running loot with tight trailing SLs—guard your stolen goods! 🛑🗞️📉
❤️🔥 Show Some Love to the Robbery Crew!
💥Smash that BOOST button💥 to fuel the Thief Army.
Together, we rob smarter. 💰🚀
🔔 Stay Tuned, Looters:
Another heist is being planned. Don't miss the next setup.
Money is out there… we just have to take it the thief way. 🧠💎
📜 Disclaimer:
This plan is for chart criminals in training 📉🕵️♂️ – not personalized financial advice.
Always assess your own risks before raiding any market vault.
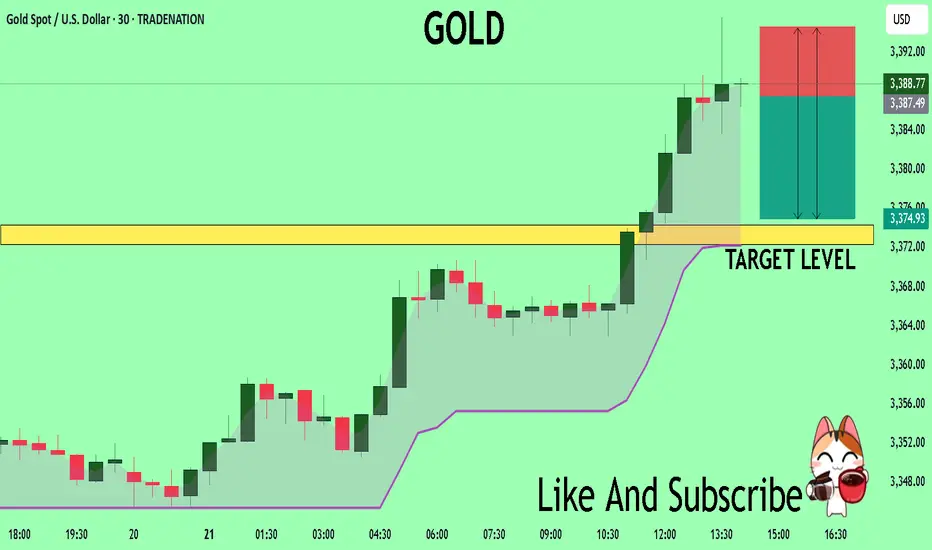
GOLD Technical Analysis! SELL!
My dear subscribers,
This is my opinion on the GOLD next move:
The instrument tests an important psychological level 3387.7
Bias - Bearish
Technical Indicators: Supper Trend gives a precise Bearish signal, while Pivot Point HL predicts price changes and potential reversals in the market.
Target - 3374.3
My Stop Loss - 3394.5
About Used Indicators:
On the subsequent day, trading above the pivot point is thought to indicate ongoing bullish sentiment, while trading below the pivot point indicates bearish sentiment.
Disclosure: I am part of Trade Nation's Influencer program and receive a monthly fee for using their TradingView charts in my analysis.
———————————
WISH YOU ALL LUCK
WILL CRUDE HOLD BEARISH TREND DURING FED CHAIR POWELL SPEECH?!!?CRUDE OIL
Looking for a BEARISH continuation, of last week's Friday Fall.
Take Profit near 2.00 Extension level (64.715)
Stop Loss above the previous Hourly high candlestick (66.103)

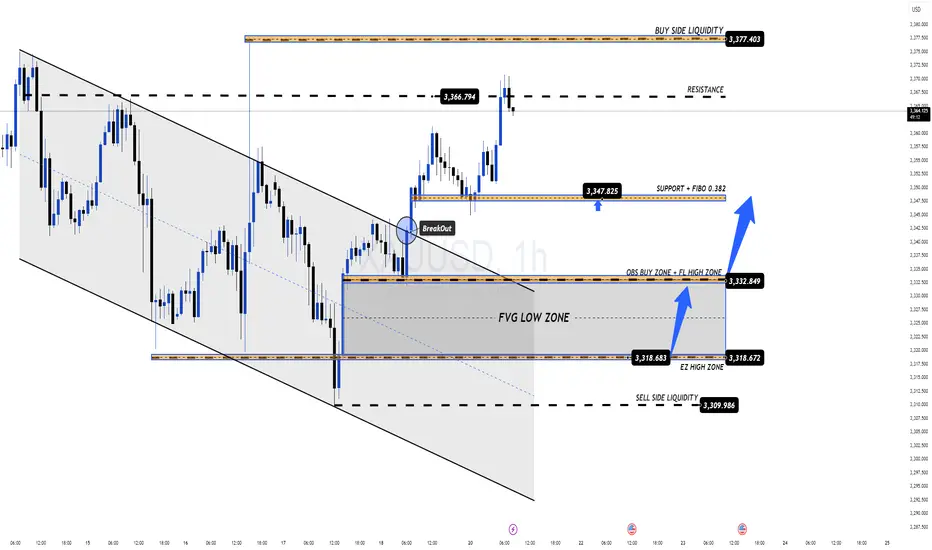
QUIET START TO THE WEEK, WATCH OUT FOR KEY RESISTANCE!🔔 GOLD PLAN 21/07 – QUIET START TO THE WEEK, WATCH OUT FOR KEY RESISTANCE!
🌍 Market Overview
Gold has bounced back strongly following a brief pullback late last week. The move comes as geopolitical tensions and global conflicts continue to escalate.
While this week may not feature high-impact economic data, macroeconomic risks and global uncertainty remain the primary drivers of price action.
📊 Technical Outlook
Price is currently approaching a strong resistance zone between 3377–3380, which aligns with a Buy Side Liquidity region.
💡 Sellers may step in here to push the price lower, aiming to fill FVG zones (Fair Value Gaps) left behind during the previous bullish rally.
⚠️ Entering SELL positions at this level is risky — only act upon confirmed reversal signals (candlestick rejection or volume-based confirmation).
🎯 Trade Setup
🟢 BUY ZONE: 3331 – 3329
Stop Loss: 3325
Take Profits:
3335 → 3340 → 3344 → 3348 → 3352 → 3358 → 3364 → 3370
🔴 SELL ZONE (confirmation required): 3377 – 3379
Stop Loss: 3383
Take Profits:
3372 → 3368 → 3364 → 3360 → 3350
📌 Key Notes
The 3347 zone acts as short-term support for bulls. If this level breaks, a move toward lower FVG liquidity zones becomes more likely.
Keep an eye on EU session volume for clearer short-term direction and better trade timing.
✅ Final Thoughts
Discipline is key. Stick to your TP/SL strategy to manage risk effectively during early-week volatility.
🛡️ Wishing everyone a successful start to the week. Stay patient, stay focused.
GOD BLESS ALL!
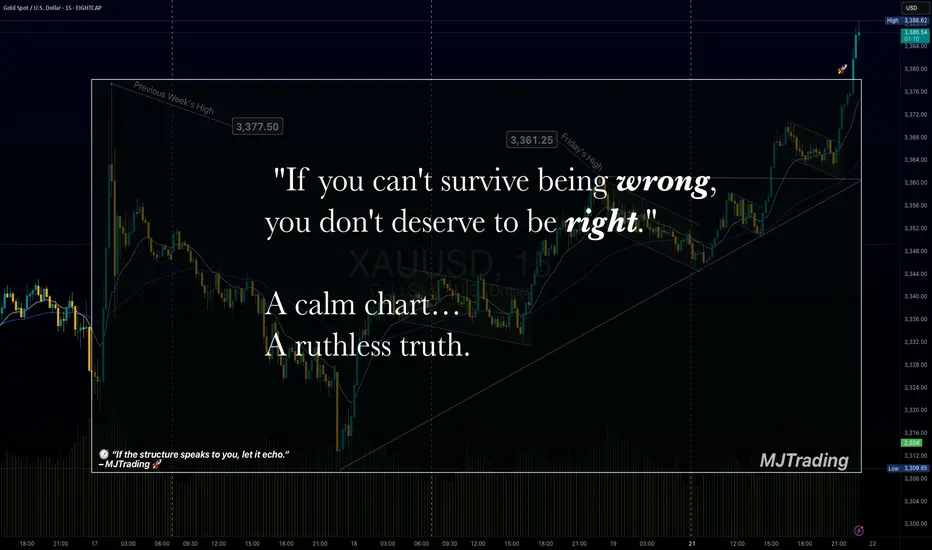
Survive first. Thrive later.🧠 Trading Psychology x Risk Management
"If you can't survive being wrong, you don't deserve to be right."
💬 A calm chart…
A ruthless truth.
Most traders obsess over being right.
But the market only rewards those who manage being wrong.
Risk control isn’t just technical — it’s emotional.
Survive first. Thrive later.
— MJTrading
Psychology Always Matters:
Click on them for notes in the caption...
#MJTrading #ChartDesigner #TradingPsychology #RiskManagement #MindfulTrading #CapitalPreservation #SmartMoney #XAUUSD #ForexDiscipline #15minChart #GoldAnalysis #MentalEdge #Gold