CRUDE OIL (WTI): Consolidation is Over
Crude Oil was consolidating for 6 trading days in a row
after a test of a key daily support.
The yesterday's Crude Oil Inventories data made the market bullish
and the price successfully violated a minor resistance of a sideways movement.
We can expect that the market will grow more.
Next resistance - 69.27
❤️Please, support my work with like, thank you!❤️
Commodities

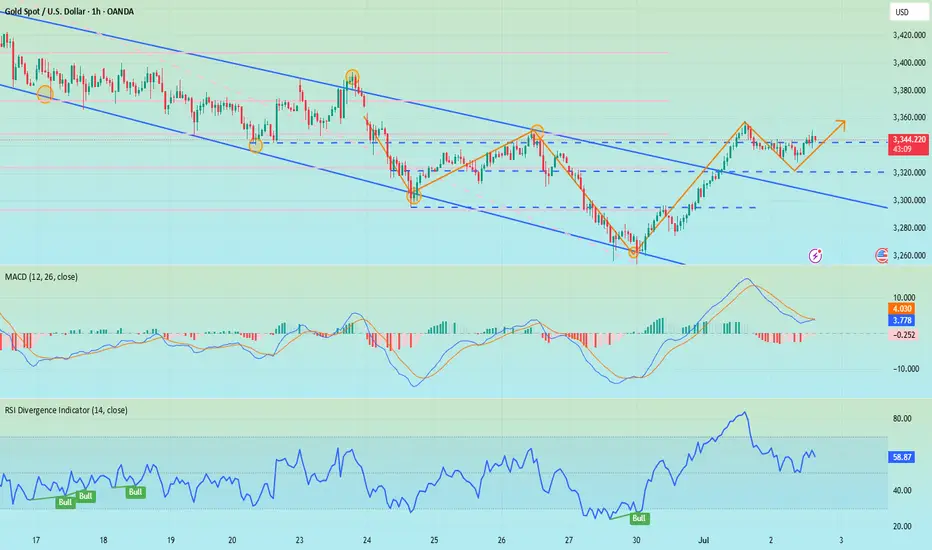
GOLD → Retesting resistance may lead to a breakout.FX:XAUUSD breaks the downward resistance line on the senior timeframe and tests the upper limit of the trading range amid the falling dollar and Powell's speech. The metal may continue its upward movement.
The dollar's rise was short-lived after Fed Chairman Jerome Powell hinted at an imminent interest rate cut, but not in July... The probability of a rate cut in July fell to 22%, and in September to 72%.
Markets are awaiting fresh employment data (ADP and Nonfarm Payrolls), which could influence the prospects for rate cuts. Weak reports could revive interest in gold, but for now, the asset remains under pressure due to the short-term strengthening of the dollar and uncertainty surrounding Fed policy.
Technically, if the pre-breakout structure remains intact and gold continues to attack resistance within the local range of 3347-3330 (3335), the chances of further growth will be high...
Resistance levels: 3347, 3358
Support levels: 3336, 3316, 3311
The global trend is upward, and locally, the price is also returning to growth. If the bulls can maintain the current trend, break through the resistance at 3347, and hold their ground above this level, then the next target will be 3390-3400. I do not rule out a correction to 3325, 3316 (liquidity hunt) before the growth continues.
Best regards, R. Linda!

XAUUSD M15 I Bearish Reversal Based on the M15 chart, the price is approaching our sell entry level at 3355, a pullback resistance that aligns with the 61.8 Fib retracement.
Our take profit is set at 3343 an overlap support.
The stop loss is set at 3365.97, a swing high resistance.
High Risk Investment Warning
Trading Forex/CFDs on margin carries a high level of risk and may not be suitable for all investors. Leverage can work against you.
Stratos Markets Limited (tradu.com ):
CFDs are complex instruments and come with a high risk of losing money rapidly due to leverage. 63% of retail investor accounts lose money when trading CFDs with this provider. You should consider whether you understand how CFDs work and whether you can afford to take the high risk of losing your money.
Stratos Europe Ltd (tradu.com ):
CFDs are complex instruments and come with a high risk of losing money rapidly due to leverage. 63% of retail investor accounts lose money when trading CFDs with this provider. You should consider whether you understand how CFDs work and whether you can afford to take the high risk of losing your money.
Stratos Global LLC (tradu.com ):
Losses can exceed deposits.
Please be advised that the information presented on TradingView is provided to Tradu (‘Company’, ‘we’) by a third-party provider (‘TFA Global Pte Ltd’). Please be reminded that you are solely responsible for the trading decisions on your account. There is a very high degree of risk involved in trading. Any information and/or content is intended entirely for research, educational and informational purposes only and does not constitute investment or consultation advice or investment strategy. The information is not tailored to the investment needs of any specific person and therefore does not involve a consideration of any of the investment objectives, financial situation or needs of any viewer that may receive it. Kindly also note that past performance is not a reliable indicator of future results. Actual results may differ materially from those anticipated in forward-looking or past performance statements. We assume no liability as to the accuracy or completeness of any of the information and/or content provided herein and the Company cannot be held responsible for any omission, mistake nor for any loss or damage including without limitation to any loss of profit which may arise from reliance on any information supplied by TFA Global Pte Ltd.
The speaker(s) is neither an employee, agent nor representative of Tradu and is therefore acting independently. The opinions given are their own, constitute general market commentary, and do not constitute the opinion or advice of Tradu or any form of personal or investment advice. Tradu neither endorses nor guarantees offerings of third-party speakers, nor is Tradu responsible for the content, veracity or opinions of third-party speakers, presenters or participants.

USOIL is Nearing the Daily TrendHey Traders, in tomorrow's trading session we are monitoring USOIL for a buying opportunity around 64.30 zone, USOIL is trading in an uptrend and currently is in a correction phase in which it is approaching the trend at 64.30 support and resistance area.
Trade safe, Joe.

Gold is Pushing Bullish but is it really ready???This looks like a early move to move full on bullish. I feel like it might need to sweep the low from mid week before they really ready to go bullish. waiting for things to show a bit more clear during the Kill Zone.

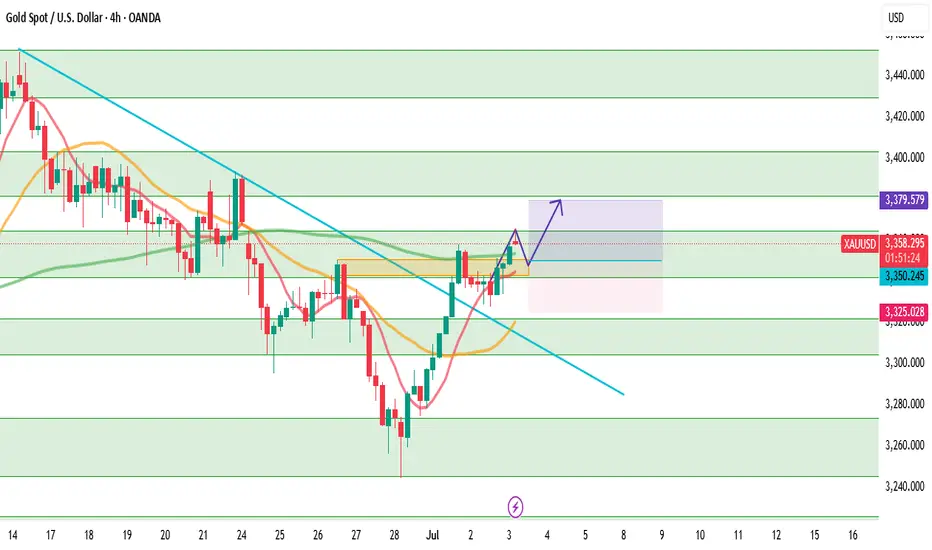
XAUUSD — July 3rd, 2025: Is the Downtrend Finally Over?Gold (XAUUSD) opened today with a bullish gap, and continued the momentum from Tuesday’s breakout above the major downtrendline that had capped the market for weeks. This technical breakout was long-awaited by many traders, and it's now leading us into a potential trend reversal phase — but not without resistance.
Price has now reached a critical resistance zone at 3366, which previously acted as a strong supply area during the last leg of the downtrend. If this level is broken decisively (ideally with a 4H candle close and follow-through), it may signal a clean shift toward a mid-term uptrend, with upside targets at 3379, 3403, and even 3430.
That said, rejection at 3366 has already triggered a minor pullback. We’re now watching the 3343–3351 zone as a potential support and an optimal buy entry area. If this zone holds, it could provide the fuel needed for bulls to continue their push.
🟢 Suggested Trade Plan
BUY LIMIT 3343–3351
Stop Loss 3325
Take Profit 1 3379
Take Profit 2 3403
Take Profit 3 3430
(Alternatively, consider a BUY STOP above 3370 in case of direct breakout)
📌 Market Structure
Resistance 3 3430
Resistance 2 3403
Resistance 1 3382
Pivot 3366
Support 1 3342
Support 2 3322
Support 3 3305
⚠️ Important Macro Alert
Today’s session is highly risky due to the early release of Non-Farm Payrolls (NFP) data, which is scheduled today instead of Friday because of the U.S. Independence Day (July 4) holiday tomorrow.
This brings a major volatility spike risk during the New York session. Manage your position size wisely, avoid emotional trades, and wait for solid confirmations.
Discipline beats prediction. Trade what you see — not what you feel.
Keep healthy so we can keep trading and we can keep on profiting.
GOLD Bullish Breakout! Buy!
Hello,Traders!
GOLD is going up now
And the price broke the
Key horizontal level
Around 3,346$ and
The breakout is confimred
So we are bullish biased
And we will be expecting
A further bullish move up
Buy!
Comment and subscribe to help us grow!
Check out other forecasts below too!
Disclosure: I am part of Trade Nation's Influencer program and receive a monthly fee for using their TradingView charts in my analysis.

Sudden Oil Spike - what you need to know!Iran suspended cooperation with the U.N. nuclear watchdog, amid a surprise build in US crude inventories.
Iran’s move added a modest risk premium to prices, though analysts noted that no actual supply disruptions have occurred.
$66 is a key level for WTI crude to hold above.
If it can maintain this area, we will likely see higher price. $66 is a multi year trendline of support going back to 2021.
Energy stocks / XLE basket is showing some bullish divergence, perhaps indicating this oil move has legs.

ADP data has been released, how to position gold in the future📰 News information:
1. ADP data, for reference of tomorrow's NFP data
2. Interest rate cuts and Powell's dovish comments
3. Geopolitical impact on the gold market
📈 Technical Analysis:
The ADP data was significantly bullish after it was released, but gold did not rise sharply in the short term. Instead, it touched the resistance of 3350 that we gave and then fell back. I also saw a lot of fake traders in the market who immediately told their brothers to go long and look towards 3380 after the ADP data was released. To be honest, I think these people are typical hindsight experts. If everyone is like this, then anyone can be called a trader, right?
Back to the topic, I still hold short orders at 3340-3350. In the short term, gold will fluctuate and be bearish to seek restorative support, so the best place to go long is to look at the retracement below, which will at least touch 3333-3323. If it falls below this support, it will go to 3315-3305. On the contrary, if it gets effective support at 3333-3323, then gold will rebound as expected to form a head and shoulders bottom.
🎯 Trading Points:
SELL 3340-3350-3355
TP 3333-3323-3315-3295
BUY 3335-3325
TP 3345-3355-3375
In addition to investment, life also includes poetry, distant places, and Allen. Facing the market is actually facing yourself, correcting your shortcomings, confronting your mistakes, and strictly disciplining yourself. I hope my analysis can help you🌐.
FXOPEN:XAUUSD PEPPERSTONE:XAUUSD FOREXCOM:XAUUSD FX:XAUUSD OANDA:XAUUSD TVC:GOLD
GOLD - WAVE 5 BULLISH TO $3,734 (UPDATE)While we currently hold a bearish bias, let's not forget what I said on this previous 'bullish bias' post. I said Gold bullish structure is only invalidated AFTER we see price go BELOW $3,245. Price came very close to our 'Wave 2 low' but did not surpass it.
Just keep an eye out & always be prepared.

Bullish rise for the Gold?The price is reacting off the resistance level which is a pullback resistance and could potentially rise from this level to our take profit.
Entry: 3,344.54
Why we like it:
There is a pullback resistance level.
Stop loss: 3,302.57
Why we like it:
There is a pullback support level.
Take profit: 3,403.53
Why we like it:
There is a pullback resistance level that lines up with the 78.6% Fibonacci retracement.
Enjoying your TradingView experience? Review us!
Please be advised that the information presented on TradingView is provided to Vantage (‘Vantage Global Limited’, ‘we’) by a third-party provider (‘Everest Fortune Group’). Please be reminded that you are solely responsible for the trading decisions on your account. There is a very high degree of risk involved in trading. Any information and/or content is intended entirely for research, educational and informational purposes only and does not constitute investment or consultation advice or investment strategy. The information is not tailored to the investment needs of any specific person and therefore does not involve a consideration of any of the investment objectives, financial situation or needs of any viewer that may receive it. Kindly also note that past performance is not a reliable indicator of future results. Actual results may differ materially from those anticipated in forward-looking or past performance statements. We assume no liability as to the accuracy or completeness of any of the information and/or content provided herein and the Company cannot be held responsible for any omission, mistake nor for any loss or damage including without limitation to any loss of profit which may arise from reliance on any information supplied by Everest Fortune Group.

GOLD 4H: structure broken - phase reversal beginsTwo key directional signals were recorded on the gold chart: first, a breakdown of the ascending channel, followed by a confident downward exit from the triangle with a clear fixation under the $3297 boundary. Both figures worked independently, but consistently - and strengthened the impulse towards selling.
The price has already gone beyond the lower boundary of the triangle ($3297), confirming the bearish scenario. Candlesticks closing under the level and local consolidation from below is a characteristic formation before the momentum continues.
Technical parameters:
- Channel breakout: completed
- Triangle breakout: $3297 level
- Retest from below: expected as confirmation
- EMAs reversed downwards, structure broken
- Volumes strengthened at the moment of breakout
Tactical plan:
- Sell after retest of $3297
- Targets on the move: $3248 and $3201
- Stop: above $3305 (above the area of false outs).
The current structure indicates the end of the accumulation phase and the beginning of the downward momentum. As long as the price holds below $3297 - shorts are the priority.

GOLD BROKEN WEDGE|LONG|
✅GOLD was trading in an
Opening wedge pattern and
Now we are seeing a bullish
Breakout so we are bullish
Biased and we will be expecting
A further bullish move up
LONG🚀
✅Like and subscribe to never miss a new idea!✅
Disclosure: I am part of Trade Nation's Influencer program and receive a monthly fee for using their TradingView charts in my analysis.

XAUUSD: Eyes $3,800 based on this 2 year pattern.Gold turned neutral again on its 1D technical outlook (RSI = 52.131, MACD = 4.646, ADX = 13.719) as after last week's selling, it recovered yesterday its 1D MA50, restoring the bullish trend. The long term trend has been extremely bullish after all and the past 2 months have simply been a consolidation stage through a Triangle pattern that worked as accumulation for the next bullish wave. On this 2 year pattern, typical waves rose by at least +22.57%. Once the 1D MA50 turns into a support again, we anticipate that a new Channel Up will push Gold to a TP = 3,800.
See how our prior idea has worked out:
## If you like our free content follow our profile to get more daily ideas. ##
## Comments and likes are greatly appreciated. ##

ADA/USDT : Get Ready for another Bullrun (READ THE CAPTION)By analyzing the #Cardano chart on the 3-day timeframe, we can see that the price is currently trading around $0.59. After sweeping the liquidity below $0.51, our bullish outlook for the next upward wave has strengthened significantly.
I'm now expecting a strong move from ADA, with short-term targets at $0.61 and $0.76, and longer-term targets at $0.93, $1.05, and $1.33!
Please support me with your likes and comments to motivate me to share more analysis with you and share your opinion about the possible trend of this chart with me !
Best Regards , Arman Shaban

“Accumulation, Breakout, Repeat: SBSW’s Time Again?” SBSW | Weekly Chart Analysis
4-Year Cycle | Smart Money Levels | Precious Metals Macro Tailwind
This chart paints a clear picture — Sibanye-Stillwater (SBSW) has followed a reliable 4-year accumulation-to-expansion cycle:
🔹 2015–2016
🔹 2019–2021
🔹 Now shaping up for 2025–2026
Each rally kicked off after institutional accumulation around the $3 level, and once again, we’re seeing the same behavior. History doesn’t just rhyme — it repeats.
🧠 Smart Money Moves
Every major cycle began after price based out near the $3 level. That’s exactly what we’ve just seen — accumulation, basing, and now lift-off. We’ve entered a familiar pattern — the same smart money footprints showing up again.
📊 Technical Breakdown
This is the weekly chart, and we’re now testing the 0.236 Fibonacci retracement level (7.39) drawn from the 2020 high to the recent low.
✅ A weekly close above this level + structure building could confirm the beginning of a long-term leg higher.
📈 Volume Flow Indicator has crossed above the midline for the first time in years, suggesting that real buying pressure is back. That’s a shift in momentum worth noting.
🎯 Key Areas of Interest:
• $10.00 – Volume node + prior S/R
• $12.00 – Fib midpoint + prior pivot
• $14.90 – Confluence zone
These are zones where I’ll be watching for continuation, reaction, or reversal.
🌎 Macro Tailwind: Precious Metals Demand
Platinum and palladium are gaining renewed attention as demand increases in EVs, clean energy, and industrial sectors. SBSW — with its deep exposure to both metals — is positioned as a long-term beneficiary if this trend continues.
Add to that the recent global instability and de-dollarization chatter, and you’ve got a macro backdrop favoring real assets over paper. Precious metals are catching a bid — and SBSW could ride that wave.
🧠 My Position
Started buying $4.00 calls and recently rolled to $5.50s. I’m letting this one develop over time — watching for confirmation and continuation.
(Not financial advice — just sharing my perspective as always.)
🕰️ Cycles matter.
📚 History teaches.
💰 Smart money accumulates before the breakout.
This setup has all the hallmarks of a repeat cycle in progress. I’m locked in.
—
📍 Long-term chartwork, weekly timeframe. Zoom out to see the rhythm.
SBSW | Weekly Chart Analysis
4-Year Cycle | Smart Money Levels | Precious Metals Macro Tailwind
This chart paints a clear picture — Sibanye-Stillwater (SBSW) has followed a reliable 4-year accumulation-to-expansion cycle:
🔹 2015–2016
🔹 2019–2021
🔹 Now shaping up for 2025–2026
Each rally kicked off after institutional accumulation around the $3 level, and once again, we’re seeing the same behavior. History doesn’t just rhyme — it repeats.
🧠 Smart Money Moves
Every major cycle began after price based out near the $3 level. That’s exactly what we’ve just seen — accumulation, basing, and now lift-off. We’ve entered a familiar pattern — the same smart money footprints showing up again.
📊 Technical Breakdown
This is the weekly chart, and we’re now testing the 0.236 Fibonacci retracement level (7.39) drawn from the 2020 high to the recent low.
✅ A weekly close above this level + structure building could confirm the beginning of a long-term leg higher.
📈 Volume Flow Indicator has crossed above the midline for the first time in years, suggesting that real buying pressure is back. That’s a shift in momentum worth noting.
🎯 Key Areas of Interest:
• $10.00 – Volume node + prior S/R
• $12.00 – Fib midpoint + prior pivot
• $14.90 – Confluence zone
These are zones where I’ll be watching for continuation, reaction, or reversal.
🌎 Macro Tailwind: Precious Metals Demand
Platinum and palladium are gaining renewed attention as demand increases in EVs, clean energy, and industrial sectors. SBSW — with its deep exposure to both metals — is positioned as a long-term beneficiary if this trend continues.
Add to that the recent global instability and de-dollarization chatter, and you’ve got a macro backdrop favoring real assets over paper. Precious metals are catching a bid — and SBSW could ride that wave.
🧠 My Position
Started buying $4.00 calls and recently rolled to $5.50s. I’m letting this one develop over time — watching for confirmation and continuation.
(Not financial advice — just sharing my perspective as always.)
🕰️ Cycles matter.
📚 History teaches.
💰 Smart money accumulates before the breakout.
This setup has all the hallmarks of a repeat cycle in progress. I’m locked in.
📍 Long-term chartwork, weekly timeframe. Zoom out to see the rhythm.
🛑 Invalidation below $5.50 — no structure, no conviction, I’m out.
If SBSW breaks back below the $5.50 level with high volume and fails to reclaim it quickly, that would invalidate the current breakout structure and suggest this move was a false start. I'd reassess the cycle thesis if we revisit the $4 range with no buyer defense.
Please feel free to comment and let me your opinion

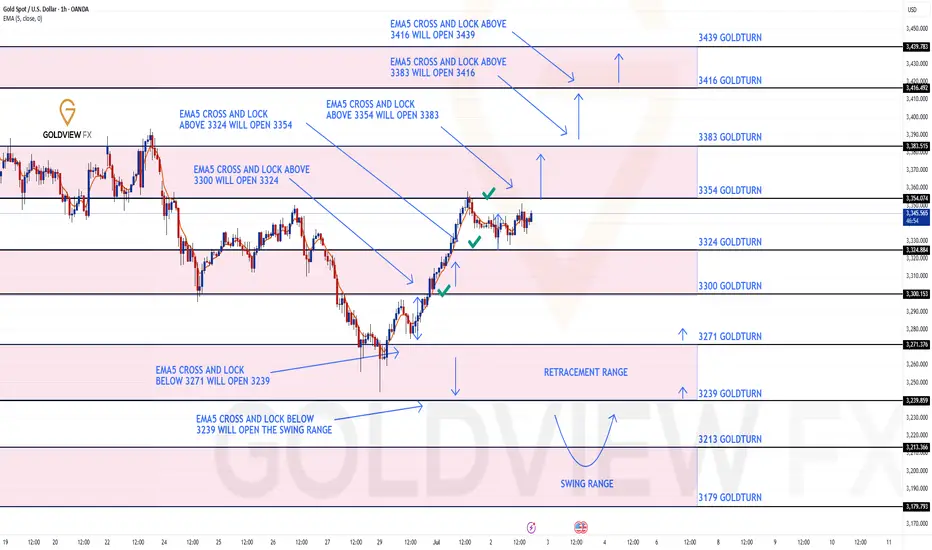
GOLD ROUTE MAP UPDATEHey Everyone,
Once again our chart idea and levels are being respected and playing out to perfection, allowing us to confirm continuations and rejections.
After completing our targets, 3324 and 3354 yesterday, we had no further cross and lock above 3354, confirming the rejection.
We are now seeing price play and consolidate between 3324 and 3354 and will need ema5 cross and lock on either level to confirm our next direction.
We will keep the above in mind when taking buys from dips. Our updated levels and weighted levels will allow us to track the movement down and then catch bounces up.
We will continue to buy dips using our support levels taking 20 to 40 pips. As stated before each of our level structures give 20 to 40 pip bounces, which is enough for a nice entry and exit. If you back test the levels we shared every week for the past 24 months, you can see how effectively they were used to trade with or against short/mid term swings and trends.
The swing range give bigger bounces then our weighted levels that's the difference between weighted levels and swing ranges.
BULLISH TARGET
3300 - DONE
EMA5 CROSS AND LOCK ABOVE 3300 WILL OPEN THE FOLLOWING BULLISH TARGETS
3324 - DONE
EMA5 CROSS AND LOCK ABOVE 3324 WILL OPEN THE FOLLOWING BULLISH TARGET
3354 - DONE
EMA5 CROSS AND LOCK ABOVE 3354 WILL OPEN THE FOLLOWING BULLISH TARGET
3383
BEARISH TARGETS
3271
EMA5 CROSS AND LOCK BELOW 3354 WILL OPEN THE FOLLOWING BEARISH TARGET
3239
EMA5 CROSS AND LOCK BELOW 3239 WILL OPEN THE SWING RANGE
3213
3179
As always, we will keep you all updated with regular updates throughout the week and how we manage the active ideas and setups. Thank you all for your likes, comments and follows, we really appreciate it!
Mr Gold
GoldViewFX
SILVER: Will Go Up! Long!
My dear friends,
Today we will analyse SILVER together☺️
The price is near a wide key level
and the pair is approaching a significant decision level of 36.440 Therefore, a strong bullish reaction here could determine the next move up.We will watch for a confirmation candle, and then target the next key level of 36.607.Recommend Stop-loss is beyond the current level.
❤️Sending you lots of Love and Hugs❤️

GOLD: Strong Bearish Sentiment! Short!
My dear friends,
Today we will analyse GOLD together☺️
The in-trend continuation seems likely as the current long-term trend appears to be strong, and price is holding below a key level of 3,341.44 So a bearish continuation seems plausible, targeting the next low. We should enter on confirmation, and place a stop-loss beyond the recent swing level.
❤️Sending you lots of Love and Hugs❤️

XAUUSD: Market analysis and strategy on July 2Gold technical analysis
Daily chart resistance 3400, support 3250
4-hour chart resistance 3355, support 3300
1-hour chart resistance 3345, support 3325
After gold adjusted to 3247, bulls launched a counterattack. This position is the 0.618 support from 3121 to 3451. It rose by $100 in two trading days. Bulls are still strong. Although the war is sometimes tense and sometimes relieved, the global geopolitical environment and economic environment are continuously getting worse step by step. This support logic has never changed. Even if it is temporarily relieved, gold will usher in a correction, but it is only a correction. Overall, the fundamental logic of the bull market has not changed.
Gold price reached 3358 and then fell back. Today, it fell below 3336 and continued to fall. The support point below is around 3325/3310. It continues to rise after the fall. It is necessary to pay attention to the specific point where it will stop falling and stabilize during the trading session. As far as the current market is concerned, it hit 3328 today to stop falling and rebound, and temporarily held the support position of 3325. It is bullish based on this position. There are ADP data today and NFP data tomorrow. Pay attention to the impact after the data is released.
BUY:3330near
BUY:3300near

XAUUSD Analysis – July 2–3, 2025: Resistance Holds Gold is currently trading around 3,337 USD, having tested the 3,350 USD resistance zone without a successful breakout. The price remains under pressure from key macroeconomic factors:
- The Dollar Index (DXY) is stable above 106 – a sign of continued demand for the greenback, which weakens gold.
- U.S. 10-year Treasury yields hold around 4.35%, reinforcing the view that the Fed will keep interest rates high.
- The Core PCE report for June remains above the Fed’s 2% inflation target, decreasing expectations of a rate cut in Q3.
- Safe-haven demand is weak, as geopolitical tension in the Middle East and Eastern Europe remains subdued.
➡ Overall, these factors confirm that XAUUSD remains under bearish pressure in both the short and medium term, especially while key resistance remains intact.
1. Technical Analysis – XAUUSD on D1 Chart
- Price recently tested the 3,340 – 3,350 USD resistance zone, a confluence of:
Previous supply zone
- Fibonacci retracement 0.5–0.618 from 3,399 USD
- Key Change of Character (CHoCH) level
- RSI is forming a mild bearish divergence, signaling weakening bullish momentum.
- EMA20 and EMA50 are both sloping downward – confirming the prevailing bearish trend.
This setup is typical of a Sell on Rally pattern, with each retracement being rejected at strong resistance.
2. Key Technical Zones to Watch
Technical Role
- 3,350 – 3,340 Major resistance (Fibo 0.5–0.618 + supply + CHoCH)
- 3,294 – 3,285 Nearest support – previously a resistance-turned-support
- 3,255 – 3,235 Short-term target zone – June low
- 3,223 – 3,205 Strong medium-term support – April low + extended Fibo
3. Suggested Trade Setup
Preferred Scenario: SELL below 3,350
Entry: 3,345 – 3,347
Stop Loss: 3,351
Take Profit 1: 3,335
Take Profit 2: 3,330
Take Profit 3: 3,320
Ps : XAUUSD is retesting a major resistance zone without macro or technical catalysts for a sustained breakout. The best approach remains to sell at resistance and take profit near support, in alignment with the ongoing bearish trend.
The strategy will be updated regularly – don’t forget to save and follow to stay ahead of market opportunities.
The analysis was provided by @Henrybillion

Copper is gonna to complete the 2nd leg??Hi all trading lovers and copper buyers...
Seems that after BREAKOUT from Descending Triangle and Pullback to breakout level, price is going to complete the 2nd BULLISH Leg in Weekly uptrend with a round level target (5.5555)...
(Pullback could be a bit deeper...)
PLEASE NOTE THAT IS ONLY AN ANALYSIS AND COULD BE WRONG...
MARKET IS BASED ON POSSIBILITIES AND UNCERTAINTIES...
MANAGE YOUR RISK...
#Forex #Trading #Analysis #Copper #Chart #Spike #Wedge #Uptrend

As expected, it will fall and form a head and shoulders bottom📰 News information:
1. ADP data, for reference of tomorrow's NFP data
2. Interest rate cuts and Powell's dovish comments
3. Geopolitical impact on the gold market
📈 Technical Analysis:
Yesterday we expected gold to retreat to the 3330-3320 area. Today, gold hit a low of around 3328 during the Asian session, which is in line with our judgment of the market trend. In the short term, gold may still fall. First, it may test the 3323 support line. If it falls back to this position during the day, you can try to go long. In the short term, focus on the 3315-3305 long-short dividing line below. If gold gets effective support below, it is expected to form a head and shoulders bottom pattern. The short-term decline will accumulate momentum for the future rise. Pay attention to the ADP data during the NY period
🎯 Trading Points:
BUY 3323-3315-3305
TP 3340-3350-3360-3375
In addition to investment, life also includes poetry, distant places, and Allen. Facing the market is actually facing yourself, correcting your shortcomings, confronting your mistakes, and strictly disciplining yourself. I hope my analysis can help you🌐.
FXOPEN:XAUUSD PEPPERSTONE:XAUUSD FOREXCOM:XAUUSD FX:XAUUSD OANDA:XAUUSD TVC:GOLD
