NATURAL GAS - STILL IN THE GAME TRADING IDEA UPDATE -
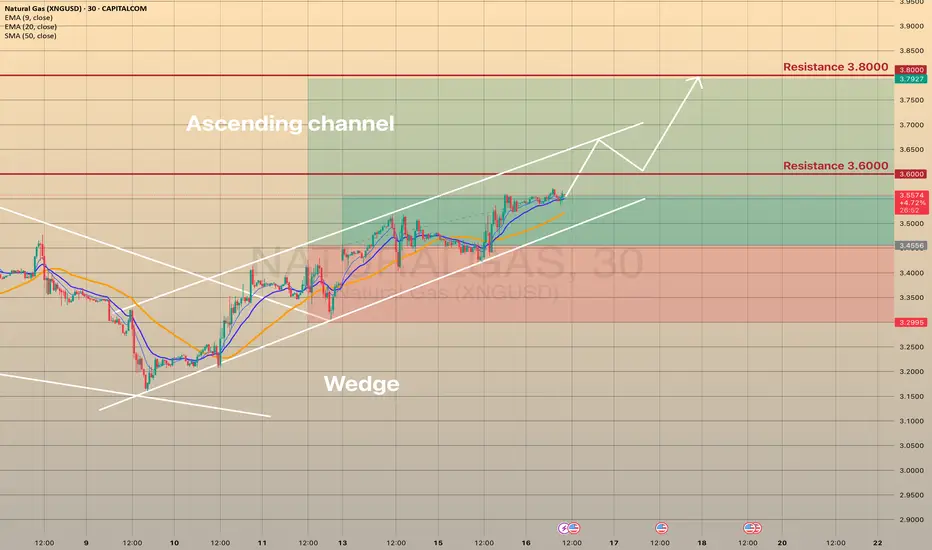
NATURAL GAS - STILL IN THE GAME🔥
The XNGUSD goes quite well, as predicted. It held the trendline and moving upwards slowly, but surely. Short-term support here is the EMA20 on 4h timeframe. The asset is just below 3.600 resistance level and sma200. Since the July 10, the asset seems to be moving within the ascending channel (pic 2). I expect that the price will break the 3.6000 resistance level, will go towards upper channel border and then, after quick retest, move towards 3.8000. Not a trading advice! Trade cautiously!
Commodities
GOLD Is Going Down! Short!
Please, check our technical outlook for GOLD.
Time Frame: 2h
Current Trend: Bearish
Sentiment: Overbought (based on 7-period RSI)
Forecast: Bearish
The price is testing a key resistance 3,363.11.
Taking into consideration the current market trend & overbought RSI, chances will be high to see a bearish movement to the downside at least to 3,342.15 level.
P.S
Please, note that an oversold/overbought condition can last for a long time, and therefore being oversold/overbought doesn't mean a price rally will come soon, or at all.
Disclosure: I am part of Trade Nation's Influencer program and receive a monthly fee for using their TradingView charts in my analysis.
Like and subscribe and comment my ideas if you enjoy them!

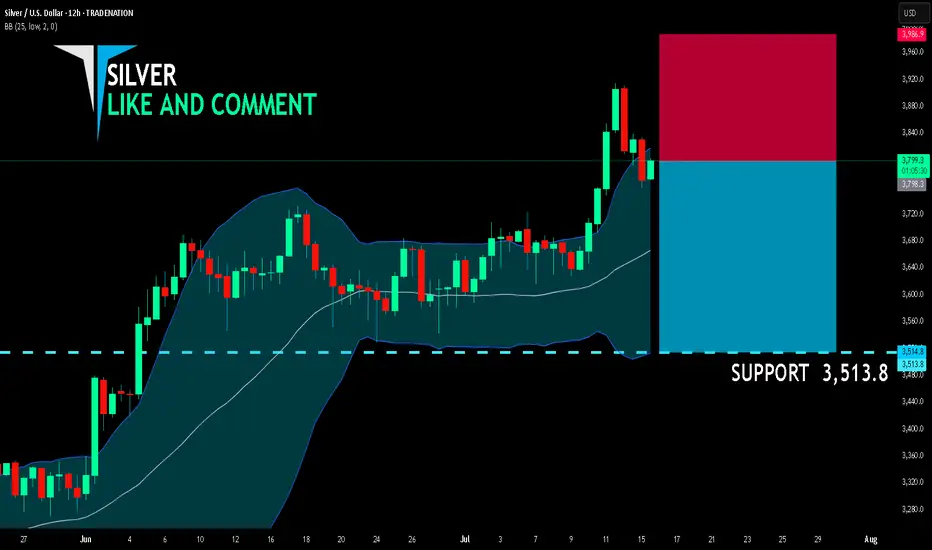
SILVER SELLERS WILL DOMINATE THE MARKET|SHORT
SILVER SIGNAL
Trade Direction: short
Entry Level: 3,798.3
Target Level: 3,513.8
Stop Loss: 3,986.9
RISK PROFILE
Risk level: medium
Suggested risk: 1%
Timeframe: 12h
Disclosure: I am part of Trade Nation's Influencer program and receive a monthly fee for using their TradingView charts in my analysis.
✅LIKE AND COMMENT MY IDEAS✅
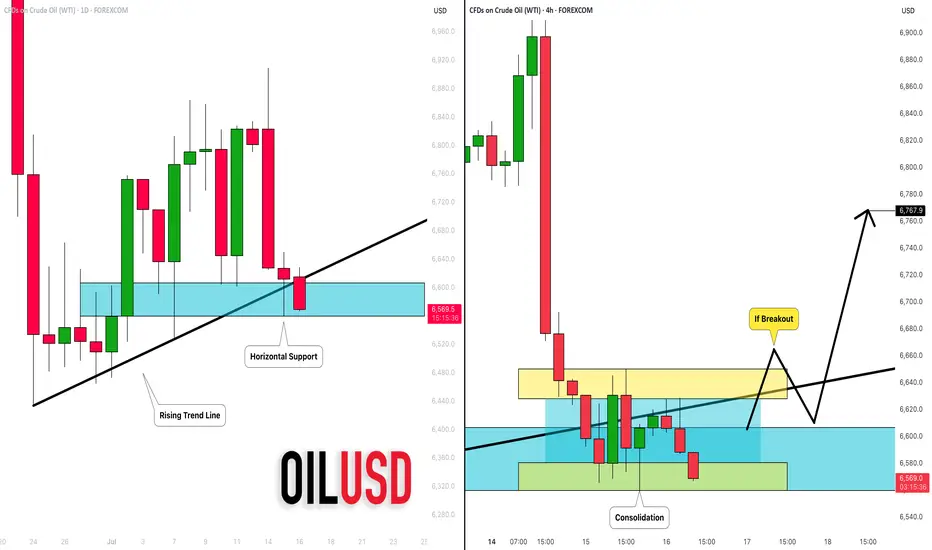
CRUDE OIL (WTI): Your Trading Plan Explained
Do not forget that today we expect Crude Oil Inventories data
release - it will be 10:30 am NY time.
Ahead of this news, the market is testing a significant daily support cluster
that is based on a rising trend line and a horizontal structure.
You signal to buy will be a bullish breakout of a minor intraday
horizontal resistance on a 4H.
4H candle close above 66,5 will be your confirmation.
A bullish continuation will be expected to 67.6 then.
I suggest waiting for the news release first and then check how
the market prices in the news. If our technicals align with fundamentals,
it will provide an accurate setup.
Alternatively, a bearish violation of a blue support will push the prices lower.
❤️Please, support my work with like, thank you!❤️
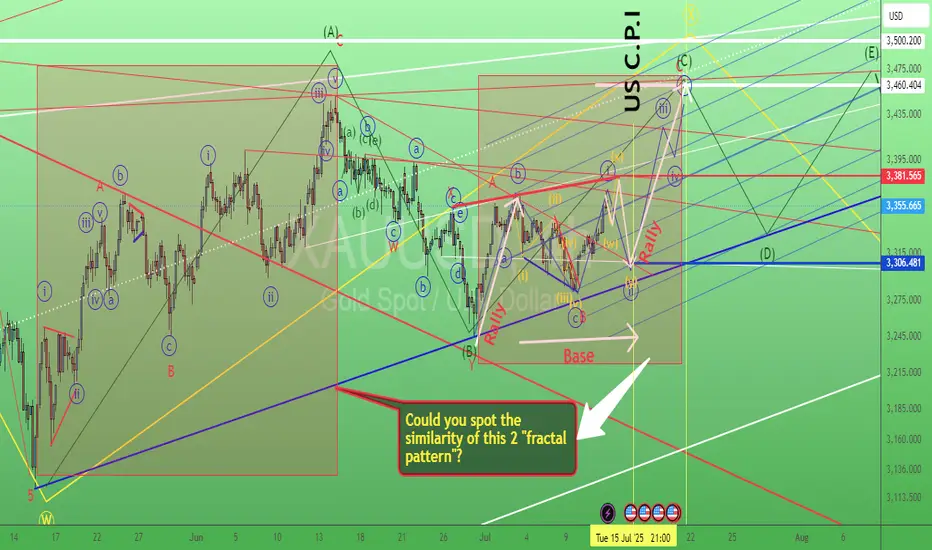
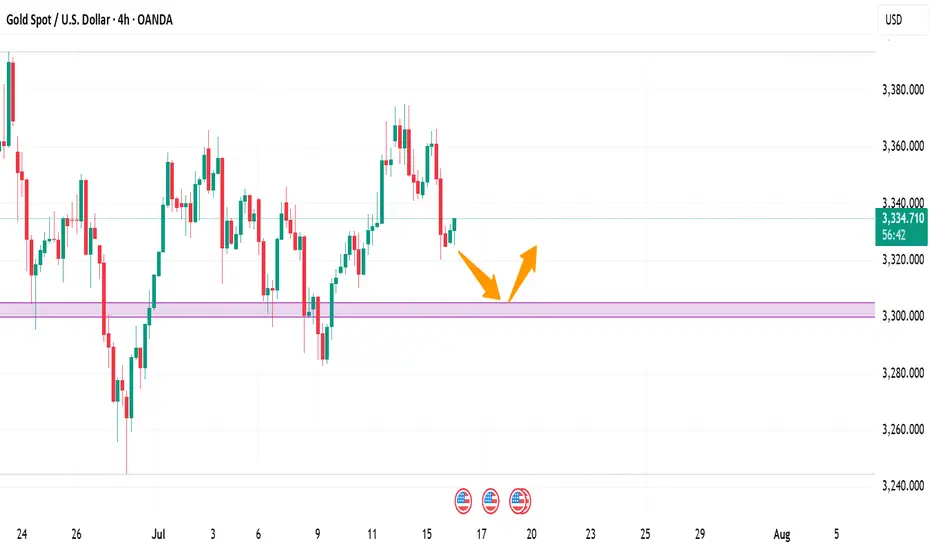
Gold swing trade setup 13/July/25XAUUSD. Based on the latest "speed" development of chart instead of forming a triangle pattern gold probably building a "flat" "Base" before rallying toward 3460 +/- Coming Tuesday US CPI could be the "trigger" for launching the rocket..
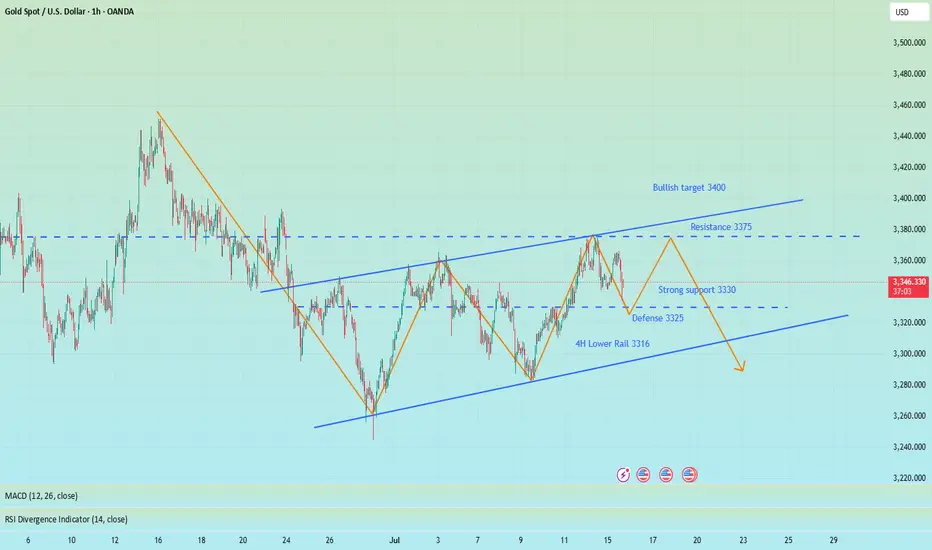
Public short selling profit, NY short-term multiple layoutInterest rate futures data showed that the results were in line with our previous expectations, with a lower rate cut this month and a higher probability of a 25 basis point cut in September. In the short term, gold may first take profits and then rebound. NY session trading has just begun. Bros can pay attention to the 3335-3330 area below. If it falls back and stabilizes, you can consider participating in long positions, defending 3325 and targeting 3355-3365.
OANDA:XAUUSD

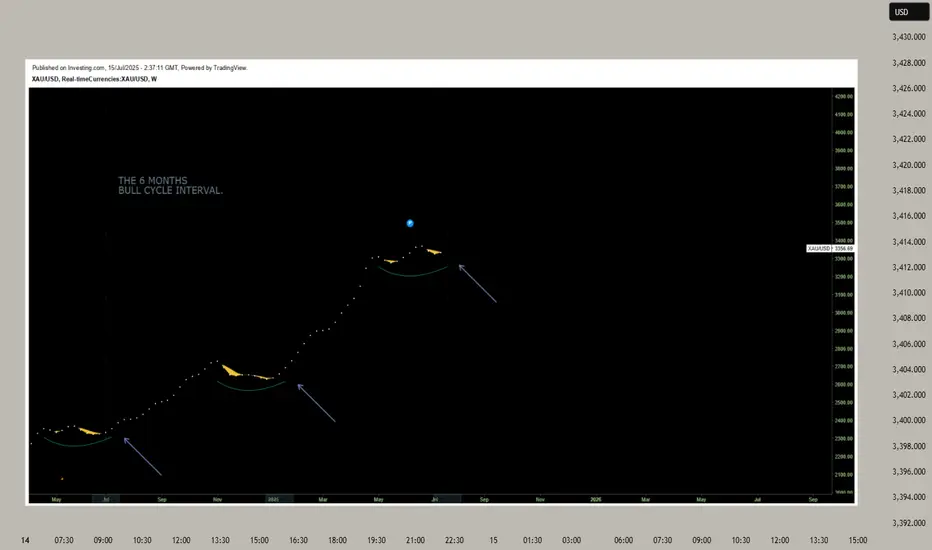
GOLD has entered a NEW BULL CYCLE this month! GET LOADED now!GOLD, has been on a consistent ascend since 2k levels hitting a series of ATH taps week after week.
As with any parabolic event -- a trim down is warranted.
After hitting its ATH zone at 3500, gold significantly corrected back to 38.2 fib levels at 3100 area. 38.2 fib levels has been acting as a strong support for GOLD for quite a bit and as expected buyers has started to converge and positioned themselves back again for that upside continuation -- long term.
After hitting this fib key level gold has been making consistent higher lows on the daily conveying clear intentions on its directional narrative -- to go NORTH.
As of this present, July 2025, GOLD has seen renewed elevation in momentum metrics signifying definitive blueprint towards its next upside move.
Based on our diagram above. WE have now entered a new bull cycle that only transpires every 6 months. The last cycles happened on July 2024, January 2025, then presently July 2025 which is in progress. This is very special as we dont get to see this bullish setup on a regular basis.
Ideal seeding zone is at the current range of 3300-3350.
Mid-Long Term Target at 3400
TAYOR.
Trade safely. Market is Market.
Not financial advice.
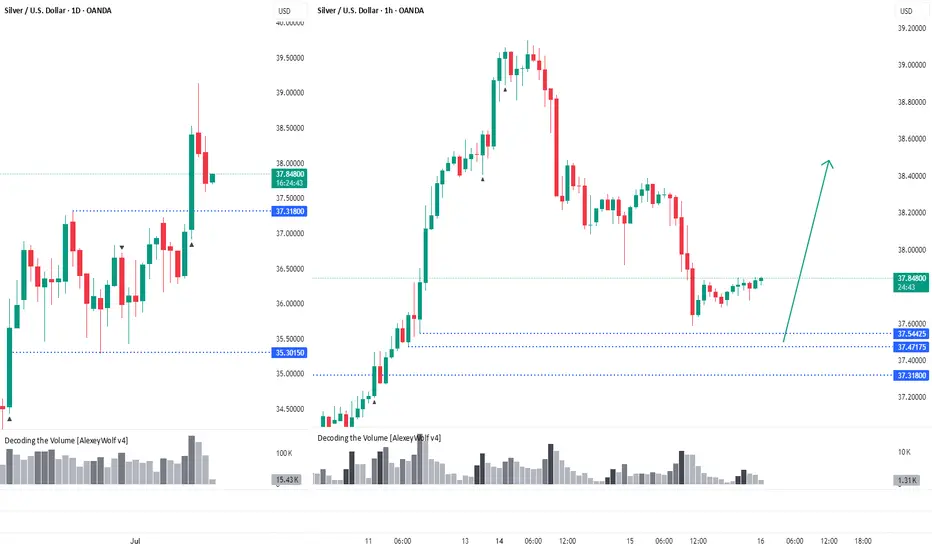
Silver. The price has pulled backHi traders and investors!
On the daily timeframe, the price has broken out of the sideways range through the upper boundary at 37.31.
The price has pulled back close to levels where potential buy patterns could form — 37.54, 37.47, and 37.31.
This analysis is based on the Initiative Analysis concept (IA).
Wishing you profitable trades!
What Gold actually wants to sayThis trend line shows on daily chart that gold is sustaining on his supports and rising day by day, Pure bullish in long run for swing and position trading.

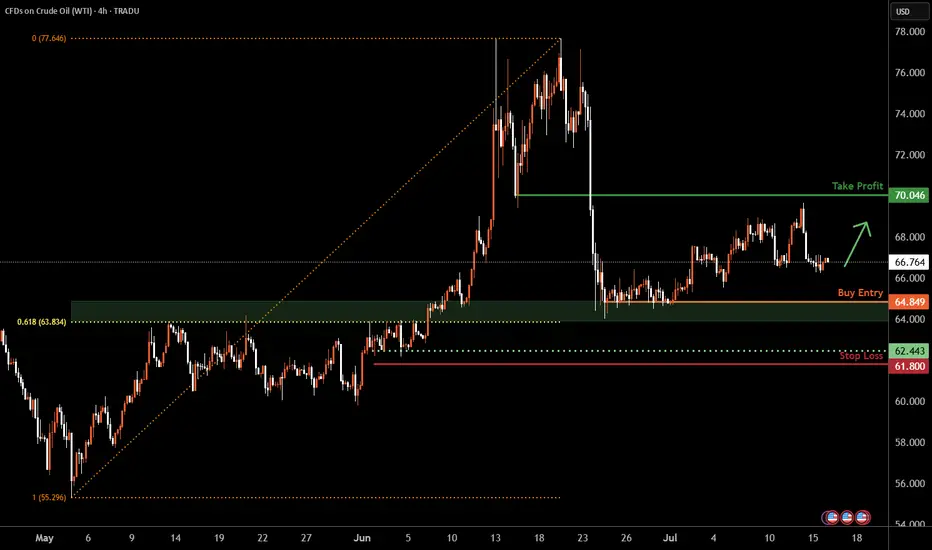
WTI Oil H4 | Potential bounce off a multi-swing-low supportWTI oil (USOIL) is falling towards a multi-swing-low support and could potentially bounce off this level to climb higher.
Buy entry is at 64.84 which is a multi-swing-low support that aligns closely with the 61.8% Fibonacci retracement.
Stop loss is at 61.80 which is a level that lies underneath a multi-swing-low support.
Take profit is at 70.04 which is a pullback resistance.
High Risk Investment Warning
Trading Forex/CFDs on margin carries a high level of risk and may not be suitable for all investors. Leverage can work against you.
Stratos Markets Limited (tradu.com ):
CFDs are complex instruments and come with a high risk of losing money rapidly due to leverage. 63% of retail investor accounts lose money when trading CFDs with this provider. You should consider whether you understand how CFDs work and whether you can afford to take the high risk of losing your money.
Stratos Europe Ltd (tradu.com ):
CFDs are complex instruments and come with a high risk of losing money rapidly due to leverage. 63% of retail investor accounts lose money when trading CFDs with this provider. You should consider whether you understand how CFDs work and whether you can afford to take the high risk of losing your money.
Stratos Global LLC (tradu.com ):
Losses can exceed deposits.
Please be advised that the information presented on TradingView is provided to Tradu (‘Company’, ‘we’) by a third-party provider (‘TFA Global Pte Ltd’). Please be reminded that you are solely responsible for the trading decisions on your account. There is a very high degree of risk involved in trading. Any information and/or content is intended entirely for research, educational and informational purposes only and does not constitute investment or consultation advice or investment strategy. The information is not tailored to the investment needs of any specific person and therefore does not involve a consideration of any of the investment objectives, financial situation or needs of any viewer that may receive it. Kindly also note that past performance is not a reliable indicator of future results. Actual results may differ materially from those anticipated in forward-looking or past performance statements. We assume no liability as to the accuracy or completeness of any of the information and/or content provided herein and the Company cannot be held responsible for any omission, mistake nor for any loss or damage including without limitation to any loss of profit which may arise from reliance on any information supplied by TFA Global Pte Ltd.
The speaker(s) is neither an employee, agent nor representative of Tradu and is therefore acting independently. The opinions given are their own, constitute general market commentary, and do not constitute the opinion or advice of Tradu or any form of personal or investment advice. Tradu neither endorses nor guarantees offerings of third-party speakers, nor is Tradu responsible for the content, veracity or opinions of third-party speakers, presenters or participants.
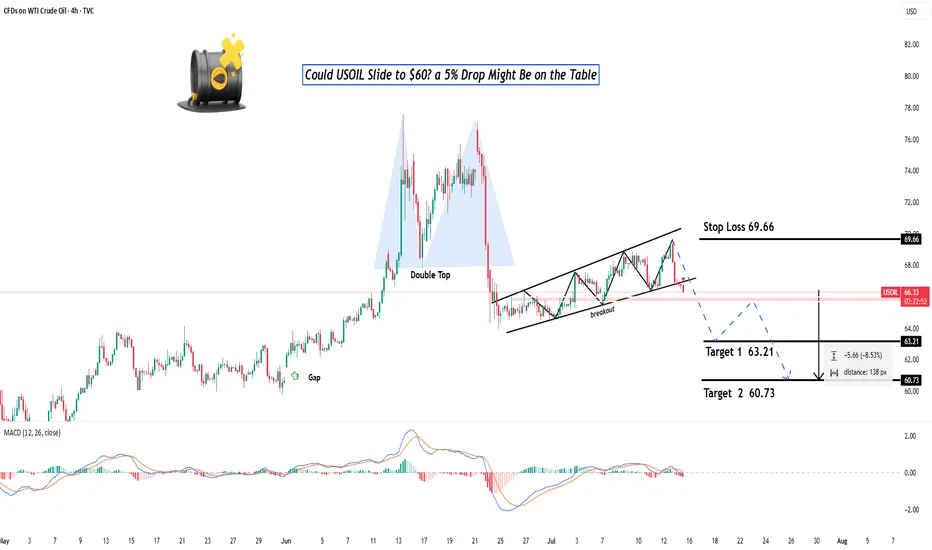
Could OIL Slide to $60? a 5% Drop Might Be on the Table? Hey Realistic Traders!
Price action is weakening. Will USOIL find support or slide further?
Let’s Break It Down..
On the 4H timeframe, oil has formed a double top pattern followed by a neckline breakout, which is a classic sign of a potential shift from a bullish to a bearish trend.
This breakout was confirmed by a break below the bullish trendline, accompanied by consecutive bearish full-body candlesticks that reinforce the bearish momentum. Afterward, the price formed a bearish continuation pattern known as a rising wedge, which was followed by a breakdown.
The combination of bearish reversal and continuation pattern breakouts signals further downside movement and confirms the shift into a bearish trend.
Therefore, we foresee the price forming lower lows and lower highs toward the first target at 63.21, with a potential extension to the close the gap at 60.73.
The bearish outlook remains valid as long as the price stays below the key stop-loss level at 69.66.
Support the channel by engaging with the content, using the rocket button, and sharing your opinions in the comments below.
Disclaimer: This analysis is for educational purposes only and should not be considered a recommendation to take a long or short position on USOIL.
GOLD in narrow range, after sharp drop on US CPI dataOANDA:XAUUSD fell sharply on Tuesday (July 15) as the US Dollar TVC:DXY gained significantly after the US CPI report was released. As of now (July 16), gold is trading at 3,326 USD/oz, equivalent to an increase of only 2 USD in the day.
The US Consumer Price Index (CPI) in June was in line with expectations but higher than the previous value. The surge in the Dollar after the US released the June CPI is the main reason for the pressure on gold prices so far.
• Data released by the US on Tuesday showed that the US CPI increased by 2.7% compared to the same period last year in June, in line with expectations, but higher than the 2.4% in May.
• The US CPI rose 0.3% month-on-month in June, in line with market expectations but up from a 0.1% increase, the largest increase since January this year.
• In addition, the US core CPI rose 2.9% year-on-year in June, up from 2.8% in May, while the core CPI in June rose 0.2% month-on-month.
The market generally believes that US President Trump's tariff policies have increased price pressures, prompting the Federal Reserve to wait and see what further action to take. Federal Reserve Chairman Powell previously said he expected prices to rise in the summer.
The market is still expecting the first rate cut in September. Investors are looking ahead to Wednesday's U.S. producer price index data for more information on the Federal Reserve's move.
Since gold does not yield interest, it typically performs well in low-interest-rate environments, whereas high-interest-rate environments or expectations of future rate hikes put pressure on gold prices.
Technical Outlook Analysis OANDA:XAUUSD
On the daily chart, gold is trading in a fairly narrow range after 2 sessions of downward adjustment, but the specific trend is still unclear, as sent to readers throughout last week, the technical conditions mainly show a sideways accumulation movement. After testing the 0.236% Fibonacci retracement level, gold was unable to overcome this resistance, and the decline from this position brought the gold price close to the support of 3,310 USD and then the area of the original price point of 3,300 USD with the 0.382% Fibonacci retracement.
With the technical conditions not giving a specific trend as they are now, for gold to be able to have a new bullish cycle it needs to move the price action above the 0.236% Fibonacci retracement level, then the target would be around $3,400 in the short term, more than $3,430. On the other hand, if gold falls below the 0.382% Fibonacci retracement level again, it could be a good signal for an expectation of a bullish cycle, then the target would be around $3,246 in the short term, more than the 0.50% Fibonacci retracement level.
The relative strength index is hovering around 50, indicating that the market is hesitant in terms of momentum and is not leaning towards a specific trend.
During the day, with the current sideways accumulation, gold will be noticed by the following technical levels.
Support: 3,310 – 3,300 – 3,292 USD
Resistance: 3,240 – 3,250 – 3,371 USD
SELL XAUUSD PRICE 3383 - 3381⚡️
↠↠ Stop Loss 3387
→Take Profit 1 3375
↨
→Take Profit 2 3369
BUY XAUUSD PRICE 3304 - 3306⚡️
↠↠ Stop Loss 3300
→Take Profit 1 3312
↨
→Take Profit 2 3318
XAUUSD Structural Analysis & Confluence - 16 July 2025 4-Hour Bias & Structural Context
Gold has recently broken above a key structure level at $3,320, confirming a bullish market environment on the 4‑hour timeframe. This follows a Change of Character (CHOCH) around $3,300, signifying a shift from consolidation to an upward trend. The swing from the late-June low ($3,244) to mid-July’s high ($3,374) sets our Fibonacci context:
38.2% retrace ≈ $3,318
50% retrace ≈ $3,309
61.8% retrace ≈ $3,300
These fib levels also align with prior structure and key ICT/SMC zones, signaling strong areas of interest.
🧭 Key 4-Hour Confluence Zones
Demand / Order Block → $3,300 – 3,305
Multi-method support: BOS, CHOCH, 50–61.8% fib convergence.
Fair Value Gap (FVG) → $3,320 – 3,325
Volume deficient zone post-BOS, primed for a retest.
Supply / Resistance Area → $3,360 – 3,370
High-timeframe supply, likely to cap further upside.
🧠 Smart Money Concepts
BOS above $3,320 confirms bullish structure.
CHOCH at ~$3,300 marks structure flip.
Liquidity grab zones found between $3,335–3,340, validating the presence of institutional activity.
Order Block at $3,300–3,305 supports buy-side interest.
📊 1-Hour Intraday Trade Setups
🔸 Setup #1 – FVG Re-Test
Entry: At ~$3,325 on pullback into $3,320–3,325 zone
SL: Below $3,320
TP1: $3,345, TP2: $3,360
🔸 Setup #2 – Demand OB Bounce (“Golden Setup”)
Entry: In the $3,300–3,305 range
SL: Below $3,298
TP1: $3,325, TP2: $3,345, TP3: $3,360
Edge: Tight risk, high confluence (SMC + fib + structure)
🌟 The Golden Setup
Zone to Watch: $3,300–3,305
Why It Rates Highest:
BOS, CHOCH, fib, and OB all align
Offers tight stop placement and strong upside
Risk-to-reward ~1:3
📌 Daily Watchlist Summary
Directional Bias: Bullish (BOS above $3,320 intact)
Primary Entry Zones:
$3,300–3,305 (Demand OB + structure)
$3,320–3,325 (FVG retest for continuation)
Key Target Zones:
$3,345–3,350 – realistic intraday exit
$3,360–3,370 – major supply cap
Invalidation Level: 4‑hour candle close below $3,298 negates bullish outlook
Final Commentary
Stay disciplined—only trade reactive signals at these levels: clean bounces, pinbars, or bullish engulfing patterns. The $3,300–3,305 zone stands out as the prime ‘Golden Setup’ entry.
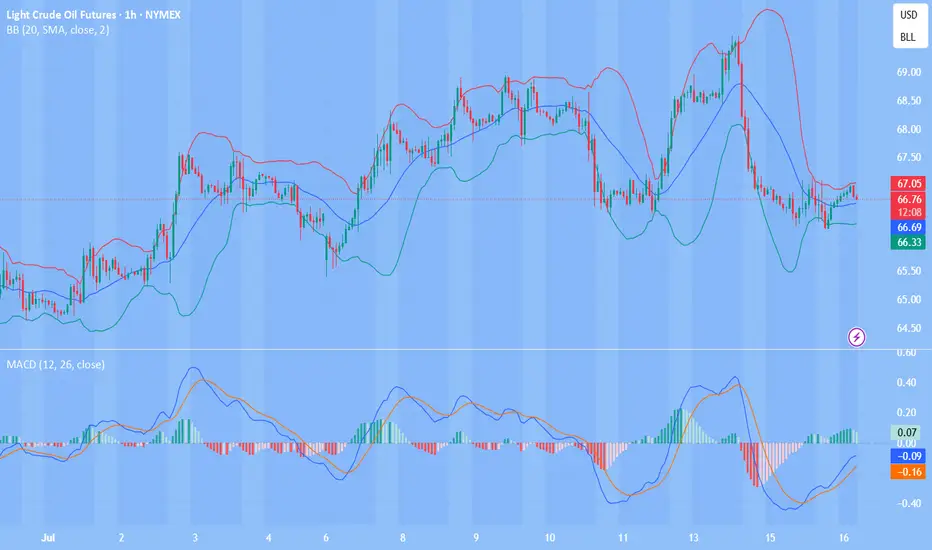
WTI(20250716)Today's AnalysisMarket news:
① The annual rate of the overall CPI in the United States in June rose to 2.7%, the highest since February, in line with market expectations, and the monthly rate was 0.3%, the highest since January, in line with market expectations; the annual rate of the core CPI rose to 2.9%, the highest since February, lower than the expected 3%, but slightly higher than 2.8% last month, and the monthly rate was 0.2%, lower than the market expectation of 0.3%.
② Interest rate futures still show that the Fed is unlikely to cut interest rates this month, but there is a high possibility of a 25 basis point cut in September.
③ Fed mouthpiece: The CPI report will not change the Fed's policy direction.
④ Trump: Consumer prices are low and the federal funds rate should be lowered immediately. The Fed should cut interest rates by 3 percentage points.
⑤ Fed Collins: The core inflation rate is expected to remain at about 3% by the end of the year, and the Fed should maintain active patience.
Technical analysis:
Today's buying and selling boundaries:
65.66
Support and resistance levels:
66.49
66.18
65.98
65.34
65.14
64.83
Trading strategy:
If the price breaks through 65.66, consider buying, the first target price is 65.98
If the price breaks through 65.34, consider selling, the first target price is 65.14
SPY/QQQ Plan Your Trade Special Update : BUCKLE UPThis video is a special update for all TradingView members. I felt I needed to share this information and present the case that I believe poses the most significant risk to your financial future - and it's happening right now.
Several weeks ago, I identified a very unique mirror setup in the SPY and kept an eye on how it was playing out. I needed to see confirmation of this setup before I could say it had any real likelihood of playing out as I expected.
As of today, I'm suggesting that we now have excellent confirmation that the US/Global markets are about to enter a deep consolidation phase, lasting through the rest of 2025 and possibly into 2026 and early 2027.
The interesting thing about this price pattern/structure is that it is almost exactly the same as the 2003-2007 structure, which I believe is the origin of this mirror setup. Almost down to the exact type of price bars/patterns I'm seeing.
Many of you are already aware that I've been calling for a critical low cycle in the SPY on July 18 for many months. What you may not realize is that the pattern is based on Weekly price data. The July 18 cycle low can have a span of +/- 1-3 weeks related to when and how the cycle low pattern plays out.
Watch this video. If you have any questions, message me or comment.
I'm still here, doing my best to identify and unlock the secrets of price action and to help as many traders as I can.
Price is the Ultimate Indicator.
Get some.
#trading #research #investing #tradingalgos #tradingsignals #cycles #fibonacci #elliotwave #modelingsystems #stocks #bitcoin #btcusd #cryptos #spy #gold #nq #investing #trading #spytrading #spymarket #tradingmarket #stockmarket #silver

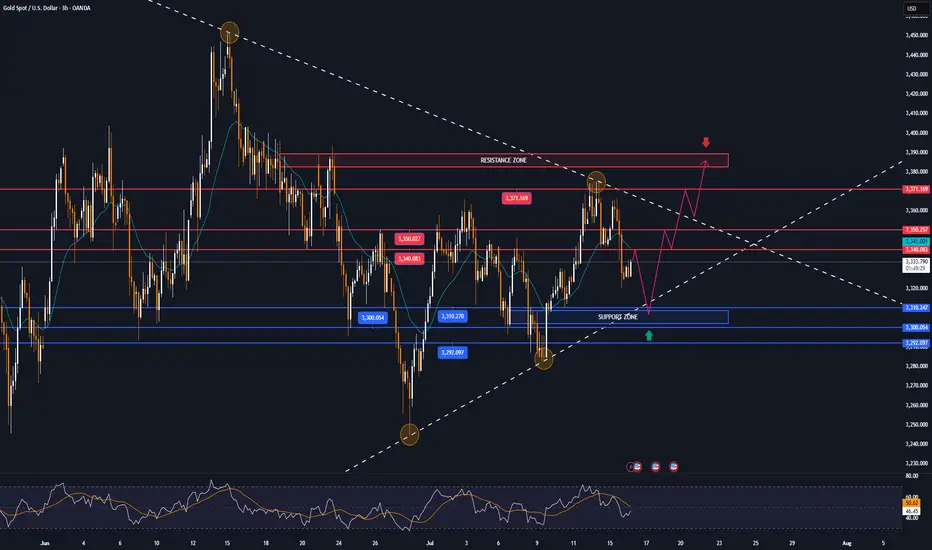
CPI triggers sell-off, 3330 can be short-term long📰 News information:
1. Focus on tomorrow's CPI data
2. Bowman's speech at the Federal Reserve
3. Tariff information outflows and countries' responses to tariff issues
📈 Technical Analysis:
The short-term trend flag pattern has been formed, and our short-selling strategy perfectly hits the TP. According to current news, Trump has once again urged the Federal Reserve to cut interest rates. While there is almost no possibility of a rate cut this month, there is a high probability that a 25 basis point rate cut will be completed in September, which is also in line with our previous prediction of market trends.
The big negative line in 4H pierced the middle Bollinger band. Although the CPI data is bullish, it has little impact based on the announced value. Market expectations have been digested in advance, so there is no room for a big drop. The upper points still focus on the short-term resistance of 3355-3365. If it rebounds to this area first in the short term, you can consider shorting again. Focus on the strong support of 3330 below. As long as the retracement entity does not fall below 3330, gold will rise again and touch the resistance line of 3375-3385.
🎯 Trading Points:
BUY 3335-3325
TP 3355-3365
In addition to investment, life also includes poetry, distant places, and Allen. Facing the market is actually facing yourself, correcting your shortcomings, facing your mistakes, and exercising strict self-discipline. I share free trading strategies and analysis ideas every day for reference by brothers. I hope my analysis can help you.
OANDA:XAUUSD PEPPERSTONE:XAUUSD FOREXCOM:XAUUSD FX:XAUUSD TVC:GOLD FXOPEN:XAUUSD
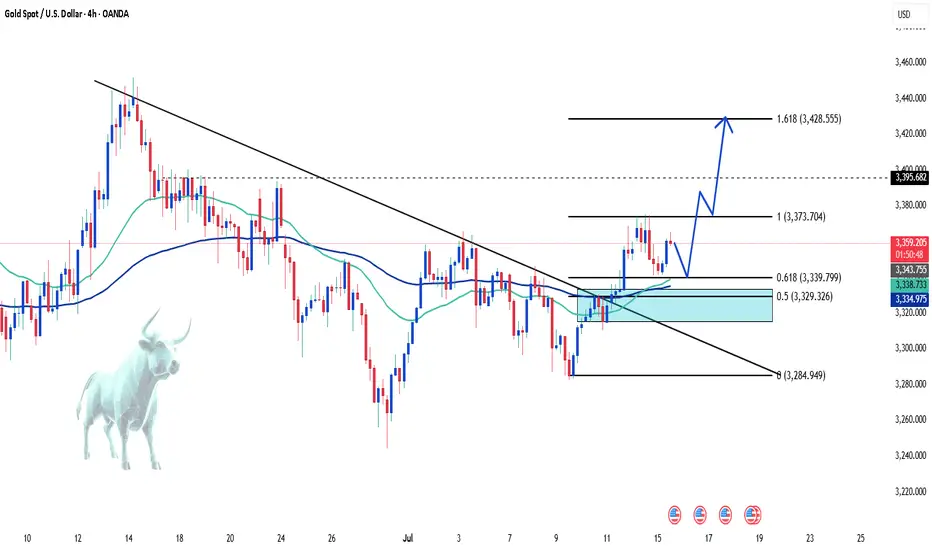
XAU/USD: Technical and News Signals Align for a Bullish Move💬 "When technicals and news align, traders can't ignore it."
Gold (XAU/USD) is at a critical juncture where both technical analysis and macroeconomic news are showing clear bullish signals. If you're waiting for a breakout, this might be the moment!
📊 Key Technical Analysis:
Gold bounced from a strong support zone at 3,339 – 3,329 (Fibo 0.618 & 0.5), confirming buying pressure.
EMA 34 crosses above EMA 89, signaling a potential trend reversal.
Breakout from the downtrend line opens up a target of 3,428 (Fibo extension 1.618).
Nearest resistance: 3,395 – if broken, a strong rally is likely.
🌐 Macroeconomic News Supporting the Bullish Trend:
The Fed may cut rates earlier than expected – USD weakens, benefiting gold.
Geopolitical tensions and financial instability in Europe increase demand for safe-haven assets.
US inflation cooling – market anticipates looser monetary policy.
Personal View:
If price breaks 3,395 with strong volume → long position, targeting 3,4xx.
Be cautious around resistance zones – short-term profit-taking could occur.
What do you think?
👉 Leave a comment, share your perspective or strategy – let’s ride the market wave together!
Gold is Setting up for another moveLooking for price to make some impulsive moves before we get active. Looking like they are trying to establish a low for the week before they go full on bullish. waiting for them to find that bottom.

GOLD LONG FROM RISING SUPPORT|
✅GOLD is trading in an uptrend
Which makes me bullish biased
And the price is retesting the rising support
Thus, a rebound and a move up is expected
With the target of retesting the level above at 3,350$
LONG🚀
✅Like and subscribe to never miss a new idea!✅
Disclosure: I am part of Trade Nation's Influencer program and receive a monthly fee for using their TradingView charts in my analysis.

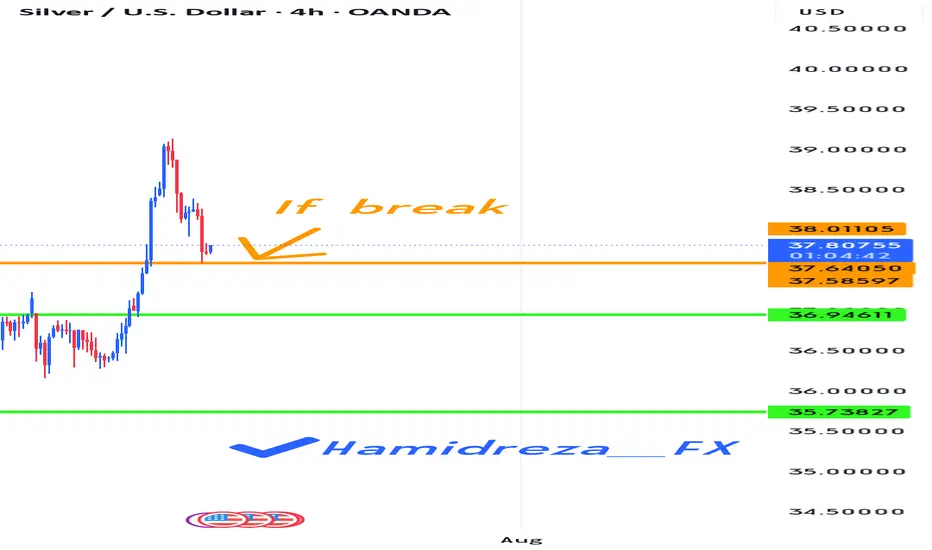
Is it time for a correction for silver?
Hi my dears
It seems that silver, like gold, should spend a few months in a resting phase. Of course, this is a guess. There is a condition on the chart that, if it happens, we should probably see the conditions shown on the chart happen.
I would be happy to hear your opinion.
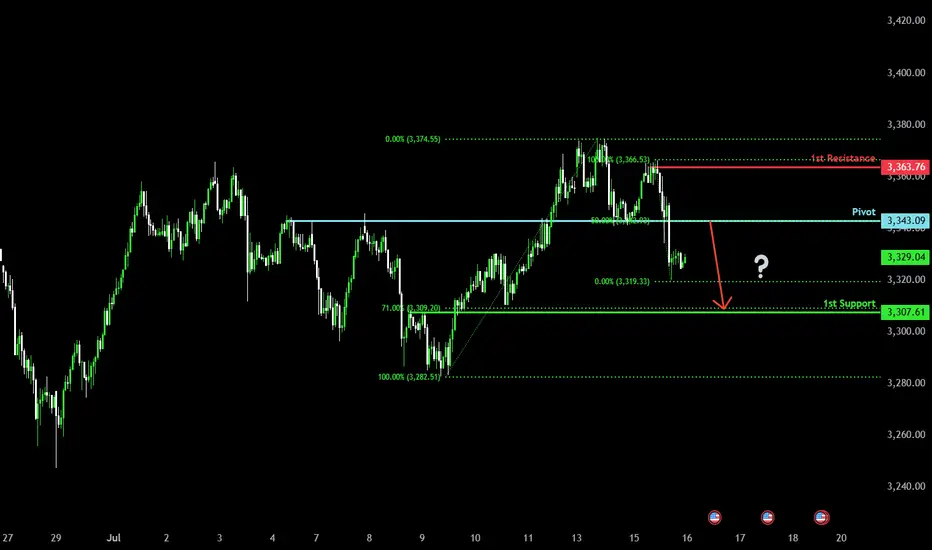
Major resistance ahead?The Gold (XAU/USD) is rising towards the pivot and could reverse to the overlap support.
Pivot: 3,343.09
1st Support: 3,307.61
1st Resistance: 3,363.76
Risk Warning:
Trading Forex and CFDs carries a high level of risk to your capital and you should only trade with money you can afford to lose. Trading Forex and CFDs may not be suitable for all investors, so please ensure that you fully understand the risks involved and seek independent advice if necessary.
Disclaimer:
The above opinions given constitute general market commentary, and do not constitute the opinion or advice of IC Markets or any form of personal or investment advice.
Any opinions, news, research, analyses, prices, other information, or links to third-party sites contained on this website are provided on an "as-is" basis, are intended only to be informative, is not an advice nor a recommendation, nor research, or a record of our trading prices, or an offer of, or solicitation for a transaction in any financial instrument and thus should not be treated as such. The information provided does not involve any specific investment objectives, financial situation and needs of any specific person who may receive it. Please be aware, that past performance is not a reliable indicator of future performance and/or results. Past Performance or Forward-looking scenarios based upon the reasonable beliefs of the third-party provider are not a guarantee of future performance. Actual results may differ materially from those anticipated in forward-looking or past performance statements. IC Markets makes no representation or warranty and assumes no liability as to the accuracy or completeness of the information provided, nor any loss arising from any investment based on a recommendation, forecast or any information supplied by any third-party.
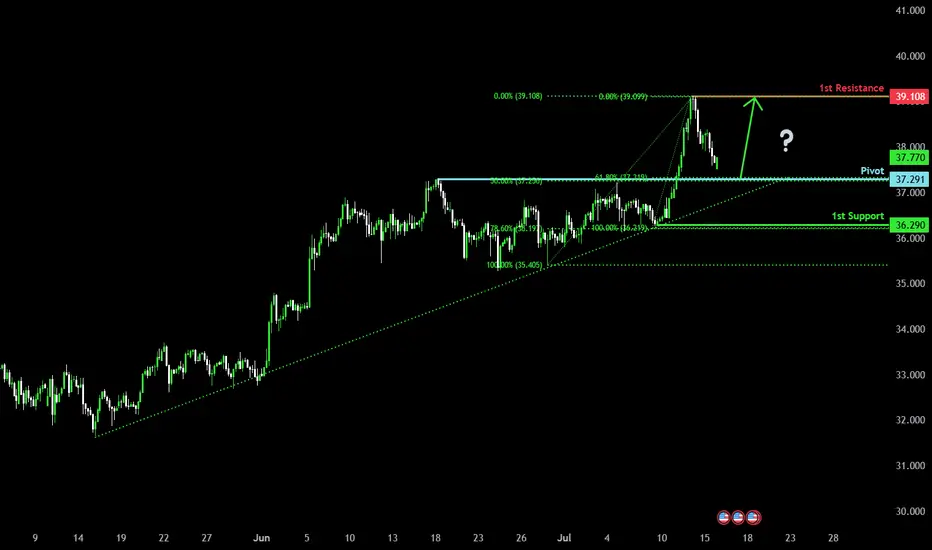
Falling towards the pullback support?The Silver (XAG/USD) is falling towards the pivot which acts as a pullback support and could bounce to the 1st resistance which is a pullback resistance.
Pivot: 37.29
1st Support: 36.29
1st Resistance: 39.10
Risk Warning:
Trading Forex and CFDs carries a high level of risk to your capital and you should only trade with money you can afford to lose. Trading Forex and CFDs may not be suitable for all investors, so please ensure that you fully understand the risks involved and seek independent advice if necessary.
Disclaimer:
The above opinions given constitute general market commentary, and do not constitute the opinion or advice of IC Markets or any form of personal or investment advice.
Any opinions, news, research, analyses, prices, other information, or links to third-party sites contained on this website are provided on an "as-is" basis, are intended only to be informative, is not an advice nor a recommendation, nor research, or a record of our trading prices, or an offer of, or solicitation for a transaction in any financial instrument and thus should not be treated as such. The information provided does not involve any specific investment objectives, financial situation and needs of any specific person who may receive it. Please be aware, that past performance is not a reliable indicator of future performance and/or results. Past Performance or Forward-looking scenarios based upon the reasonable beliefs of the third-party provider are not a guarantee of future performance. Actual results may differ materially from those anticipated in forward-looking or past performance statements. IC Markets makes no representation or warranty and assumes no liability as to the accuracy or completeness of the information provided, nor any loss arising from any investment based on a recommendation, forecast or any information supplied by any third-party.
XAUUSD – M15 Buy Setup⚡️XAUUSD – M15 Buy Setup
We’re back to business at a key decision point! Here’s what makes this a compelling opportunity:
📍Buy Setup on M15:
1️⃣ Price tapped into a strong support zone around 3333 – a level with proven reaction history
2️⃣ Third touch of the descending channel – possible breakout setup / bullish flag on HTF
3️⃣ A strong bullish engulfing candle closed above the previous daily close, showing buyer strength
4️⃣ Supported by the H4 MA zone acting as dynamic demand
🔥 Everything aligns technically for a high-probability bounce – but remember:
Strong setup ≠ guaranteed outcome.
We trade probabilities, not certainties.
🚀 Go for it guys... but manage your risk like a pro!
#XAUUSD #Gold #BuySetup #PriceAction #ChannelBreakout #SmartMoney #ChartDesigner #MJTrading #Forex #TradeIdea
