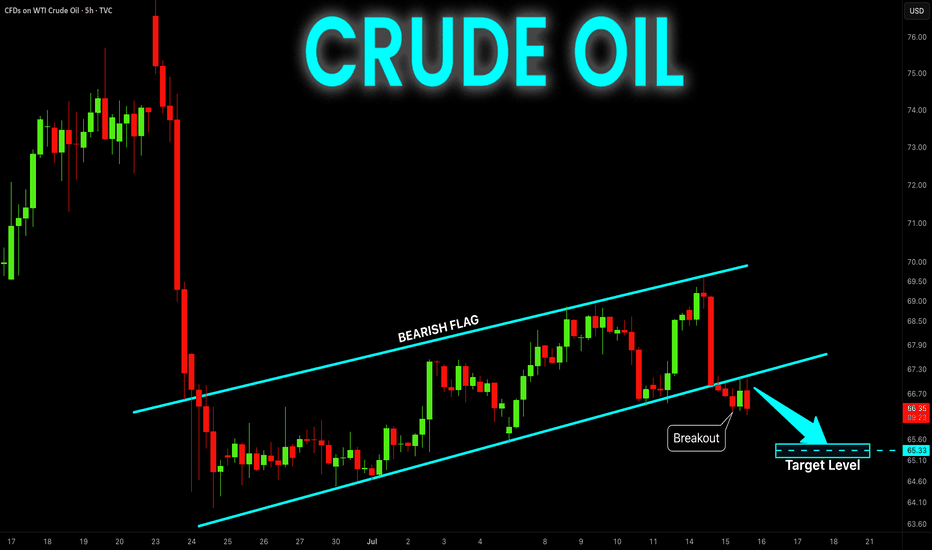
USOIL Will Go Higher From Support! Buy!
Take a look at our analysis for USOIL.
Time Frame: 9h
Current Trend: Bullish
Sentiment: Oversold (based on 7-period RSI)
Forecast: Bullish
The market is on a crucial zone of demand 67.18.
The oversold market condition in a combination with key structure gives us a relatively strong bullish signal with goal 70.05 level.
P.S
Please, note that an oversold/overbought condition can last for a long time, and therefore being oversold/overbought doesn't mean a price rally will come soon, or at all.
Like and subscribe and comment my ideas if you enjoy them!
Commodities
GOLD - Price can exit of triangle and then drop to support levelHi guys, this is my overview for XAUUSD, feel free to check it and write your feedback in comments👊
A few moments ago, the price entered a wedge, bounced from the support line, and rose to the resistance area.
Also, price breaking $2845 level and then it turned around and made correction from resistance area to support line.
Then Gold rose to resistance area again, where it some time traded and then dropped to support level.
Thereby price broke $2935 level and exited from a wedge, after which it started to trades inside a triangle.
In this pattern, price made a gap and then rose to resistance line of the triangle, after which made correction.
Now, I think that Gold can exit from a triangle and then start to decline to $2860
If this post is useful to you, you can support me with like/boost and advice in comments❤️
Soybean Futures Surge: ZS, ZL, and ZM Align for a Bullish MoveI. Introduction
Soybean futures are showing a potentially strong upcoming bullish momentum, with ZS (Soybean Futures), ZL (Soybean Oil Futures), and ZM (Soybean Meal Futures) aligning in favor of an upward move. The recent introduction of Micro Ag Futures by CME Group has further enhanced trading opportunities by allowing traders to manage risk more effectively while engaging with longer-term setups such as weekly timeframes.
Currently, all three soybean-related markets are displaying bullish candlestick patterns, accompanied by strengthening demand indicators. With RSI confirming upward momentum without entering overbought territory, traders are eyeing potential opportunities. Among the three, ZM appears to be the one which will potentially provide the greatest strength, showing resilience in price action and a favorable technical setup for a high reward-to-risk trade.
II. Technical Analysis of Soybean Markets
A closer look at the price action in ZS, ZL, and ZM reveals a confluence of bullish factors:
o Candlestick Patterns:
All three markets have printed bullish weekly candlestick formations, signaling increased buying interest.
o RSI Trends:
RSI is in an uptrend across all three contracts, reinforcing the bullish outlook.
Importantly, none of them are currently in overbought conditions, suggesting further upside potential.
o Volume Considerations:
Higher volume on up moves and decreasing volume on down-moves adds credibility to the bullish bias.
III. Comparative Price Action Analysis
While all three soybean-related markets are trending higher, their relative strength varies. By comparing recent weekly price action:
o ZM (Soybean Meal Futures) stands out as the one which will potentially become the strongest performer.
Last week, ZM closed above its prior weekly open, marking a +1.40% weekly gain.
RSI is not only trending higher but is also above its average, a sign of potential continued strength.
o ZS and ZL confirm bullishness but lag slightly in relative strength when compared to ZM.
This comparative analysis suggests that while all three markets are bullish, ZM presents the most compelling trade setup in terms of technical confirmation and momentum.
IV. Trade Setup & Forward-Looking Trade Idea
Given the strong technical signals, the trade idea focuses on ZM (Soybean Meal Futures) as the primary candidate.
Proposed Trade Plan:
Direction: Long (Buy)
Entry: Buy above last week’s high at 307.6
Target: UFO resistance at 352.0
Stop Loss: Below entry at approximately 292.8 (for a 3:1 reward-to-risk ratio)
Reward-to-Risk Ratio: 3:1
Additionally, with the introduction of Micro Ag Futures, traders can now fine-tune position sizing, making it easier to manage risk effectively on longer-term charts like the weekly timeframe. Given the novelty of such micro contracts, here is a CME resource that could be useful to understand their characteristics such as contracts specs .
V. Risk Management & Trade Discipline
Executing a trade plan is just one part of the equation—risk management is equally critical, especially when trading larger timeframes like the weekly chart. Here are key considerations for managing risk effectively:
1. Importance of Precise Entry and Exit Levels
Entering above last week’s high (307.6) ensures confirmation of bullish momentum before taking a position.
The target at 352.0 (UFO resistance) provides a well-defined profit objective, avoiding speculation.
A stop-loss at 292.8 is strategically placed to maintain a 3:1 reward-to-risk ratio, ensuring that potential losses remain controlled.
2. The Role of Stop Loss Orders & Hedging
A stop-loss prevents excessive drawdowns in case the market moves against the position.
Traders can also hedge using Micro Ag Futures to offset exposure while maintaining a bullish bias on the broader trend.
3. Avoiding Undefined Risk Exposure
The Micro Ag Futures contracts enable traders to scale into or out of positions without significantly increasing risk.
Position sizing should be adjusted based on account risk tolerance, ensuring no single trade overly impacts capital.
4. Adjusting for Market Volatility
Monitoring volatility using ATR (Average True Range) or other risk-adjusted indicators helps in adjusting stop-loss placement.
If volatility increases, a wider stop may be needed, but it should still align with a strong reward-to-risk structure.
Proper risk management ensures that trades are executed with discipline, preventing emotional decision-making and maximizing long-term trading consistency.
VI. Conclusion & Disclaimers
Soybean futures are showing bullishness, with ZS, ZL, and ZM aligning in favor of further upside. However, among them, ZM (Soybean Meal Futures) potentially exhibits the most reliable momentum, making it the prime candidate for a high-probability trade setup.
With bullish candlestick patterns, RSI trends confirming momentum, and volume supporting the move, traders have an opportunity to capitalize on this momentum while managing risk effectively using Micro Ag Futures.
When charting futures, the data provided could be delayed. Traders working with the ticker symbols discussed in this idea may prefer to use CME Group real-time data plan on TradingView: www.tradingview.com - This consideration is particularly important for shorter-term traders, whereas it may be less critical for those focused on longer-term trading strategies.
General Disclaimer:
The trade ideas presented herein are solely for illustrative purposes forming a part of a case study intended to demonstrate key principles in risk management within the context of the specific market scenarios discussed. These ideas are not to be interpreted as investment recommendations or financial advice. They do not endorse or promote any specific trading strategies, financial products, or services. The information provided is based on data believed to be reliable; however, its accuracy or completeness cannot be guaranteed. Trading in financial markets involves risks, including the potential loss of principal. Each individual should conduct their own research and consult with professional financial advisors before making any investment decisions. The author or publisher of this content bears no responsibility for any actions taken based on the information provided or for any resultant financial or other losses.
XNG/USD Analysis: Natural Gas Price Hits Over Two-Year HighXNG/USD Analysis: Natural Gas Price Hits Over Two-Year High
On 27 January, while analysing the natural gas chart, we noted that price fluctuations:
→ Were forming an ascending channel.
→ Identified $3.700 as a key resistance level.
As shown on the XNG/USD chart, bears had control in late January but failed to maintain their grip. Since then:
→ Natural gas prices have continued their upward trajectory.
→ The $3.700 level was breached, becoming part of a resistance zone with an upper boundary at $3.800, which later acted as support (as indicated by the arrow).
As a result, today, natural gas prices have surged to $4.800/MMBtu—the highest level since late December 2022.
Bullish Factors Driving the Market (According to Trading Economics):
→ Weather Conditions – A cold spell in the U.S. has increased demand for heating gas. Meteorologists predict a shift towards milder temperatures across 48 states in March.
→ LNG Exports – U.S. liquefied natural gas (LNG) exports have hit a record high of 15.6 billion cubic feet per day under the new administration. Meanwhile, trade uncertainties, including a potential slowdown in natural gas flows from Canada to the U.S., are raising concerns among market participants.
Technical Outlook for XNG/USD:
→ The market remains in an uptrend (indicated by blue lines), with the price now exceeding its upper boundary.
→ The RSI indicator is approaching overbought levels and may form a bearish divergence.
These observations suggest that the price is in a vulnerable position for a pullback. If this scenario unfolds, a test of the $4.250 area cannot be ruled out.
Trade on TradingView with FXOpen. Consider opening an account and access over 700 markets with tight spreads from 0.0 pips and low commissions from $1.50 per lot.
This article represents the opinion of the Companies operating under the FXOpen brand only. It is not to be construed as an offer, solicitation, or recommendation with respect to products and services provided by the Companies operating under the FXOpen brand, nor is it to be considered financial advice.
XAUUSD: 10/3 Today's Market Analysis and StrategyGold technical analysis
Daily chart resistance 2957, support below 2892
Four-hour chart resistance 2930, support below 2887
One-hour chart resistance 2930, support below 2897
Gold news analysis: Gold prices have fluctuated at high levels for three consecutive trading days, but the weekly line is still up 1.85%, helped by safe-haven inflows and the US employment report showed that job growth in February was lower than expected, suggesting that the Federal Reserve is expected to cut interest rates this year. In addition, the volatile tariff policy of US President Trump has also increased uncertainty. The US dollar index fell to a four-month low last week and will record its biggest weekly drop since November 2022, making gold priced in US dollars cheaper for foreign buyers. The market's focus is on the upcoming Federal Reserve meeting. The Fed's forecasts and NFP data will be key drivers. In addition, inflation reports and retail sales data will also provide more clues to the market. Although the Fed may remain on the sidelines, there is still uncertainty about the impact of tariff policies on the dollar and the economy.
Gold operation suggestions: Last Friday, the overall technical side of gold did not show a breakthrough in the long and short directions. Instead, under the influence of the positive NFP employment data, the price rose again to 2930 and then fell back, and the overall pattern remained volatile.
From the current trend analysis, we focus on the support of 2897 in the one-hour chart and 2887 in the four-hour chart below, and the resistance of 2930-35 above. In terms of operation, we are still waiting for a decline to buy. Short-term trading can be around this range to sell high and buy low. Once a breakthrough occurs, we need to follow the trend and wait patiently for key points to enter the market.
BUY:2892near SL:2887
SELL:2930near SL:2935
SELL:2885near SL:2890
GOLD BEST PLACE TO BUY FROM|LONG
Hello, Friends!
GOLD is making a bearish pullback on the 1H TF and is nearing the support line below while we are generally bullish biased on the pair due to our previous 1W candle analysis, thus making a trend-following long a good option for us with the target being the 2,920.193 level.
✅LIKE AND COMMENT MY IDEAS✅
Donald Trump is supporting gold prices more than any factor FedWorld gold prices increased in the context of the USD's decline. Recorded at 8:45 a.m. on March 10, the US Dollar Index, which measures the greenback's fluctuations against six major currencies, was at 103.632 points (down 0.17%).
This week, market sentiment has changed significantly compared to last week, especially from the Wall Street experts. In the previous survey, only 21% of experts predicted that gold prices would increase, while 64% said that prices would decrease.
However, this week, the percentage of experts expecting gold to increase jumped to 67%, while only 5% predicted a decrease - a significant change reflecting a reversal in analysts' views.
The percentage of investors predicting gold prices to rise has increased from 45% to 67%, while the number of those expecting prices to fall has decreased from 28% to 18%.
Notably, the number of participants in this week's survey reached 251 people - the highest level in 2025, showing greater investor interest in the gold market.
Jim Wyckoff - senior analyst at Kitco - affirmed that gold prices will continue to maintain an upward trend thanks to increasing geopolitical instability. "The gold price trend remains steady, thanks to positive technical indicators and increasing geopolitical uncertainties, especially the impact of the US President Donald Trump's administration."
XAU/USD 4H Analysis: Key Support, Resistance & Breakout TargetsKey Levels Identified:
Support Zone (~2,875-2,885) 🟣
This is a strong area where price previously bounced.
If price falls below this level, it could drop further toward the next support.
Resistance Zone (~2,915-2,925) 🟣
Price is currently consolidating around this level.
A breakout above resistance could push the price toward the target.
Target (~2,950) 🎯
If the price breaks above resistance, the next key level is around 2,950.
Potential Scenarios:
📈 Bullish Scenario:
If price breaks above resistance, expect an upward move toward the target (2,950).
Confirmation would come with strong volume and bullish candlestick patterns.
📉 Bearish Scenario:
If price fails to hold above support, a drop toward 2,825-2,835 is possible.
A strong bearish candle closing below support would confirm this move.
Current Trend:
The price has been moving in a sideways consolidation between support and resistance.
Watch for a breakout in either direction for the next big move.
Gold H1 | Falling toward an overlap supportGold (XAU/USD) is falling towards an overlap support and could potentially bounce off this level to climb higher.
Buy entry is at 2,893.52 which is an overlap support that aligns with the 38.2% Fibonacci retracement.
Stop loss is at 2,875.00 which is a level that lies underneath a swing-low support and the 50.0% Fibonacci retracement.
Take profit is at 2,927.81 which is an overlap resistance that aligns with the 78.6% Fibonacci retracement.
High Risk Investment Warning
Trading Forex/CFDs on margin carries a high level of risk and may not be suitable for all investors. Leverage can work against you.
Stratos Markets Limited (www.fxcm.com):
CFDs are complex instruments and come with a high risk of losing money rapidly due to leverage. 63% of retail investor accounts lose money when trading CFDs with this provider. You should consider whether you understand how CFDs work and whether you can afford to take the high risk of losing your money.
Stratos Europe Ltd (www.fxcm.com):
CFDs are complex instruments and come with a high risk of losing money rapidly due to leverage. 63% of retail investor accounts lose money when trading CFDs with this provider. You should consider whether you understand how CFDs work and whether you can afford to take the high risk of losing your money.
Stratos Trading Pty. Limited (www.fxcm.com):
Trading FX/CFDs carries significant risks. FXCM AU (AFSL 309763), please read the Financial Services Guide, Product Disclosure Statement, Target Market Determination and Terms of Business at www.fxcm.com
Stratos Global LLC (www.fxcm.com):
Losses can exceed deposits.
Please be advised that the information presented on TradingView is provided to FXCM (‘Company’, ‘we’) by a third-party provider (‘TFA Global Pte Ltd’). Please be reminded that you are solely responsible for the trading decisions on your account. There is a very high degree of risk involved in trading. Any information and/or content is intended entirely for research, educational and informational purposes only and does not constitute investment or consultation advice or investment strategy. The information is not tailored to the investment needs of any specific person and therefore does not involve a consideration of any of the investment objectives, financial situation or needs of any viewer that may receive it. Kindly also note that past performance is not a reliable indicator of future results. Actual results may differ materially from those anticipated in forward-looking or past performance statements. We assume no liability as to the accuracy or completeness of any of the information and/or content provided herein and the Company cannot be held responsible for any omission, mistake nor for any loss or damage including without limitation to any loss of profit which may arise from reliance on any information supplied by TFA Global Pte Ltd.
The speaker(s) is neither an employee, agent nor representative of FXCM and is therefore acting independently. The opinions given are their own, constitute general market commentary, and do not constitute the opinion or advice of FXCM or any form of personal or investment advice. FXCM neither endorses nor guarantees offerings of third-party speakers, nor is FXCM responsible for the content, veracity or opinions of third-party speakers, presenters or participants.
WTI Oil H4 | Rising into overlap resistanceWTI oil (USOIL) is rising towards an overlap resistance and could potentially reverse off this level to drop lower.
Sell entry is at 68.46 which is an overlap resistance that aligns with the 38.2% Fibonacci retracement level.
Stop loss is at 70.70 which is a level that sits above the 61.8% Fibonacci retracement and a multi-swing-high resistance.
Take profit is at 65.20 which is a swing-low support.
High Risk Investment Warning
Trading Forex/CFDs on margin carries a high level of risk and may not be suitable for all investors. Leverage can work against you.
Stratos Markets Limited (www.fxcm.com):
CFDs are complex instruments and come with a high risk of losing money rapidly due to leverage. 63% of retail investor accounts lose money when trading CFDs with this provider. You should consider whether you understand how CFDs work and whether you can afford to take the high risk of losing your money.
Stratos Europe Ltd (www.fxcm.com):
CFDs are complex instruments and come with a high risk of losing money rapidly due to leverage. 63% of retail investor accounts lose money when trading CFDs with this provider. You should consider whether you understand how CFDs work and whether you can afford to take the high risk of losing your money.
Stratos Trading Pty. Limited (www.fxcm.com):
Trading FX/CFDs carries significant risks. FXCM AU (AFSL 309763), please read the Financial Services Guide, Product Disclosure Statement, Target Market Determination and Terms of Business at www.fxcm.com
Stratos Global LLC (www.fxcm.com):
Losses can exceed deposits.
Please be advised that the information presented on TradingView is provided to FXCM (‘Company’, ‘we’) by a third-party provider (‘TFA Global Pte Ltd’). Please be reminded that you are solely responsible for the trading decisions on your account. There is a very high degree of risk involved in trading. Any information and/or content is intended entirely for research, educational and informational purposes only and does not constitute investment or consultation advice or investment strategy. The information is not tailored to the investment needs of any specific person and therefore does not involve a consideration of any of the investment objectives, financial situation or needs of any viewer that may receive it. Kindly also note that past performance is not a reliable indicator of future results. Actual results may differ materially from those anticipated in forward-looking or past performance statements. We assume no liability as to the accuracy or completeness of any of the information and/or content provided herein and the Company cannot be held responsible for any omission, mistake nor for any loss or damage including without limitation to any loss of profit which may arise from reliance on any information supplied by TFA Global Pte Ltd.
The speaker(s) is neither an employee, agent nor representative of FXCM and is therefore acting independently. The opinions given are their own, constitute general market commentary, and do not constitute the opinion or advice of FXCM or any form of personal or investment advice. FXCM neither endorses nor guarantees offerings of third-party speakers, nor is FXCM responsible for the content, veracity or opinions of third-party speakers, presenters or participants.
Gold is expected to break out of the current rangeThe daily chart shows that the international gold price has fallen into a high-level shock consolidation trend after rebounding from a one-month low. The current price is repeatedly sawing in the 2900-2930 range, and the market's long and short forces tend to be balanced. Technical indicators show subtle differentiation: the 5-day moving average and the 10-day moving average form a dead cross and then turn upward, suggesting that there are signs of stabilization in the short term; the momentum of the MACD indicator candle chart continues to shrink, but the dead cross rhythm has slowed down; the KDJ indicator forms a low-level golden cross, and the RSI indicator rebounds from the oversold area, indicating that market sentiment is turning from pessimism to cautious optimism. However, the upper 2930 area gathers multiple pressures-this position is both the rebound high last Friday and the key resistance level of the previous failed breakthrough, suppressing the further upward space of gold prices.
In terms of fundamentals, the US non-farm payrolls data in February was unexpectedly lower than expected, reinforcing the market's expectations for the Fed to cut interest rates this year. Historical experience shows that interest rate cut cycles are often beneficial to interest-free assets such as gold, which provides medium- and long-term support for gold prices. But in the short term, the market still needs to wait for more economic data to verify the Fed's policy stance. During this period, gold prices are more susceptible to fluctuations in the US dollar index and changes in US bond yields.
Focus on the key support level of 2900 above $2930 as the primary pressure target. If US economic data continues to weaken, gold prices are expected to break through the current range of fluctuations and retest last year's highs. Operational advice: Go long near 2905-2910, target 2915-2920.
GC - Golden Rocketship To The U-MLHWe got on the Rocket-Ship earlier and took profit.
If you're still in with a position, or if you can manage to get in with a decent Risk/Reward, you may want to aim for the U-MLH.
The Stars look good and profits are twinkling §8-)
If the 1/4 line is cracked, we will see a follow-through.
GOLD falls slightly as Dollar recovers, news, main trendsOANDA:XAUUSD has just dropped to around $2,912/ounce, down nearly $10 from the intraday high of $2,918/ounce reached earlier in the session.
The recovery of the US Dollar can be seen as the current pressure causing gold prices to slightly decline from the intraday high.
Overview of data and event news
The Labor Department report showed the U.S. economy added 151,000 jobs in February, compared with economists polled by Reuters who expected a gain of 160,000, and the unemployment rate was 4.1%, compared with expectations of 4%.
Federal Reserve Chairman Jerome Powell said early Friday that the Fed would take a cautious approach to easing monetary policy, adding that the economy “remains in good shape.”
While gold is a hedge against inflation, rising interest rates could reduce the appeal of non-yielding bullion.
The market is now expecting the Fed to continue cutting interest rates starting in June, with a total of 76 basis points of interest rate cuts over the rest of the year.
Market attention is focused on the upcoming Federal Reserve meeting. In addition, inflation reports and retail sales data will also provide additional guidance for market trends in general and the gold market in particular.
On the daily chart, gold is generally still in the accumulation phase with the positioning conditions tilted towards the upside.
The short-term trend is highlighted by the price channel, while the nearest support is the EMA21 and the technical level of 2,900 USD. At the raw price point of 2,900 USD, it also created significant price increases in the last 2 days of the weekend.
The relative strength index is facing some resistance from the 61 level noted in the previous issue, where once the RSI breaks this level it will continue to head towards the oversold zone which is a signal that will facilitate the possibility of gold price increasing in terms of momentum.
In the coming time, as long as gold remains above 2,900 USD, it will still tend to be bullish in the short term, and the target continues to be the all-time high or higher.
The notable technical price points will be listed as follows.
Support: 2,900 – 2,880 – 2,868 USD
Resistance: 2,929 – 2,942 – 2,956 USD
SELL XAUUSD PRICE 2956 - 2954⚡️
↠↠ Stoploss 2960
→Take Profit 1 2948
↨
→Take Profit 2 2942
BUY XAUUSD PRICE 2877 - 2879⚡️
↠↠ Stoploss 2873
→Take Profit 1 2885
↨
→Take Profit 2 2891
Gold maintains box oscillation structureSpot gold fluctuated in a narrow range in early Asian trading on Monday, currently trading around $2,911 per ounce. Gold prices had fluctuated at high levels for three consecutive trading days, but still rose 1.85% on a weekly basis, helped by safe-haven inflows and a U.S. jobs report showing lower-than-expected job growth in February, suggesting that the Federal Reserve is expected to cut interest rates this year. In addition, the volatile tariff policy of U.S. President Trump has also increased market uncertainty.
Federal Reserve Chairman Powell said earlier on Friday that the Fed will be cautious about easing monetary policy, adding that the economy is "still in good shape" at the moment.
The easing of geopolitical tensions also limited the rise in gold prices, with some progress in a possible ceasefire agreement between Ukraine and Russia. In the Middle East, U.S. President Trump continued to pressure Hamas to release hostages. Meanwhile, according to the World Gold Council, the People's Bank of China continued to buy gold. The People's Bank of China increased its holdings by 10 tons of gold in the first two months of 2025. However, the largest buyer was the Polish central bank, which added 29 tons of gold reserves, the largest purchase since it bought 95 tons of gold in June 2019.
Overall, the rise in gold prices last week once again highlighted its importance as a safe-haven asset. Although the market may face consolidation in the short term, geopolitical risks, inflation concerns and uncertainty about the Fed's policy will continue to support gold demand. The focus of the market is on the upcoming Fed meeting. In addition, inflation reports and retail sales data will also provide more clues to the market.
Gold maintains a wide range of shocks. The weekly line continues to maintain an upward trend structure, and the running price retreats above the MA7 daily moving average and closes higher. The daily chart continues to be cross-shaped. Gold rose sharply above the 2930 mark in the late trading and then formed a high-rise fall. It continues to maintain a wide range of shocks at a high level, and the long and short market will not continue to consolidate.
At present, the MA10/7 daily moving average of the daily chart is at 2902, and the Bollinger Bands are gradually shrinking, with the upper rail at 2956 and the lower rail at 2867. The gold price in the Asian session is at the Bollinger Band middle rail price at 2912. The short-term four-hour chart also shows that the Bollinger Bands continue to close the upper rail at 2927 and the lower rail at 2900. The RSI indicator is in the middle axis 50 value consolidation, and the K-line pattern is alternating between long and short cycles.
The Asian session gold price continues the rebound trend of the NFP market. There are only two operating points in the Asian session. One is to wait for the gold price to continue to rise and reach the pressure of the 2930 range to sell, and the other is to wait for the gold price to adjust and reach the 2900 range to buy. However, the rebound is expected to reach the pressure of the upper 2930 line first, so the opportunity for us to go short is greater than that for going long. At present, the gold price is at the middle level of the range and needs to continue to wait!
Key points:
First support: 2903, second support: 2892, third support: 2882
First resistance: 2920, second resistance: 2928, third resistance: 2940
Operation ideas:
Buy: 2903-2905, SL: 2894, TP: 2920-2930;
Sell: 2929-2931, SL: 2940, TP: 2910-2900;
Gold Intraday Expectations Long/BuyGold trading at 2904.xx when we were publishing the analysis.
Gold has challenged PDL 2894 moved below to 2892.xx and bounced sharply to 2905 by now. As per our readings we have 2 important levels today to watch, one is 2992 that is under the consideration that it may break down if gold remains below 2916 and fall towards 2877/2871 can open that can be considered a good buying range/level. On the upside we expect gold can challenge PDH at 2929.
Our analysis suggests fall around 2877/2871 is possible that can be bearish target and from where bounce to 2916/2929 is possible that our Main Goal/Target for now.
Trade as per your plan and if you like our idea do share your feedback.
XAU/USD (Gold) Trendline Breakout (10.03.2025)The XAU/USD Pair on the M30 timeframe presents a Potential Selling Opportunity due to a recent Formation of a Trendline Breakout Pattern. This suggests a shift in momentum towards the downside in the coming hours.
Possible Short Trade:
Entry: Consider Entering A Short Position around Trendline Of The Pattern.
Target Levels:
1st Support – 2877
2nd Support – 2860
🎁 Please hit the like button and
🎁 Leave a comment to support for My Post !
Your likes and comments are incredibly motivating and will encourage me to share more analysis with you.
Best Regards, KABHI_TA_TRADING
Thank you.
Gold has a strong bullish momentum, could it rise from here?The price haas bounced off the pivot and could potentially rise to the 1st resistance.
Pivot: 2,859.06
1st Support: 2,790.01
1st Resistance: 2,989.91
Risk Warning:
Trading Forex and CFDs carries a high level of risk to your capital and you should only trade with money you can afford to lose. Trading Forex and CFDs may not be suitable for all investors, so please ensure that you fully understand the risks involved and seek independent advice if necessary.
Disclaimer:
The above opinions given constitute general market commentary, and do not constitute the opinion or advice of IC Markets or any form of personal or investment advice.
Any opinions, news, research, analyses, prices, other information, or links to third-party sites contained on this website are provided on an "as-is" basis, are intended only to be informative, is not an advice nor a recommendation, nor research, or a record of our trading prices, or an offer of, or solicitation for a transaction in any financial instrument and thus should not be treated as such. The information provided does not involve any specific investment objectives, financial situation and needs of any specific person who may receive it. Please be aware, that past performance is not a reliable indicator of future performance and/or results. Past Performance or Forward-looking scenarios based upon the reasonable beliefs of the third-party provider are not a guarantee of future performance. Actual results may differ materially from those anticipated in forward-looking or past performance statements. IC Markets makes no representation or warranty and assumes no liability as to the accuracy or completeness of the information provided, nor any loss arising from any investment based on a recommendation, forecast or any information supplied by any third-party.
Weekly and Monday analysis for Nasdaq, Oil, and GoldNasdaq
The Nasdaq closed higher, forming a long lower wick as it rebounded. On continuous futures, the index bounced off the 60-week MA, while the daily chart shows a recovery after briefly dropping below the 240-day MA. Looking at the weekly chart, two weeks ago, a large bearish candle decisively broke below a key range, and last week, the Nasdaq failed to break above the 3-week MA, leading to further downside. This week, however, a rebound toward the 5-week MA near 21,050 remains possible.
On the daily chart, the Nasdaq successfully found support near 19,800, forming a potential range-bound structure. Although a technical target exists at the 60-day MA near 21,500, the downtrend remains strong, meaning that a full recovery may take time. Instead of an immediate rally, the Nasdaq may consolidate around the 240-day MA, making a range-trading strategy more effective.
On the 240-minute chart, the Nasdaq formed a bullish divergence, triggered a golden cross, and started to rebound. As long as price continues to base at the lows, further buying attempts may emerge, making chasing short positions risky. This week, traders should monitor Wednesday’s CPI report and Thursday’s PPI report, as both could increase market volatility.
Crude Oil
Crude oil closed higher, supported by potential sanctions on Russia. On the weekly chart, oil dropped to the 240-week MA before rebounding, but last week’s bearish close triggered a sell signal. Since this sell signal occurred near the zero line, further downside remains possible, making chasing long positions risky. A key upside level to watch is the 3-week MA at $68, while support is expected around the $66–67 range, where a short-term double-bottom formation could develop.
On the daily chart, if oil continues to rebound, traders should watch for resistance at $68, while stopping out below the $65 previous low remains essential. On the 240-minute chart, the MACD has formed a golden cross, with momentum gradually shifting higher. However, since the gap between the MACD and the zero line remains large, selling pressure could reemerge on rallies. Traders should focus on buying dips at strong support levels while keeping strict stop-loss management in place.
Gold
Gold closed lower, remaining within a range-bound market structure. The Non-Farm Payroll (NFP) report triggered significant volatility, but the daily MACD is now turning downward, increasing the risk of additional selling pressure.
On the weekly chart, gold is forming a long-term consolidation range. If this week’s candle closes lower, the weekly MACD may form a bearish crossover, increasing the likelihood of a negative divergence pattern. This makes chasing long positions riskier.
On the daily chart, despite short-term weakness, the MACD and signal line remain far from the zero line, meaning that intermittent rebound attempts are still possible. For now, the lower Bollinger Band serves as key support, reinforcing a range-bound strategy. On the 240-minute chart, $2,940 has become a strong resistance level, and a sell signal has been triggered. For now, traders should focus on selling into rallies while looking for buying opportunities at lower levels. If gold breaks above $2,940, a third wave of buying momentum could emerge, making it essential to adapt to market conditions dynamically. Gold is also likely to react to Wednesday’s CPI and Thursday’s PPI reports, increasing potential volatility.
U.S. market volatility is rising sharply, as seen in the VIX index, which surged above 22 last week. Using technical tools like VIX analysis, moving averages, and MACD strategies can help improve market navigation. Stay disciplined, manage risk carefully, and have a successful trading week! 🚀
If you like detailed this analysis and today's strategy, please follow me and give it a boost!
GOLD → The calm before the NFP torm! What’s next?OANDA:XAUUSD is currently trading within the 2926 - 2894 range, signaling a pause after its recent strong uptrend. If a false support breakdown occurs, the market could quickly revert, especially amid signs of a recovering USD.
However, a weaker dollar and expectations of a Federal Reserve policy shift toward easing continue to support gold demand. Despite the temporary suspension of Trump’s tariff measures, the precious metal remains in focus as a safe-haven asset.
Traders are now closely watching the NFP report, which could dictate the dollar’s future trajectory and influence Fed policy decisions. In the short term, attention will be on Initial Jobless Claims data, which may provide early signals about the U.S. labor market.
Technical Outlook
-Gold remains within the 2926 - 2894 range, potentially testing liquidity near the 2894 support zone.
-An unfilled fair value gap (FVG) below 2894 could lead to a brief dip before a rebound.
-Given the bullish long-term trend in gold and the ongoing dollar weakness, the probability of a price recovery remains high.
In this scenario, gold may fake out a breakdown, grab liquidity near support, and then resume its broader uptrend.
Best regards, Bentradegold!
GOLD | XAUUSD Weekly Market Forecast: Mar 10-14 In this video, we will analyze the GOLD Futures. We'll determine the bias for the upcoming week, and look for the best potential setups.
Gold has consolidated for the last half of the previous week. Trading in a ranging market is not recommended! But waiting until there is an obvious sweep of the high or low liquidity pools can give us an indication which side the market will break the consolidation. Patience and a watchful eye will allow us to take advantage of the momentous opportunity.
Enjoy!
May profits be upon you.
Leave any questions or comments in the comment section.
I appreciate any feedback from my viewers!
Like and/or subscribe if you want more accurate analysis.
Thank you so much!
Disclaimer:
I do not provide personal investment advice and I am not a qualified licensed investment advisor.
All information found here, including any ideas, opinions, views, predictions, forecasts, commentaries, suggestions, expressed or implied herein, are for informational, entertainment or educational purposes only and should not be construed as personal investment advice. While the information provided is believed to be accurate, it may include errors or inaccuracies.
I will not and cannot be held liable for any actions you take as a result of anything you read here.
Conduct your own due diligence, or consult a licensed financial advisor or broker before making any and all investment decisions. Any investments, trades, speculations, or decisions made on the basis of any information found on this channel, expressed or implied herein, are committed at your own risk, financial or otherwise.