DeGRAM | GOLD held the trend line📊 Technical Analysis
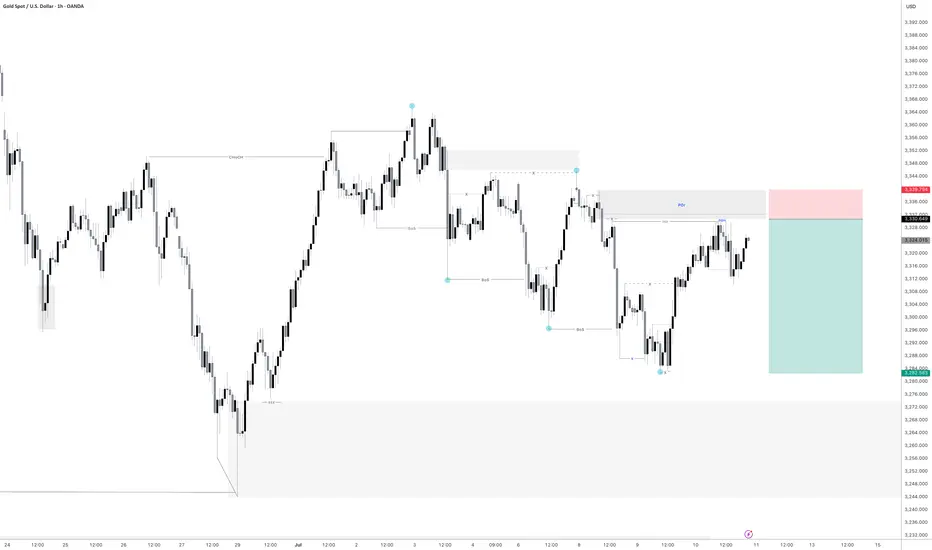
● Bulls defended the channel‐base 3 280 zone, breaking the six-week falling wedge and reclaiming 3 312; structure flips to higher-highs within the rising channel.
● A close above the wedge lip at 3 355 should unlock the grey range ceiling where the May trend-cap and 3 430 – 3 450 intersect. Pull-backs into 3 300-3 312 are expected to attract bids while the wedge retest holds.
💡 Fundamental Analysis
● US headline-CPI cooled for a second month, knocking 2-yr real yields to one-month lows and trimming Fed-cut timing, while PBoC data show June net gold purchases resuming—both reviving spot demand.
✨ Summary
Long 3 300-3 320; breakout >3 355 eyes 3 430 → 3 450. Invalidate on an H4 close below 3 280.
-------------------
Share your opinion in the comments and support the idea with a like. Thanks for your support!
Commodities

XAUUSD - Will Gold Continue Its Rise?!Gold is trading above the EMA200 and EMA50 on the hourly chart and is trading in its ascending channel. We still have a bullish view on this commodity and we can expect to see $3,350. A correction towards the bottom of the ascending channel will also provide us with a better risk-reward buying opportunity.
According to the World Gold Council, physically backed gold ETFs attracted around $38 billion in investments during the first half of 2025. This marks the largest semi-annual inflow since the beginning of 2020. The remarkable surge is primarily attributed to heightened investor demand for safe-haven assets amid escalating economic and trade tensions triggered by President Trump’s tariff policies.
During this period, the total gold holdings of these funds grew by 397.1 tonnes, bringing their global assets to 3,615.9 tonnes by the end of June—the highest level since August 2022, although still below the all-time high of 3,915 tonnes recorded in October 2020.
U.S.-based funds led the inflows with an addition of 206.8 tonnes, while Asian funds—despite accounting for only 9% of total assets—captured 28% of global inflows, highlighting a significant rise in interest among Asian investors in gold.
This positive trend emerged after three consecutive years of outflows between 2021 and 2023, followed by modest inflows in 2024. Concurrently, gold prices have surged by 26%, reaching a record high of $3,500 per ounce in April.
The World Gold Council, established in 1987 and headquartered in London, is funded by major gold mining companies. Its main objectives include boosting global demand for gold, enhancing market accessibility, and promoting innovation within the gold industry. The council plays a crucial role in shaping global perceptions of gold as a financial asset.
However, some analysts argue that the council essentially functions as a powerful lobbying group for mining corporations, often releasing reports designed to bolster demand and foster a positive market sentiment toward gold.
On the other hand, Bank of America (BofA), in its latest report using a global trading time framework, analyzed the outlook for the U.S. dollar in the second half of 2025. Despite the dollar having its worst start to a year since 1973, the report suggests that selling pressures on the currency may ease going forward, particularly during U.S. trading hours.
U.S. Trading Hours and Federal Reserve Policy
The dollar’s cumulative performance during U.S. trading hours remains strongly correlated—at 71%—with Federal Reserve interest rate pricing. Given expectations for stable rates throughout the rest of the year, the dollar could find some support during this time frame.
Asia: The Main Driver of Dollar Selling in H1 2025
Asian investors were the largest sellers of the dollar during the first half of 2025. However, after fully unwinding the long positions accumulated over the past two years, dollar performance in Asian trading hours has now turned neutral. Fresh selling may remain limited unless new bearish catalysts emerge.
Europe: Tied to Global Equities’ Performance
Dollar weakness during European trading hours largely depends on the relative strength of global equities versus U.S. stocks. As U.S. equities reclaimed market leadership in the second quarter, European investors may have less incentive to continue selling dollars.
Decline in Currency Hedging Appetite
Following the dollar’s significant drop in the first half of the year, foreign investors are now less inclined to increase currency hedges on their dollar-denominated assets.
According to Bank of America’s trading time framework, the pace of the dollar’s decline is likely to slow in the second half of the year, especially during U.S. trading hours, as stable Federal Reserve policy removes a key bearish factor. Selling pressure from Asia is also expected to ease unless new downside triggers arise. The key variable going forward will be the relative performance of global equities versus U.S. markets.

Gold fluctuates, consolidation in the 3330-3310 range📰 News information:
1. Waller meeting on interest rate cuts
2. Trump tariff issues
📈 Technical Analysis:
Waller will participate in the meeting in more than two hours and pay attention to whether there is any news of interest rate cut. The key is to operate around the 3330-3310 range. Continue to pay attention to the support of 3310-3305 at night. If gold falls below 3310,-3305 again, the downward trend will continue, and it is expected to touch 3280 again, or even 3250. If it rebounds above 3330, it is likely to continue to rise.
In addition to investment, life also includes poetry, distant places, and Allen. Facing the market is actually facing yourself, correcting your shortcomings, facing your mistakes, and exercising strict self-discipline. I share free trading strategies and analysis ideas every day for reference by brothers. I hope my analysis can help you.
TVC:GOLD FXOPEN:XAUUSD FX:XAUUSD FOREXCOM:XAUUSD PEPPERSTONE:XAUUSD OANDA:XAUUSD

Gold: Market analysis and strategy on July 11Gold technical analysis
Daily chart resistance: 3375, support: 3285
Four-hour chart resistance: 3360, support: 3310
One-hour chart resistance: 3345, support: 3324.
For the current market trend, pay attention to the resistance of 3340-3345 on the upper side during the day. This is the high point concentration area that has suppressed the upward trend of gold prices many times in the early stage. If it is treated as a volatile market, sell at highs in the 3340~3345 range. If it breaks through 3345, it may trigger stop-loss buying and continue to rise to the 3355~3360 area.
The key support below is still at 3310, but from the 1-hour chart, the trend is rising in steps, and the short-term support is around 3324. Buy back here. After the Asian market was blocked near the previous high of 3345, it entered a short-term correction, and the long and short saws. It is suitable for fast in and out, and follow up and buy after breaking through 3345.
Buy: 3324near
Buy: 3310near
Buy: 3345near
Sell: 3344near

Go long when the trend reverses, beware of black swansYesterday's pullback to 3313-3310 confirmed the upward trend of gold. As I expected, it broke through the resistance of 3330 and touched around 3345. Currently, the short-term strong resistance is at 3345. Only by breaking through this resistance can gold maintain its upward trend. If it is blocked near the 3345 line in the short term, there is a possibility of a pullback. If 3345 breaks, there will be 3365 and 3400 above. Once the direction is clear, it will be easier to act. If there is a pullback during the day, it will give us a trading opportunity to enter the long position.
OANDA:XAUUSD

Gold 30Min Engaged ( Reversal Entry's Detected )Time Frame: 30-Minute Warfare
Entry Protocol: Only after volume-verified breakout
🩸Bullish Reversal 3285 : 3272 Zone
🩸Bearish Reversal 3326 : 3334 Zone
➗ Hanzo Protocol: Volume-Tiered Entry Authority
➕ Zone Activated: Dynamic market pressure detected.
The level isn’t just price — it’s a memory of where they moved size.
Volume is rising beneath the surface — not noise, but preparation.
🔥 Tactical Note:
We wait for the energy signature — when volume betrays intention.
The trap gets set. The weak follow. We execute.
Gold 30Min Engaged ( Reversal Entry's Detected )

109K Launch Zone? Bitcoin Update Now LiveHey everyone,
Here's my latest Bitcoin analysis for you. The current price action is unfolding within an ABC corrective wave.
🔍 I've identified the optimal buy zone between 108,349 and 109,682.
📉 Once the price pulls back into this range, my limit orders will be triggered and the position will open.
🎯 In this scenario, my target level is 118,157.
Below are the exact levels for my entry, targets, and stop-loss:
- 🟩 Entry Level: 109,027
- 🟥 Stop-Loss: 105,876
- 🎯 TP1: 111,156
- 🎯 TP2: 113,607
- 🎯 TP3: 118,362
- ⚖️ Risk/Reward Ratio: 3.00
(This is based on a swing trade model, so reaching this level may take some time)
--------
Your likes and support are what keep me motivated to share these analyses consistently.
Huge thanks to everyone who shows love and appreciation! 🙏

"XZN/USD: Last Chance to Buy Before Rally!"🚨 "The Zinc Heist" – XZN/USD Master Looting Plan (Thief Trading Style) 🚨
💰 Steal Like a Pro – Bullish Breakout Strategy for Maximum Profit! 💰
🔥 THIEF TRADING ALERT: XZN/USD METAL MARKET ROBBERY IN PROGRESS! 🔥
🚨 Attention, Money Makers & Market Robbers! 🚨
Based on the 🔥Thief Trading Method🔥, we’ve cracked the code for XZN/USD ("The Zinc") – and the vault is WIDE OPEN! 🏦💎 This is your chance to join the heist and escape with massive profits!
📜 THE MASTER HEIST PLAN (Day/Swing Trade) 📜
🎯 Mission: LONG ENTRY – Swipe the bullish loot before the market reverses!
⚠️ Danger Zone: Overbought market, consolidation, and Electric Trap where bears lurk! Escape before they strike!
🔑 ENTRY STRATEGY (How to Loot Like a Pro):
"The vault is open!" – Enter at any price, but smart thieves use limit orders!
Best Heist Tactics:
Buy Limit Orders within 15-30 min near swing lows/highs (pullback entries).
DCA / Layering Strategy – Multiple limit orders for maximum loot!
🛑 STOP-LOSS (Escape Plan If the Heist Goes Wrong):
Thief SL: Nearest swing low (candle body/wick) on 3H TF (2700).
Risk Management: Adjust SL based on your trade size, risk tolerance, and number of orders.
🎯 TARGETS (Where to Cash Out & Flee!):
First Escape: 2870 (or exit early if the market turns risky!).
Scalpers’ Quick Loot: Only trade LONG! Use trailing SL to protect profits!
📡 WHY THIS HEIST WILL WORK (Bullish Triggers!):
✅ Strong Bullish Momentum – Market is primed for a breakout!
✅ Fundamental Backing – Macro trends, COT data, and sentiment favor bulls!
✅ Intermarket Confirmation – Metals sector heating up!
🔗 Want the FULL robbery blueprint?
👉 Check Fundamental Reports, COT Data, Sentiment Analysis & More!
🚨 TRADING ALERT: NEWS & POSITION SAFETY! 🚨
⚠️ WARNING: High-impact news can wreck the heist! Protect your loot:
Avoid new trades during news!
Use TRAILING SL to lock profits & dodge volatility!
💥 BOOST THIS HEIST! 💥
🚀 Hit the LIKE & BOOST button to strengthen our robbery squad!
💸 More likes = More heists = More profits for YOU!
🎉 Stay tuned – Next heist coming soon! 🎉
⚠️ DISCLAIMER (Stay Out of Jail!):
📌 Not financial advice! Your money, your risk.
📌 Markets change FAST! Always DYOR before trading.
🔥 Ready to Rob the Market? Let’s Get That Bag! 🔥
🚀 LIKE, SHARE & FOLLOW FOR MORE HEISTS! 🚀
#Trading #XZNUSD #ZincHeist #ThiefTrading #BullishBreakout #MarketRobbery #ProfitPlan

XAUUSD - Sell or Buy ? Hello everyone, great to see you again!
Today, OANDA:XAUUSD remains under notable pressure as the U.S. continues to signal a tougher trade stance. The latest move: the U.S. President announced a 50% import tariff on copper and a potential 200% tariff on pharmaceuticals, following a previous tariff notice ranging from 25% to 40% sent to 14 countries — including Japan, South Korea, Thailand, and Malaysia.
This isn’t just about protectionism. These measures fuel fears of global inflation, supply chain disruptions, and a broader economic slowdown. With surging prices in raw materials and essential goods, consumers may be forced to cut back spending, a classic warning sign for future growth.
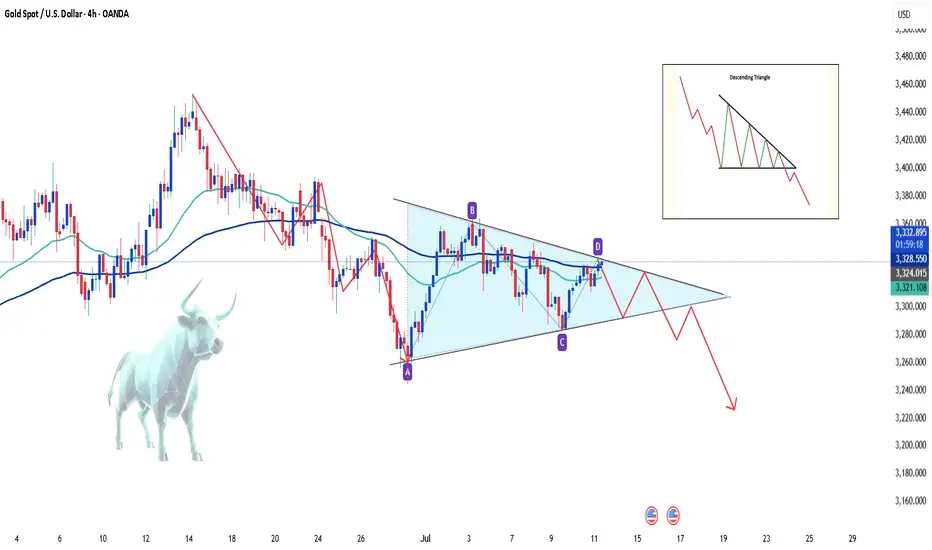
In this environment, investors had hoped gold would shine again as a safe haven asset. However, the recent bullish momentum has been underwhelming, signaling ongoing market hesitation.
📉 On the H4 chart, XAUUSD is being squeezed into a descending pattern, which typically carries a high probability of a downside breakout. If the current support fails, the next target could fall below the 32xx area.
On the flip side, if supportive news emerges — such as a hint of rate cuts from the Fed — gold must break above the $3,335 level to revive bullish sentiment.
🔎 What do you think? Will gold break lower — or bounce back? Drop your thoughts below!
TRADING IDEA - US CRUDE OIL - BEARISH FLAG, CONCERNS ON GLOBAL EFOREXCOM:USOIL
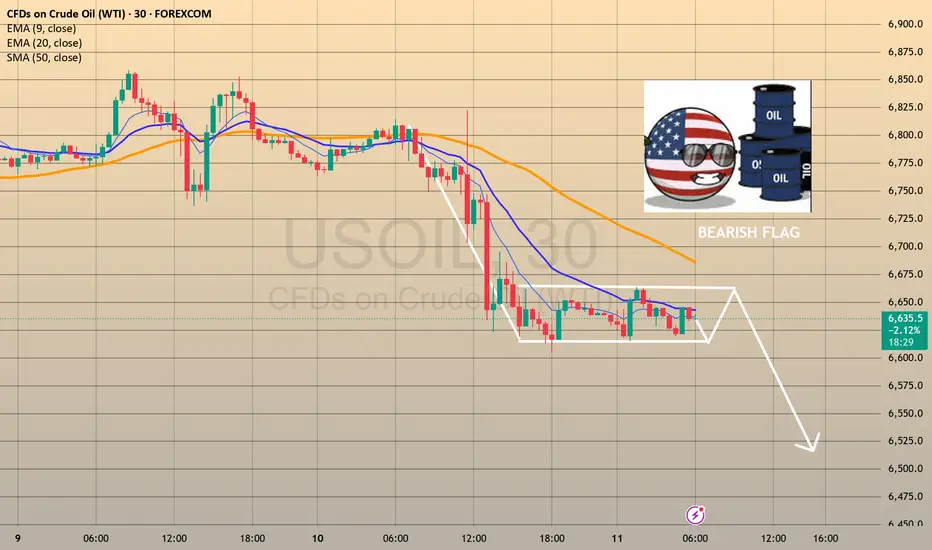
The US Crude Oil prices went down yesterday, mostly because of the tariffs and concerns on demand.
Here is what the Bloomberg is writing: " OPEC+ is discussing a pause in its oil production increases from October is fueling concerns about a slowdown in global energy demand. In addition, the intensification of US tariffs risks slowing global economic growth and energy demand after President Trump ramped up tariffs on numerous countries this week, including a 50% tariff on Brazil."
So, despite the pause in oil production increase, which is supposed to be bullish factor the oil prices, we may see the slowdown in global economy and supposedly a recession because of Trump's tariffs. This is a long-term bearish factor for the oil. I think that we will see another bearish impulse here, according to what we observe on the chart.
There is a nice bearish flag and i am planning to short it with a target nearby 6,540.00 support level.
🔽 a pending sell stop order at 6615.3 with
❌a stop loss at 6680.9 and
🤑a take profit at 6544.0
Trade cautiously! Preserve your deposits!
Everybody loves Gold Part 7Great trading last week. Gold really pushing deep into blues.
This week takes a downturn with possibilities highlighted on the chart; all pointing towards LOS (Level of significance). This level is calculated based on previous week high-low values.
Trade parameters:
1. SL: 50-100pips
2. TP: 3-4x SL
3. double tops/bottom (around LOS) are direction changers.
As always price action determines trades

Bullish bounce>WTI Oil (XTI/USD) is falling towards the pivot which acts as a pullback support and could bounce to the 1st resistance.
Pivot: 65.65
1st Support: 63.74
1st Resistance: 68.24
Risk Warning:
Trading Forex and CFDs carries a high level of risk to your capital and you should only trade with money you can afford to lose. Trading Forex and CFDs may not be suitable for all investors, so please ensure that you fully understand the risks involved and seek independent advice if necessary.
Disclaimer:
The above opinions given constitute general market commentary, and do not constitute the opinion or advice of IC Markets or any form of personal or investment advice.
Any opinions, news, research, analyses, prices, other information, or links to third-party sites contained on this website are provided on an "as-is" basis, are intended only to be informative, is not an advice nor a recommendation, nor research, or a record of our trading prices, or an offer of, or solicitation for a transaction in any financial instrument and thus should not be treated as such. The information provided does not involve any specific investment objectives, financial situation and needs of any specific person who may receive it. Please be aware, that past performance is not a reliable indicator of future performance and/or results. Past Performance or Forward-looking scenarios based upon the reasonable beliefs of the third-party provider are not a guarantee of future performance. Actual results may differ materially from those anticipated in forward-looking or past performance statements. IC Markets makes no representation or warranty and assumes no liability as to the accuracy or completeness of the information provided, nor any loss arising from any investment based on a recommendation, forecast or any information supplied by any third-party.

GOLD continues to recover, tariff war changes unpredictablyInternational OANDA:XAUUSD continued to rise, boosted by a slight decline in the US Dollar and US Treasury yields. At the same time, investors are closely monitoring the developments in trade negotiations as US President Trump expands the tariff war.
As of the time of writing, spot OANDA:XAUUSD increased by 0.3% to 3,333 USD/oz. The general weakness of the US Dollar, the decline in US Treasury yields and renewed concerns about the escalation of the trade war have helped stabilize gold prices.
On Thursday evening (July 10) local time, US President Donald Trump once again increased pressure on trading partners. He announced that he would impose a 35% tariff on imported goods from Canada, and the USD/CAD exchange rate rose sharply in the short term.
Trump posted on his social media platform Truth Social that a 35% tariff would be imposed on imported goods from Canada, effective from August 1, 2025.
It is still unclear whether the current exemptions for goods traded under the United States-Mexico-Canada Agreement (USMCA) will be extended or terminated.
Due to the impact of escalating trade tensions, spot gold prices also rose by more than 10 dollars in the short term at the beginning of the Asian trading session on Friday, and the current high price of gold has reached around 3,336 USD/ounce.
In an interview with NBC News on Thursday, Trump said he was also considering imposing a flat tariff of 15% to 20% on most of his trading partners, adding that the exact tariff rate was being worked out. The current flat tariff rate is 10%.
Trump sent letters to trading partners this week, announcing that the new tariffs would take effect on August 1 if they could not negotiate more favorable terms. He is expected to send letters to European Union member states soon.
Trump sent the first batch of tariff letters to 14 countries, including Japan and South Korea, on July 7, with tariffs ranging from 25% to 40%. He also said he would send more similar letters this week.
Minutes from the Fed's June 17-18 meeting showed that only a "few" Fed officials thought a rate cut was possible as early as this month, while most preferred to hold off until later in the year due to inflation concerns caused by Trump's tariffs.
The Federal Open Market Committee (FOMC) voted unanimously to leave interest rates unchanged at its June meeting. The next policy meeting is scheduled for July 29-30.
Markets will focus on progress in Trump's tariff negotiations, key US economic data and speeches by Federal Reserve officials later in the day for fresh trading direction for gold prices.
Technical Outlook Analysis OANDA:XAUUSD
Gold has had 2 sessions of recovery from the area around the 0.382% Fibonacci retracement, but the temporary upside momentum is still limited and does not qualify for a new bullish cycle.
In the short term, the EMA21 with the 0.236% Fibonacci retracement will act as the nearest resistance, if gold takes the price action to break above the 0.236% Fibonacci retracement level it will qualify for a new bullish cycle with the target then being around $3,400 in the short term, more so than $3,430.
On the other hand, with the current neutral trend, once gold is sold below the 0.382% Fibonacci retracement level again, it will have conditions to decline, and the target then is around 3,246 USD in the short term, more than the 0.50% Fibonacci retracement level.
The RSI index is hovering around 50, also showing that the market sentiment is still hesitant to have a specific direction.
During the day, the sideways trend of gold prices will be noticed by the following positions.
Support: 3,300 - 3,292 USD
Resistance: 3,340 - 3,350 - 3,371 USD
SELL XAUUSD PRICE 3388 - 3386⚡️
↠↠ Stop Loss 3392
→Take Profit 1 3380
↨
→Take Profit 2 3372
BUY XAUUSD PRICE 3296 - 3298⚡️
↠↠ Stop Loss 3292
→Take Profit 1 3304
↨
→Take Profit 2 3310

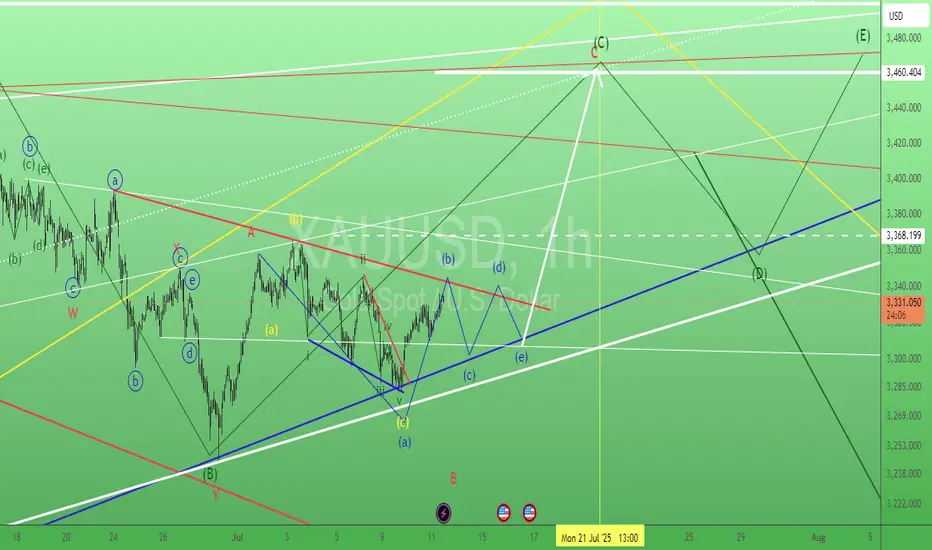
Gold. Swing trade setup 11/July/25XAUUSD. Based on latest 'speed' of chart "touching" those trendlines, gold probably having a triangle base now..before moving toward 3460 +/-...
XAG/USD (Silver) - Triangle Breakout (09.07.2025)The XAG/USD (Silver) pair on the M30 timeframe presents a Potential Buying Opportunity due to a recent Formation of a Wedge Breakout Pattern. This suggests a shift in momentum towards the upside and a higher likelihood of further advances in the coming hours.
Possible Long Trade:
Entry: Consider Entering A Long Position around Trendline Of The Pattern.
Target Levels:
1st Resistance – 3749
2nd Resistance – 3781
🎁 Please hit the like button and
🎁 Leave a comment to support for My Post !
Your likes and comments are incredibly motivating and will encourage me to share more analysis with you.
Best Regards, KABHI_TA_TRADING
Thank you.
Disclosure: I am part of Trade Nation's Influencer program and receive a monthly fee for using their TradingView charts in my analysis

GOLD SWING LONG|
✅GOLD is trading in a strong
Long-term uptrend along the
Rising support line so we are
Bullish biased and after the price
Breakout of the local opening wedge
We we will be expecting a
Further bullish move up
LONG🚀
✅Like and subscribe to never miss a new idea!✅
Disclosure: I am part of Trade Nation's Influencer program and receive a monthly fee for using their TradingView charts in my analysis.

Silver is Again in the Bullish directionHello Traders
In This Chart XAGUSD HOURLY Forex Forecast By FOREX PLANET
today XAGUSD analysis 👆
🟢This Chart includes_ (XAGUSD market update)
🟢What is The Next Opportunity on XAGUSD Market
🟢how to Enter to the Valid Entry With Assurance Profit
This CHART is For Trader's that Want to Improve Their Technical Analysis Skills and Their Trading By Understanding How To Analyze The Market Using Multiple Timeframes and Understanding The Bigger Picture on the Charts

GBPJPY - Multi Year SHORTS Coming! (Over 10,000pips)Here we have the 2 month chart of GBPJPY. We can see that we're in a massive ending diagonal made up of 5 waves.
We are currently on wave 4 and have almost completed. At the moment we are working within the parameters of a channel however we must be aware that we may exceed the channel. The channel is just there for us to use as a guideline.
In 2007, we have a really nice ending diagonal (expanding) before we made that ridiculous +13k pip drop.
See below for the 2D GBPJPY chart from 2007:
We can see that the lower timeframe diagonal broke down beautifully.
We are anticipating something similar this time round!
See below for the 2D GBPJPY chart of the current diagonal:
We've got an almost identical price action as 2007. We just got to wait a little and watch for the break of the red trendline and enter and hold.
See below for the 2week chart of GBPJPY:
Trade Idea:
- Watch for a break of the ending diagonal
- Alternatively, you can wait for a pullback after the ending diagonal breaks
- stop loss above highs once entry trendline breaks
- Swing Target: 100 (10,000pips)
What do you guys think?
Goodluck and as always, trade safe!

GBPJPY - Multi-Year Short Update! In our last setup for GBPJPY, we identified a massive diagonal pattern, with price completing wave 4 and preparing for a multi-year drop into wave 5.
Since then, price has played out exactly as forecasted — we've seen a clean impulse lower for wave 1, followed by an ABC correction for wave 2, which looks to have now completed.
This sets the stage for the next major leg — wave 3 of 5 — which historically carries the most power and momentum.
📉 See monthly chart here:
📊 GBP/JPY Wave‑3 Trade Idea
Background:
We’ve completed wave 1 down and wave 2 up (ABC correction).
GBPJPY is now positioned to start a powerful wave 3 down — the most impulsive leg in an Elliott sequence.
🔍 Current Price Action:
Price is rejecting major resistance (previous wave A high + shaded zone)
Structure shows a completed 5-wave move up within C, suggesting exhaustion.
A clean ascending trendline (red) has formed under wave v — a break here signals the first confirmation.
Option 1 – Aggressive Entry:
- Trigger: Break and close below the red trendline (~198.00–197.80 zone) on the daily.
- Entry: On candle close below trendline
- Stop Loss: Above recent high ~199.80 and then breakeven once we move lower
Option 2 – Conservative Entry (preferred):
- Trigger: Trendline break + correction
- Entry: On bearish confirmation and then a correction to indicate further downside
- Stop Loss: Above recent high ~199.80 and then breakeven once we move lower
Take Profit Levels:
- TP1: 192
- TP2: 180
- TP3: 175
- Final Target: Trail for extended move toward wave (3) lows (could be 10,000+ pips over long term)
🔐 Invalidation:
Daily close back above 200.00 or impulsive rally beyond the pink resistance zone invalidates the short bias in the short term.
✅ Summary:
This is a high-conviction, structure-backed setup with:
- Wave count + Fib confluence
- Bearish structure at key resistance
- Confirmation-based trigger (trendline break + retest)
- Excellent long-term risk-to-reward profile
📂 Previous GBPJPY Setups (Track Record):
📌 Free Setup (Big Picture Outlook) – Multi-Year Shorts Incoming (Wave 4 Completion)
✅ Swing 1 – 1,200 Pips (VIP GBPJPY Long)
✅ Swing 2 – 1,000 Pips (VIP GBPJPY Short)
✅ Swing 3 – 1,100 Pips (VIP GBPJPY Short)
✅ Swing 4 – 700 Pips (VIP GBPJPY Short)

Gold - Sell inboundGold is looking very promising for another sell off. we are already showing signs that price has intent to move lower with some lower timeframe break of structure.
Just waiting for a manipulation now of the most recent highs put in before price moves lower.
Let's see if we get an entry tonight.
The latest gold analysis and strategy on July 10:
Core logic of the market
Risk aversion supports gold prices: Trump postponed tariffs but threatened to increase them in the future. Market concerns about trade frictions remain, and gold is still supported as a safe-haven asset.
Impact of the US dollar trend: If trade tensions escalate, the US dollar may be under pressure, which is further beneficial to gold.
Technical side is bullish and volatile: The daily line closed positive and stabilized the lower Bollinger track. The H4 cycle rebounded with consecutive positives, but it has not yet broken through the key resistance of 3345. Be wary of repeated fluctuations.
Key point analysis
Support level: 3310-3300 (short-term), 3285 (strong support)
Resistance level: 3340-3345 (Daily Bollinger middle track), 3365 (target after breakthrough)
Key day of change: The rebound may continue on Thursday. If it breaks through 3345, it may further attack 3365-3400 on Friday.
Trading strategy
1. Low-to-long (main strategy)
Entry point: 3310-3315 (retracement support area)
Stop loss: 3305 (prevent false breakthrough)
Target: 3325 (short-term), 3335-3345 (key resistance area)
Logic: H4 cycle continuous positive shows bullish momentum, and it is expected to continue to rebound after retracement support.
2. High-level short-selling auxiliary trading strategy (if key resistance is touched)
Entry point: 3340-3345 (first test resistance area)
Stop loss: 3350 (prevent breakout and upward movement)
Target: 3325-3320 (short-term correction)
Logic: 3345 is a strong pressure from the middle track of the daily Bollinger. You can short before breaking through, but you need to enter and exit quickly.
Key observation points
3345 breakthrough situation:
If it stands firmly at 3345, you can go long with a light position after the correction (target 3365, 3400).
If it falls under pressure, it may return to the 3310-3340 oscillation range.
3300 defense situation:
If it falls below 3300, it may fall back to 3285, and we need to be alert to short-term weakness.
Summary
Main idea: Low-long (3310-3315) as the main, target 3345, and look at 3365+ after breaking through.
Auxiliary strategy: 3340-3345 short, fast in and fast out.
Risk control: Strictly stop loss, avoid chasing up and selling down, and pay attention to the changes in the momentum of the US market.

Natural Gas - The Epic Reversal? Natural gas had an astonishing move to the upside. Closing up over 5% today.
This volatility can make all tarders head spin if youre not used to it.
Why did Nat gas pop today?
Partly from being oversold and into really good technical support, Natural gas inventories were released today at 10:30am.
The inventories showed a smaller build than the market expected which implies stronger demand. 56B consensus vs 53B actual.
This could potentially be the start to a new bullish trend.
Names like EQT & AR hit some major support today. Some call options on these names have been accumulated.

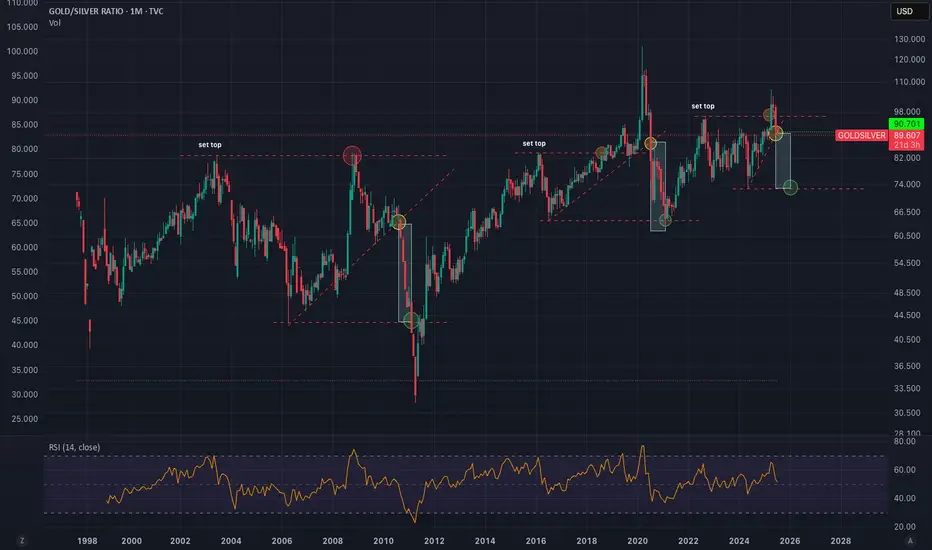
Gold/Silver Ratio to 72 Minimum - Imminent Silver BreakoutGoldSilver Ratio is following a clear pattern of behavior. We can expect a return to mean conservatively hitting 72 at a minimum. This puts silver at $46-58 if Gold doesn't move higher. I think we will see silver 5-10X over the next few years. Easy 25-50% in the short term (6-12 months).