Cocoa futures near a key technical resistance areaMARKETSCOM:COCOA futures have been trending lower, while trading within a falling channel pattern since around mid-May of this year. But we are near the upper bound of that channel. Let's see if it holds.
Let us know what you think in the comments below.
Thank you.
75.2% of retail investor accounts lose money when trading CFDs with this provider. You should consider whether you understand how CFDs work and whether you can afford to take the high risk of losing your money. Past performance is not necessarily indicative of future results. The value of investments may fall as well as rise and the investor may not get back the amount initially invested. This content is not intended for nor applicable to residents of the UK. Cryptocurrency CFDs and spread bets are restricted in the UK for all retail clients.
Commodity

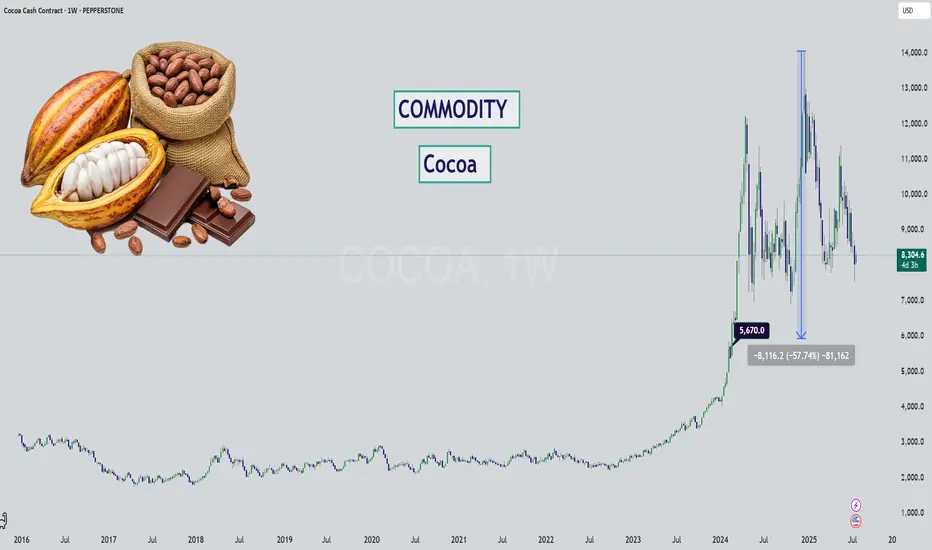
Cocoa - Chocolate is DIPPING (literally)Hello Market Watchers 👀
I bring today an update on your favorite commodity (mine actually)... 🍫
The weekly timeframe from a multi-year perspective is what's on the cover and one thing is clear - cocoa has never increased so much as it during May23' to Dec24'.
Sure inflation brought on by covid has a role to play. But even so, factoring in the amount of +509%? That is way out.
We could likely see this kind of stair step down movement on cocoa, since it has been following the logic of: " previous support = new resistance ".
Either way what this tells me is that cocoa has been running overly hot for too long... and it's time for a cooldown. Prices will likely never return to pre-covid levels, unless there is unfortunate weather or other supply chain issues.
Ultimately, a return back to the $5,600 zone would be a reasonable market correction for such a large increase.
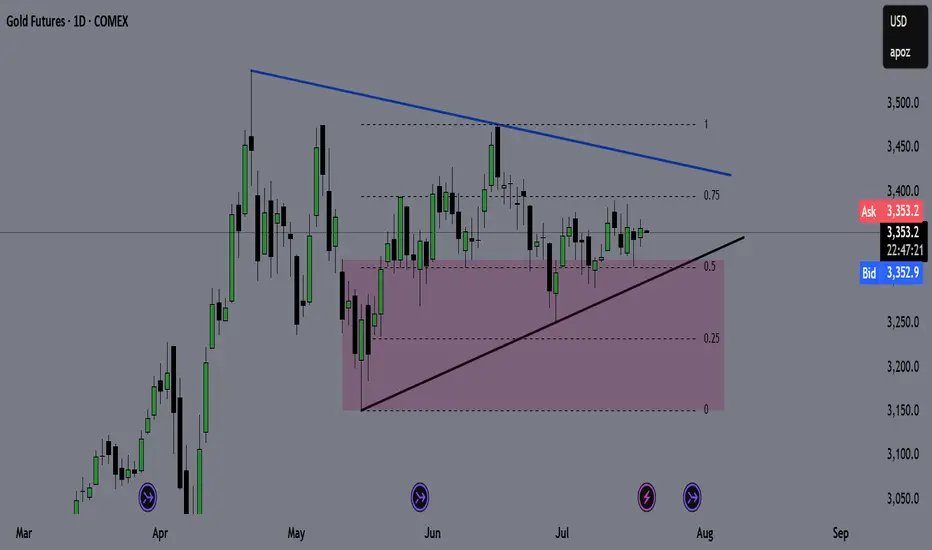
GOLD (GC) Weekly Recap & Game Plan 20/07/2025🪙 GOLD (GC) Weekly Recap & Game Plan
📊 Market Context:
Price is currently forming an accumulation pattern.
The purple zone marks a key weekly demand zone, and I expect a potential bounce from that level.
I'm closely watching for trendline deviations to determine the directional bias.
🎯 Game Plan:
If price drops below the trendline and bounces from the weekly demand, I’ll look for longs targeting the bearish trendline.
If price taps the bearish trendline and shows clear rejection, I’ll look for shorts targeting the bullish trendline.
I'll wait for LTF confirmations before entering any position.
✅ Follow for weekly recaps & actionable game plans.
Could we see the WTI oil bears getting pleased any time soon?The technical picture of MARKETSCOM:OIL is showing a possible bearish flag formation, which may lead WTI oil to some lower areas. Is that the case? Let's dig in.
NYMEX:CL1!
Let us know what you think in the comments below.
Thank you.
75.2% of retail investor accounts lose money when trading CFDs with this provider. You should consider whether you understand how CFDs work and whether you can afford to take the high risk of losing your money. Past performance is not necessarily indicative of future results. The value of investments may fall as well as rise and the investor may not get back the amount initially invested. This content is not intended for nor applicable to residents of the UK. Cryptocurrency CFDs and spread bets are restricted in the UK for all retail clients.

US CPIs came out. Gold is at an interesting spot.TVC:GOLD is currently struggling with one of its key resistance barriers, at around 3365. We need a clear break above that area in order to aim for higher areas. However, we are not getting bearish yet. Let's dig in!
MARKETSCOM:GOLD
Let us know what you think in the comments below.
Thank you.
75.2% of retail investor accounts lose money when trading CFDs with this provider. You should consider whether you understand how CFDs work and whether you can afford to take the high risk of losing your money. Past performance is not necessarily indicative of future results. The value of investments may fall as well as rise and the investor may not get back the amount initially invested. This content is not intended for nor applicable to residents of the UK. Cryptocurrency CFDs and spread bets are restricted in the UK for all retail clients.

Quick take o sugar futuresThe technical picture is starting to look quite interesting. Let's see if seasonality will kick in as well. Let's dig in.
MARKETSCOM:SUGAR
ICEUS:SB1!
Let us know what you think in the comments below.
Thank you.
75.2% of retail investor accounts lose money when trading CFDs with this provider. You should consider whether you understand how CFDs work and whether you can afford to take the high risk of losing your money. Past performance is not necessarily indicative of future results. The value of investments may fall as well as rise and the investor may not get back the amount initially invested. This content is not intended for nor applicable to residents of the UK. Cryptocurrency CFDs and spread bets are restricted in the UK for all retail clients.

Copper Cup & Handle Formation - Confirmed by Half-Yearly CloseIn a recent interview, Kevin Warsh, a former Member of Board of Governors Federal Reserve said: “External shocks like wars, pandemics, and supply chain disruptions may cause a spike in prices, that's not inflation. That's more like the weather. Inflation's more like the climate.
Weather refers to the day-to-day state of the atmosphere. A storm may come, but it will eventually pass.
Climate is the long-term average of weather patterns, typically measured over 30 years or more. If the underlying causes of climate change are not addressed, they are likely to affect future weather — for example, storms may become more unpredictable, occur more frequently, and intensify when they happen.
Going back to the financial markets. Have we address the underlying causes of inflation climate today? If not, then with every war or rumors of war or tariff or any unwelcome surprises.
They are likely to become even more volatile than before, some more bullish and the others more bearish.
What is the real cause of inflation climate the world is facing? Debt. At every pit stop, I will keep checking if there’s any chance that U.S. debt might start trending downward. If it does, my existing strategies would have to change. But for now, I’m maintaining these strategies. Here are some examples:
With fears of inflation still in sight, stocks have become more volatile. Since inflation hit a high of 9% in 2022, we’ve seen stock market swings widen.
With fears of inflation, bonds are under pressure. The drop in U.S. bonds wasn't triggered by the “Liberation Day” tariff announced on 2nd April alone. In fact, bonds peaked in 2020 and broke below their main uptrend support when inflation hit 9%.
With fears of inflation are also driving commodities higher — from “weather” to “weather,” so to speak. I’ve been covering gold, bitcoin, silver, and soybean oil. Today, copper looks interesting to me. Let’s dive into the technical. I find the half-year chart particularly interesting.
On this half yearly chart. We can see as the close on 30th June, copper settled firmly, closed above its $4.44 resistance that has been tested for years. This study indicates that copper could be at the beginning of an uptrend. I will be looking out for buying-on-dips opportunities whenever they arise.
What Began Well, Grew Risky — Yet Opportunity Awaits. Besides debt, there are two other key elements that may trigger fears of inflation from time to time. What do you think they are?
I would like to hear your thoughts on this.
Video version:
Mirco Copper Futures
Ticker: MHG
Minimum fluctuation:
0.0005 per pound = $1.25
Disclaimer:
• What presented here is not a recommendation, please consult your licensed broker.
• Our mission is to create lateral thinking skills for every investor and trader, knowing when to take a calculated risk with market uncertainty and a bolder risk when opportunity arises.
CME Real-time Market Data help identify trading set-ups in real-time and express my market views. If you have futures in your trading portfolio, you can check out on CME Group data plans available that suit your trading needs www.tradingview.com

Gold: Potential Correction on the Horizon?Gold has long been regarded as a safe haven asset, drawing the attention of investors during periods of economic uncertainty. In recent years, gold prices have reached historic highs, fueled by inflation concerns, geopolitical tensions, and shifts in monetary policy. However, as with any asset experiencing a prolonged rally, the question arises: Is a correction in gold prices imminent?
Understanding the Recent Gold Rally
Several factors have contributed to gold’s impressive performance:
Inflation Hedge: Persistent inflation has driven investors toward gold as a store of value.
Geopolitical Risks: Ongoing conflicts and global tensions have increased demand for safe haven assets.
Monetary Policy: Central banks’ dovish stances and low interest rates have made non-yielding assets like gold more attractive.
Several scenarios could catalyze a correction in gold prices:
Unexpected Economic Recovery: Stronger-than-expected economic data could reduce demand for safe haven assets.
Aggressive Rate Hikes: Faster-than-anticipated interest rate increases could shift investor preference away from gold.
Resolution of Geopolitical Tensions: Any de-escalation in major geopolitical hotspots may dampen gold’s appeal.
#gold #commodity #commodities #metals #trading #portfolio

COFFEE - My Commodity of ChoiceI've laid out a plan I'm looking at on one of my favorite commodities - COFFEE ☕😍
What makes it so hard is the predictability of the weather - nearly impossible for the future. However, it is odd to see that the price still bonces at key support and resistance zones, almost like any "stock". Which tells me regular market trading still applies despite the odd weather event.
The reason Coffee has fallen so hard over the past few months is supply - due to extremely favorable weather conditions, coffee supply is more than demand. Resulting, as market dynamics goes, in a drop of price.
It's unfortunate though that my favorite pack of beans at the supermarket has not gone down - weird how that works 🙄 I like a medium roast, Columbia single origin.
It's dropped -33% already, but I can clearly see the market structure entering bearish phase after the bullish phase, peak (the new high) and now likely a multi-month bearish season. The question is just where the price can bottom for such a well loved commodity.
I looked at past cycles, not too long ago we dropped roughly 44% during the bearish cycle, taking 2-3 years to move into accumulation before another impulse wave up. That places a target for entry exactly in the highlighted zone around $250ish.
But I wouldn't get too greedy on my favorite commodity, buying orders can't be too low either. This would likely have to be a multiyear hold. Pepperstone sells coffee on cash contract but I usually do futures. Pity that I didn't get in sooner, bullish cycles is also at least a 2 year journey. I'll sell when the weather is bad 😅
Next up? Chocolate for sure...

Silver approaching key resistance barrierLooking at MARKETSCOM:SILVER , we can see that the price action is approaching the highest point of June. If that gets cleared, the next target might be the highest point of 2012. Let's dig in.
TVC:SILVER
Let us know what you think in the comments below.
Thank you.
77.3% of retail investor accounts lose money when trading CFDs with this provider. You should consider whether you understand how CFDs work and whether you can afford to take the high risk of losing your money. Past performance is not necessarily indicative of future results. The value of investments may fall as well as rise and the investor may not get back the amount initially invested. This content is not intended for nor applicable to residents of the UK. Cryptocurrency CFDs and spread bets are restricted in the UK for all retail clients.

What is Inflation Climate and Weather? Copper is NextThe key driver of most markets — and a major influence on their trends — is inflation.
Once we understand the difference between short-term inflation weather and long-term inflation climate, we can better recognize where risk meets opportunity.
On this half yearly chart. We can see as the close on 30th June, copper settled firmly, closed above its $4.44 resistance that has been tested for years.
This study indicates that copper could be at the beginning of an uptrend. I will be looking out for buying-on-dips opportunities whenever they arise.
Mirco Copper Futures
Ticker: MHG
Minimum fluctuation:
0.0005 per pound = $1.25
Disclaimer:
• What presented here is not a recommendation, please consult your licensed broker.
• Our mission is to create lateral thinking skills for every investor and trader, knowing when to take a calculated risk with market uncertainty and a bolder risk when opportunity arises.
CME Real-time Market Data help identify trading set-ups in real-time and express my market views. If you have futures in your trading portfolio, you can check out on CME Group data plans available that suit your trading needs www.tradingview.com

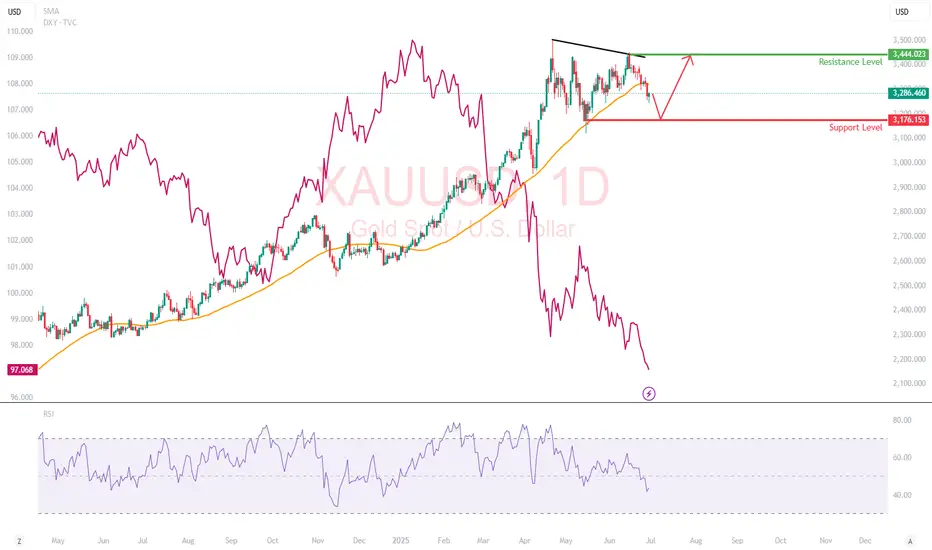
Gold in a Shifting Macro Landscape Fundamentals First: Why is Gold Falling While DXY is Too?
Normally, gold and the U.S. dollar share an inverse relationship (which means, when DXY weakens, gold rises). But recently, this correlation has broken down, and that divergence is a loud macro signal.
What’s Happening:
Trade Deal Optimism:
Headlines suggest the U.S. is nearing a resolution with China and other partners. With reduced geopolitical tension, investors are reallocating from safe-haven assets like gold into risk-on trades like equities and crypto.
Iran-Israel Ceasefire:
The temporary cooling of conflict has revived risk appetite. Traders are rotating out of war hedges (like gold and oil) and into tech, growth, and EM plays.
Real Yields Still Elevated:
Despite a softening Fed narrative, U.S. real yields remain positive, keeping pressure on non-yielding assets like gold. The fact that gold couldn't rally even as the 10-year note softened post-Moody's downgrade could be telling.
My Perspective:
This is the first clear signal in months that geopolitical hedging may have peaked. When gold decouples from its safe-haven narrative despite macro uncertainty, that often precedes a structural rotation phase, especially if institutional flows favor equities.
Technical Breakdown
Gold has broken below its 50-day SMA at $3,322 and is trading in the lower third of its 3-month range. While the daily candles show increasing selling pressure, especially on lower highs (a sign of weakening bullish momentum)
RSI : Falling toward 40, with no bullish divergence yet.
Support Level : $3,176: Previous swing low
Resistance Level : $3,444: previous swing high
What This Move Might Be Telling Us
When gold sells off on dollar weakness and geopolitical calm, the market isn’t just relaxing. It is rotating. The de-grossing of gold-heavy hedges: Some hedge funds may be taking profit on gold-heavy exposure from Q1’s rally.
Rise of risk appetite despite cracks: Markets are forward-pricing trade peace and earnings resilience, possibly too early. Gold might not be in trouble, but it’s on the bench. Unless something reignites fear (e.g., Fed policy mistake, Middle East flashpoint, or economic shock), capital may stay elsewhere.
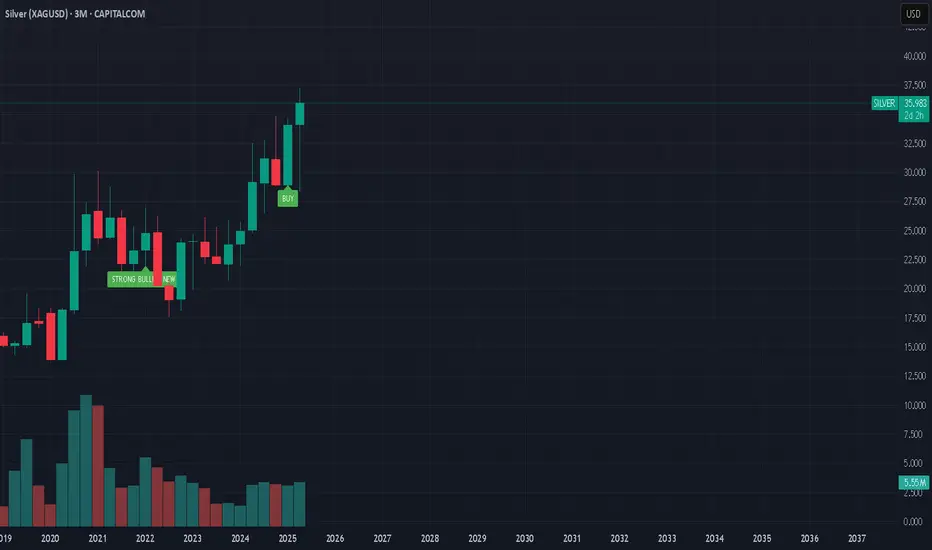
Silver-The Next Gold?The precious metals market is abuzz with a compelling question: Is silver poised to become the next gold? As gold continues its record-breaking ascent, investors and analysts are turning their attention to silver, which has demonstrated remarkable performance and potential in 2025. Let’s dive into the factors driving silver’s price, expert forecasts, and what the future may hold for this dynamic metal.
Silver’s 2025 Surge: Outpacing Expectations
Silver prices have surged impressively in 2025, recently trading above $34 per ounce—a 14% year-to-date increase that outpaces many other commodities. This rally is not just a speculative spike; it’s underpinned by robust fundamentals, including:
Gold’s record run, which historically pulls silver prices higher due to their strong correlation
Persistent supply deficits, with 2025 marking the fifth consecutive year of market shortfall
Soaring industrial demand, especially from the green technology and electronics sectors
Renewed safe-haven buying amid ongoing geopolitical and economic uncertainties
#commodity #silver #gold #xau #metals #finance #market #trading #portfolio #analysis
Cautious — this Chart is Slippery!Hello TradingView Family / Fellow Traders. This is Richard, also known as theSignalyst.
🛢️After surging by over 35% in the past two weeks, USOIL took a hit following Trump's announcement of a ceasefire between Iran and Israel.
However, from a technical perspective, USOIL is approaching a strong daily support zone marked in red.
As long as this support holds, the bulls remain in control.
📊The next bullish impulse will be confirmed upon a break above the last minor high marked in blue.
In such a scenario, a move toward the supply zone (also marked in red) would be expected.
📚 Always follow your trading plan regarding entry, risk management, and trade management.
Good luck!
All Strategies Are Good; If Managed Properly!
~Rich

Silver Long Setup–Breakout Retest After Clearing Key ResistanceSilver TVC:SILVER has broken above the $34.50 resistance level, as it looks to catch up to the gold/silver ratio. We’re now watching for a retest of this breakout zone at $34.00–$34.50 for a potential long spot entry.
📌 Trade Setup:
• Entry Zone: $34.00 – $34.50
• Take Profit Targets:
o 🥇 $37.50 – $40.00
o 🥈 $44.00 – $48.00
• Stop Loss: Daily close below $33.00

Why Soybean Oil Outperforms Crude Oil?From their recent lows, soybean oil has quietly crept up by 50%, while crude oil has risen by 40%. The reason goes beyond the recent renewal of tensions in the Middle East — it runs deeper than that.
Mirco SoybeanOil Futures
Ticker: MZL
Minimum fluctuation:
0.02 per pound = $1.20
Disclaimer:
• What presented here is not a recommendation, please consult your licensed broker.
• Our mission is to create lateral thinking skills for every investor and trader, knowing when to take a calculated risk with market uncertainty and a bolder risk when opportunity arises.
CME Real-time Market Data help identify trading set-ups in real-time and express my market views. If you have futures in your trading portfolio, you can check out on CME Group data plans available that suit your trading needs www.tradingview.com
Trading the Micro: www.cmegroup.com
www.cmegroup.com

What Is the Base Price for Oil?What is the base price for oil? Specifically, today we will discuss crude oil, and we can apply this understanding to other commodities as well.
I won't go into too much technical detail about the difference between the base price and the cost price for crude oil, but for most people, it helps to see the title as “Is there a bottom-line price or support level for crude oil?”
My answer is yes, and this is due to inflation. Over time, we tend to pay higher prices for food, gas and many others that we consume.
WTI Crude Oil Futures & Options
Ticker: MCL
Minimum fluctuation:
0.01 per barrel = $1.00
Disclaimer:
• What presented here is not a recommendation, please consult your licensed broker.
• Our mission is to create lateral thinking skills for every investor and trader, knowing when to take a calculated risk with market uncertainty and a bolder risk when opportunity arises.
CME Real-time Market Data help identify trading set-ups in real-time and express my market views. If you have futures in your trading portfolio, you can check out on CME Group data plans available that suit your trading needs www.tradingview.com
Trading the Micro: www.cmegroup.com
www.cmegroup.com

WTI oil has approached a key area of resistanceThe technical picture of WTI oil shows that the commodity is now near one of its key downside resistance lines. Could we get a break, or trendline will remain intact?
Let's dig in!
TVC:USOIL
MARKETSCOM:OIL
Let us know what you think in the comments below.
Thank you.
77.3% of retail investor accounts lose money when trading CFDs with this provider. You should consider whether you understand how CFDs work and whether you can afford to take the high risk of losing your money. Past performance is not necessarily indicative of future results. The value of investments may fall as well as rise and the investor may not get back the amount initially invested. This content is not intended for nor applicable to residents of the UK. Cryptocurrency CFDs and spread bets are restricted in the UK for all retail clients.

GOLD - Third Wave Next!Hello TradingView Family / Fellow Traders. This is Richard, also known as theSignalyst.
📈After breaking above the $3,330 structure, GOLD's momentum shifted to bullish again from a short-term perspective.
Moreover, the $3,310 is a strong demand as Gold made an explosive movement from it.
🏹 Thus, the highlighted blue circle is a strong area to look for buy setups as it is the intersection of support, demand and red trendline acting as a non-horizontal support.
📚 As per my trading style:
As #XAUUSD retests the blue circle zone, I will be looking for bullish reversal setups (like a double bottom pattern, trendline break , and so on...)
📚 Always follow your trading plan regarding entry, risk management, and trade management.
Good luck!
All Strategies Are Good; If Managed Properly!
~Rich
Disclosure: I am part of Trade Nation's Influencer program and receive a monthly fee for using their TradingView charts in my analysis.

Gold - Correction Phase Extended!Hello TradingView Family / Fellow Traders. This is Richard, also known as theSignalyst.
📈 As per our latest Gold analysis, price rejected the $3,100 – $3,150 support zone and traded higher.
However, Gold is still in a correction phase, moving within a falling red channel.
This week, it has been rejecting the upper bound of the channel, reinforcing bearish pressure.
⛔ As long as the upper red trendline holds, the bears remain in control.
✅ For momentum to shift back in favor of the bulls, a clear break above the upper red trendline is needed.
📚 Always follow your trading plan regarding entry, risk management, and trade management.
Good luck!
All Strategies Are Good; If Managed Properly!
~Rich
Disclosure: I am part of Trade Nation's Influencer program and receive a monthly fee for using their TradingView charts in my analysis.

#SUGAR The Sweet Life is Over. A Forecast for 2025-2040Hello colleagues!
Today (May 25, 2025), another article on food and the commodities market will be released, specifically focusing on sugar ICEUS:SB1! To all newcomers, welcome to my virtual den, where I dissect markets without rose-tinted glasses or any of that nonsense peddled by infogurus and mainstream analysts. This article will be long and a bit tedious, where we'll first need to quickly skim through the history of this commodity to identify the main pricing trends over the last ten centuries. Then, we'll somehow link old data and translate it into current money. And all this must first be done to understand the overall picture of the development of sugarcane and then beet sugar production, and to have at least some idea of how its price fluctuated, so that in the end, we can get a more or less objective analysis with a forecast for the next 10-15 years. In other words, to more clearly understand what awaits us in the future, we must first study the past. The text will be divided into three smoothly flowing parts:
📘 Historical Data
📊 Charts and Forecast for 2025-2040
📝 Geopolitical Scenario of Events
📖 So, let's go. A very brief history of the sugar industry over the last 1000 years:
◽️ 11th-15th Centuries (1000-1500): Spread from Asia and Medieval Europe
Origin in South Asia: Sugarcane was first cultivated in South Asia (likely India) long before this period. By the 11th century, the technology for producing unrefined sugar was relatively developed in this region. Sugar originated in South Asia, where, apparently, someone was so fed up with bland life that they decided to sweeten it. And so it began...
Spread to the Middle East and Mediterranean: Arab conquests facilitated the spread of sugarcane and its processing technologies to the Middle East, North Africa, and some regions of the Mediterranean (e.g., Sicily and Spain).
Rare and Expensive in Europe : In medieval Europe, sugar remained a rare and extremely expensive commodity, accessible only to nobility and wealthy merchants. It was primarily used as a spice and medicine. Sugar trade was controlled by Arab and Italian intermediaries. Sugar was so valuable that it was not only eaten but also used as medicine. Probably, out of a sense of its own importance.
◽️ 16th-18th Centuries (1500-1800): Expansion into the New World and the Era of Slavery
Transfer of Production to America: European colonizers began actively developing sugarcane plantations in the tropical and subtropical regions of the New World (Caribbean, Brazil). Europeans realized sugar wouldn't grow in the Old World and decided to create their "sweet El Dorado" in the New World. With other people's hands, of course.
Key Role of Slavery: Sugar production was closely linked to the transatlantic slave trade. Vast numbers of Africans were forcibly transported to colonies to work on plantations. Brutal working conditions were the norm. Slavery and sugar – these were the two inseparable "partners" of that era. Sweetness was built on others' bitterness.
Caribbean – Production Hub: The Caribbean islands became the main global center for sugarcane production. Sugar expansion went hand in hand with colonial expansion. Europeans weren't just discovering new lands; they were looking for more places to plant this damn cane.
High Value of Sugar: Sugar remained an expensive and prestigious commodity, mainly accessible to the upper echelons of society in Europe. It was used as a sweetener, spice, and even medicine.
Increased Accessibility in Europe: Increased production in the colonies made sugar more accessible in Europe, though it still remained relatively expensive.
Discovery of Beet Sugar: In the 18th century, sucrose was discovered in sugar beet, laying the groundwork for an alternative source.
◽️ 19th Century (1800-1900): The Beet Sugar Revolution and Abolition of Slavery
Triumph of Sugar Beet: A key development was the growth and spread of sugar production from sugar beet in Europe. The discovery by chemist Andreas Marggraf in the 18th century and subsequent developments led to the creation of industrial technology. This allowed European countries to reduce their dependence on colonial cane sugar. Beet replaced cane like diesel replaced steam — less romantic, but far more efficient. Colonial planters gnashed their teeth.
Abolition of Slavery: Throughout the 19th century, slavery was gradually abolished in most colonies, leading to changes in labor organization on cane plantations. The abolition of slavery, of course, was an act of humanitarianism, but it also hiked production costs. Free labor, you know, costs money.
Increased Production and Price Decline: Thanks to beet sugar, overall global sugar production increased significantly, leading to a gradual decline in prices and making it more accessible to broader segments of the population.
Development of Transport Infrastructure: The construction of railways and steamships facilitated the transportation of both cane and beet sugar.
Emergence of the Sugar Industry: Large sugar factories and companies specializing in sugar production and trade were formed.
◽️ 20th-21st Centuries (1900-Present): Globalization, Technologies, and New Challenges
Market Globalization: Global sugar trade became intensive, and international agreements emerged.
Development of Agrotechnologies: Mechanization, variety selection, and fertilizers dramatically increased yields.
Dominance in the Food Industry: Sugar became a key ingredient in the production of a vast number of food and beverage products. Today, sugar is crammed everywhere – from ketchup to bread. Apparently, manufacturers believe our lives aren't "sweet" enough without it.
Consumption Growth: Sugar became an integral part of diets in many countries, used in the food industry to produce a huge variety of products.
Focus on Sustainability and Health: Modern trends include combating overconsumption, seeking sustainable production methods, and developing the market for alternative sweeteners.
◽️ 21st Century (2000-Present): New Trends and the Future
Combating Overconsumption: Governments and health organizations in many countries introduce measures to limit sugar consumption (e.g., taxes on sugary drinks, product labeling). Combating overconsumption? That's like tobacco companies releasing "light" cigarettes. Hypocrisy in its purest form.
Growing Demand for Natural Sweeteners: Consumers show greater interest in natural sugar alternatives such as stevia, erythritol, xylitol.
Market Volatility: Sugar prices remain subject to fluctuations due to weather conditions, political factors, and changes in global supply and demand.
Biotechnologies: Research in biotechnologies may lead to new ways of producing sugar or its substitutes.
📌 Summary: Over the last 1000 years, sugar has come a long way from a rare Eastern spice to one of the most common commodities in the world, playing a significant role in the history of trade, colonization, slavery, and the development of the food industry. Today, the industry faces new challenges related to consumer health and production sustainability. Corporations first cram us with sugar, and then preach about a healthy lifestyle. Funny, isn't it? This brief history shows how the sugar industry has gone from an exclusive colonial commodity produced by slave labor to a global industry with many players and challenges.
⬜️ We've covered the very condensed history of sugar production and the general development of the global sugar industry. Now, for a broader understanding, it's also useful to know how pricing has changed over the last few centuries. Over the past 400 years, sugar prices have undergone significant fluctuations influenced by many historical events. Here are the key moments that had a substantial impact:
Era of Colonialism and Slave Trade (16th-19th centuries). Expansion of Plantations in the New World and Reduction of Production Costs and Prices: From the 16th century, European powers actively developed sugarcane plantations in their colonies in the Caribbean and South America. The massive influx of cheap (virtually free) slave labor from Africa led to a significant increase in sugar production. Mass production using slave labor made sugar more accessible in Europe, though it still remained a relatively expensive commodity.
Napoleonic Wars (early 19th century). Disruptions in Cane Sugar Supplies and Development of Beet Sugar: Conflicts in Europe disrupted maritime trade routes and sugar supplies from colonies. The need for alternative sources led to the active development of sugar production from sugar beet in continental Europe. This was an important step towards reducing dependence on cane sugar and laid the groundwork for future price reductions.
Abolition of Slavery (19th century). Increased Production Costs: The gradual abolition of slavery in the colonies led to increased labor costs on cane plantations, which could temporarily raise prices. However, it also stimulated the search for more efficient agricultural methods.
Development of Production and Transportation Technologies (19th-20th centuries). Mechanization, Variety Selection, Agrotechnologies, and Transport Improvement: The introduction of steam engines and other equipment in sugar mills and on plantations significantly increased production efficiency. The development of railways and steamships made it easier and cheaper to transport sugar both within countries and between continents, contributing to price reduction. Improvements in sugarcane and beet varieties, as well as the development of agronomic methods, led to increased yields.
World Wars (20th century). Government Regulation and Disruptions in Production and Trade : Both World War I and World War II disrupted agricultural production, transport networks, and international trade, leading to shortages and rising sugar prices. During wars, governments often imposed price controls and rationing of sugar.
Government Policy and Trade Agreements (20th-21st centuries). International Sugar Agreements, Subsidies, and Tariffs: Government support for domestic sugar beet producers and the imposition of import tariffs on cane sugar in several countries artificially maintained higher prices in the domestic market. Attempts to regulate the global sugar market through international agreements had mixed success but influenced price stability.
Changes in Supply and Demand (20th-21st centuries). Consumption Growth, Weather Conditions, and Ethanol Production Development: Increased global population and changing dietary habits (growing consumption of processed foods and beverages) led to increased demand for sugar. Droughts, floods, and other adverse weather events in key producing regions can significantly reduce harvests and cause sharp price increases. In Brazil, a significant portion of sugarcane is used for ethanol production. Changes in oil demand and prices can affect sugar production volumes and, consequently, its price.
Emergence of Sugar Substitutes and Changes in Consumer Preferences (late 20th - early 21st century): Increased awareness of the harm of excessive sugar consumption led to a growing demand for alternative sweeteners, which can have a dampening effect on sugar price increases. Consumers' growing desire for healthier lifestyles and reduced sugar consumption may, in the long term, affect demand and prices.
◻️ These key historical moments illustrate the complex interplay of political, economic, social, and technological factors that have shaped the price of this important commodity over centuries. So, from the above factors, we can identify general trends:
1200-1500s: During these centuries, sugar in Europe was an exotic import, mainly from the Middle East and Mediterranean regions. It was a luxury item, costing very dearly in relation to precious metals like silver. The amount of sugar one could buy for an ounce of silver was negligible.
1500-1600s: With the beginning of sugarcane cultivation in the New World, especially by the Portuguese and Spanish, sugar supply in Europe gradually increased. However, it remained relatively expensive.
1600-1700s: The expansion of sugar plantations in the Caribbean, based on slave labor, led to a more significant increase in sugar production and availability in Europe. This era likely marked a more noticeable decline in sugar's price relative to silver compared to previous centuries. Research shows that in the latter part of this period, especially in places like London and Amsterdam, more detailed price records, expressed in silver weight per kilogram of sugar, began to appear.
1700-1800s: The trend of increasing sugar production and declining relative price likely continued into the 18th century. The growth of colonial economies, largely based on sugar production, made it more accessible.
1800-1900s: The 19th century witnessed the rise of beet sugar production in Europe and further expansion of cane sugar cultivation. This led to a significant drop in sugar prices relative to precious metals. Silver retained its value, while sugar became a mass-market commodity. By the end of this period, a significant amount of sugar could be bought for an ounce of silver compared to earlier centuries.
2000s: In the modern era, sugar is a widely produced and relatively inexpensive commodity. The amount of sugar that could be bought for an ounce of silver would be very substantial compared to any of the earlier periods.
The general trend shows a sharp decline in the relative price of sugar to silver over recent centuries, from an extremely rare and expensive commodity to a widely available one. The most significant shifts occurred after the colonization of America and the rise of beet sugar production.
⬜️ So, to get at least some approximate idea of changes in sugar prices over the past few centuries, let's try to mentally exchange weight for weight, i.e., exchange the commodity – SUGAR – for eternal real money – SILVER. To do this, we need to extract historical data on sugar price changes on the London and Amsterdam exchanges from 1650 to 1820.
For analysis, I've used a chart of refined sugar , which is more stable and shows prices in London and Amsterdam from 1650 to 1820, expressed in grams of silver per kilogram of sugar . That is, the chart shows how many grams of silver one kilogram of sugar cost. If you carefully study the chart, you can conclude that the price of refined sugar in London from 1650 to 1790 was relatively stable, fluctuating around 10-15 grams of silver per 1 kg of sugar. In such cases, one could say that 1 kg of sugar in London cost 0.3-0.5 ounces of silver. Let's convert this to current money:
🧮 Conversion to ounces:
One ounce contains 31.1035 grams of silver.
If 1 kg of sugar cost 10 grams of silver, that is 10 / 31.1035 ≈ 0.32 ounces of silver per 1 kg of sugar.
If 1 kg of sugar cost 15 grams of silver, that is 15 / 31.1035 ≈ 0.48 ounces of silver per 1 kg of sugar.
🧮 Conversion to current money:
As of today, the price of one ounce of silver is approximately 33 US dollars.
If 1 kg of sugar cost 0.32 ounces of silver, then in current money terms, it would be 0.32 * 33 ≈ 10.56 US dollars per 1 kg of sugar.
If 1 kg of sugar cost 0.48 ounces of silver, then in current money terms, it would be 0.48 * 33 ≈ 15.84 US dollars per 1 kg of sugar.
Summary: Based on the assumption that in the 1700s, 1 kg of refined sugar in London cost, on average, between 10 and 15 grams of silver, and using the current silver price, one can roughly estimate the cost of 1 kg of sugar in London to be equivalent to approximately $10.56 to 15.84USD, which is very expensive compared to the current 0.40/kg. It is important to emphasize that this is a very rough estimate and it does not account for many factors, such as:
Purchasing power of silver in the 1700s: Silver had a completely different purchasing power 300 years ago compared to today.
Gold to silver ratio: Today, the gold to silver ratio is much higher than in the 18th century, and for the last 20 years, it has fluctuated around ⚖️70-100:1, compared to when it was around ⚖️15:1 then. This indicates that silver is 5-6 times cheaper relative to gold now than it was in the 1700s-1800s.
Quality of sugar: Refined sugar 300 years ago might have differed in quality from modern sugar.
Regional differences: Prices could vary significantly in different parts of the world.
Transportation costs and taxes: These factors could significantly affect the final price of sugar.
Nevertheless, the calculation provides some insight into how expensive refined sugar was in those times compared to today, when it has become a much more accessible commodity.
◻️ Let's continue. Analyzing these two historical charts, it's also worth commenting on the jump in the price of refined sugar on the London exchange during the Napoleonic Wars (early 1800s) to around 20 grams of silver per 1 kg of sugar. Based on historical contexts and general trends of commodity markets during wars, it's important to say that military conflicts often lead to disruptions in trade routes, commodity shortages, and, as a consequence, rising prices. Now let's convert the maximum price of those distant times into current money:
🧮 Price in silver: 20 grams per 1 kg of sugar.
Conversion to ounces: 20 grams / 31.10 grams/ounce ≈ 0.64 ounces of silver per 1 kg of sugar.
Conversion to US dollars (at current silver price): 0.64 ounces * $33/ounce ≈ $21.22 US dollars per 1 kg of sugar.
📌 Thus, if we assume that the price of refined sugar in London during the Napoleonic Wars indeed rose to 20 grams of silver per 1 kg, then in current money terms, this would amount to approximately $21 US dollars per 1 kg of sugar. Consequently, the conclusion about a range of $20-23 US dollars per 1 kg of sugar in current money for peak prices during the Napoleonic Wars seems quite reasonable, based on the analysis of the historical chart and the current silver price. This once again emphasizes how expensive sugar was in those times compared to today. And here, we won't even attempt to fairly equalize the cost of sugar further by adjusting the silver to gold ratio to its normal historical values of ⚖️20:1, as that would then require multiplying $20-23 US dollars by another five times. The gold/silver ratio of 100:1 today is a slap in the face of history, when silver was valued much higher. This is another sign of the impending revaluation of everything! But nonetheless, we can make a modest mark on the current price chart, where approximately $23 is the ATH (all-time high) since the early 1800s.
⬜️ Silver is noble, of course, but let's come down to earth and look at prices in the currency we (still, for now) all pay with 💵💶. Another historical chart I found online (on Trading Economics) provides a historical chart of sugar prices from 1912 to the present, displaying data in cents per pound. Evaluating sugar prices in US dollars since the creation of the Federal Reserve System (Fed) is more justified than theoretical calculations with conversions to current money, and for good reasons. Here's why:
1. Objectivity of historical data in US dollars:
▫️ Actual market prices: The chart displaying prices in cents per pound from 1912 to the present represents a record of actual market prices that prevailed in the US during that period. This data reflects the real supply and demand relationship, as well as the impact of various economic and political events at that time.
▫️ Avoiding conversion problems: Converting old prices in grams of silver to modern dollars involves many complexities and assumptions related to changes in currency purchasing power and the relative value of commodities over centuries. US dollar data, recorded at that historical moment, is a more direct reflection of sugar's value in the economy of that time.
2. Significance of the US dollar after the Fed's creation:
▫️ Currency stabilization (relatively): The Federal Reserve System was created in 1913 to ensure the stability of the US financial system. Although the US dollar has experienced inflation and devaluation since its creation, its value has been more centrally regulated compared to previous periods when the banking system was more decentralized and prone to panics.
▫️ World reserve currency: The US dollar gradually became the world's reserve currency, especially after World War II. This makes prices expressed in US dollars more significant for understanding global trade and the value of commodities, including sugar, in the long term.
▫️ Data comparability: Using the US dollar as a single currency to track prices over a long period (from 1912 to the present) ensures better data comparability and allows for a clearer view of the real dynamics of sugar prices within one economic system.
3. Limitations of theoretical calculations:
▫️ Changing purchasing power: Converting prices expressed in silver weight in the 1700s to modern dollars using the current silver price does not account for the vast changes in the purchasing power of both silver and the dollar over the past centuries. Silver in the 18th century might have had a completely different value relative to other goods and services than it does today.
▫️ Different economic systems: The economic systems of the 18th and 21st centuries differ fundamentally. Comparing prices directly, based solely on the current exchange rate, is incorrect, as it doesn't account for living standards, average incomes, the cost of other goods and services, etc.
▫️ Sugar market specifics: The sugar market over the past centuries has undergone enormous changes in production, trade, regulation, and consumption. Theoretical conversions cannot always adequately reflect these transformations.
📌 Conclusion: Using historical data on sugar prices, expressed in US dollars since the Fed's creation, is indeed a more objective and justified approach for analyzing the long-term dynamics of this commodity's prices in the American and global economy. This data reflects actual market conditions and avoids many complexities and assumptions associated with converting prices from other currencies or commodity equivalents (e.g., silver) into modern dollars. In short, today, trusting old prices in silver is like trying to understand Bitcoin's exchange rate from Sumerian tablets. Dollar data is at least somewhat anchored to the reality of the last hundred years. But nonetheless, all these data provide a general overview and a broader understanding of sugar price fluctuations over the past 300 years, and the closer the data is to our time, the more accurate and objective it is.
📈 Chart: La dolce vita è finita
Okay, enough digging in the dust of centuries. Let's look at live charts where the past screams about our future! I tried to combine a linear historical chart showing the price in cents per pound with a logarithmic chart of ICEUS:SB1! So, first, we need to highlight the following: from 1912 onwards, there was generally a decline in sugar prices, where from peak values of around 20 cents per pound of sugar in 1919, the price decreased for a long time, reaching a minimum in 1966 at 1.3 cents. In half a century, from 1919 to 1966, sugar prices fell by -93%, after which they began to reverse (correct) upwards. Then, from 1966 to 1974, the price surged by +4000%, meaning that in just eight years, the price rose 40-fold from its 1966 lows to its 1974 highs. This wave of growth, within the framework of Elliott Wave Theory, should be regarded as the first corrective wave (A) .
Next, from 1974 to the present day, a narrowing sideways consolidation has been developing, which can safely be interpreted as a wave (B) triangle . Roughly speaking, for the last 50 years, sugar prices have been "marinating" in a narrowing sideways range, which is highly likely to complete the formation of all internal waves in 2025-2026.
After which, another explosive wave of growth within wave (C) of the presumed corrective zigzag, developing since 1966, should be expected, with targets around three dollars per pound of sugar. For the expected sharp rise à la 1966-1974, a time frame up to 2040 is allocated, i.e., 15 years, but the price surge could happen faster. The broad range highlighted above, $1-5 per pound of sugar, is an approximate target to aim for over a 10-15 year horizon. In other words, over the next 10-15 years, a sharp jump in sugar prices of approximately +1000-2000%, or 10-20 times, should be expected.
📈 Additional analysis of Cocoa and Coffee charts
Few people today realize that we are entering a new 10-20 year supercycle of growth in the commodity sector and a decline/sideways movement in the high-risk stock market. And as examples to my assertion that "the sweet life" is over, it's worth considering two additional commodity charts: specifically, cocoa and coffee. These three commodity charts: ICEUS:SB1! , ICEUS:CC1! and ICEUS:KC1! , traded since the 1970s-1980s, are very similar in their wave structure, which can all be equally marked as a large 40-50 year narrowing sideways consolidation.
The main difference is only that the price of cocoa has already sharply surged upward from its forty-year sideways range by +480% since late 2022, while the price of coffee is only trying to consolidate above its resistance zone, which began forming in 1977. Since early 2024, coffee prices have also shown an explosive growth of +200%.
These two commodity charts indirectly indicate the future direction for sugar prices as well. But as always, there's a small "but." Locally, within a year or year and a half (2025-2026), against the backdrop of officially recognized recession, stock market collapse, liquidity problems in the eurodollar system, and economic downturn in developed Western economies, a correction in the food commodity market of -30-40% should first be expected. Only after the money printer is turned on (QE), can we confidently expect a new wave of growth across the entire commodities market and a new wave of inflation, respectively.
Coffee and cocoa have already shown which way the wind is blowing. Sugar is next on the runway. The rise in coffee, cocoa, and sugar prices, and indeed the expected wave of price increases in the commodities market in general, should not be viewed as a local and seemingly unrelated increase in the prices of food commodities, raw materials, and precious metals against the US dollar, but rather as the depreciation of money in an era of global debt crisis culmination, geopolitical instability, high inflation, and the reformatting of the old liberal world order. With the transition to a new digital economy, a new currency world, and a new world order.
📈 Analyzing the Main Chart
Let's move on. Now it's time to switch to more familiar units of measurement and weight for residents of Europe. For this, the main live chart presented displays the price of sugar in dollars per kilogram. On this chart, for a general understanding of price dynamics, we should mark two points: 1800 and 1966. To determine the minimum price in 1966, let's solve a small problem:
🧮 We know that the minimum price in 1966 was 1.3 cents per 1 pound.
1 pound = 0.4535 kilograms.
First, let's find the cost of 1 kg in cents:
1.3 cents / 0.4535 kg ≈ 2.86 cents per kg.
Now, let's convert cents to dollars:
2.86 cents / 100 = 0.0286 dollars per kg.
Thus, 1.3 cents per pound is equivalent to approximately 0.0287 dollars per kilogram of sugar in 1966.
So, let's establish this: around 1800, the price of refined sugar on the London exchange reached its peak (ATH), which is equivalent to approximately $21-23 US dollars per 1kg when converted to current money. And in 1966, the minimum price for sugar in the USA was a pproximately $0.03 per 1kg . Thus, two important time points with approximate prices have been determined:
📍 1800 (ATH): ≈ $23 per 1 kg
📍 1966 (minimum): ≈ $0.03 per 1 kg
📍 2025 (present): ≈ $0.40
This shows a colossal difference in sugar prices over this period, reflecting changes in production, trade, accessibility, and the purchasing power of money. Sugar, from a relatively expensive commodity in the early 19th century, became significantly cheaper by the mid-20th century.
◻️Now, let's solve one last problem that will finally put all the pieces together: how much did one kg of sugar cost in grams of silver in 1966, and how much does it cost today? So:
🧮 Calculating the cost of 1 kg of sugar in grams of silver in 1966:
The price of sugar (SB1) in 1966 was 1.3 cents/pound or ∼0.03 per 1 kg.
The price of silver (XAG) in 1966 was 1.30 per ounce.
1 ounce of silver = 31.10 grams.
If 31.1 grams of silver cost 1.30, then 1 gram of silver cost 1.30/31.1 grams≈0.041 $/gram.
How many grams of silver could you buy for 0.03 (the cost of 1 kg of sugar)?
0.03$/0.041$/gram≈0.7177 grams of silver.
Summary: If in 1966, 1 kg of sugar cost $0.03, and silver was $1.30 per ounce, then 1 kilogram of sugar cost approximately 0.72 grams of silver . In any case, 0.72 grams of silver per kilogram of sugar is extremely low compared to historical prices of 10-20 grams of silver per kilogram. This only strengthens the argument about how drastically the price of sugar plummeted by the mid-20th century when measured in (real money) grams of silver. Let's move on; now we'll find out how many grams of silver 1 kg of sugar costs today:
🧮 Calculating the cost of 1 kg of sugar in grams of silver today:
Price of silver (XAG): $33 per ounce.
Price of sugar (SB1): 17.5 cents per pound or ≈0.38/kg.
1 ounce of silver = 31.10 grams.
If 31.10 grams of silver cost $33, then 1 gram of silver costs: 33$/ounce/31.10 grams/ounce≈1.061 $/gram.
How many grams of silver can be bought for 0.38 (the cost of 1 kg of sugar)?
Cost of 1 kg of sugar in grams of silver: 0.38$/kg/1.061$/gram≈0.36 grams of silver/kg.
Final Conclusion: In 1966, 1 kilogram of sugar cost approximately 0.72 grams of silver. Today, at current prices (May 2025), 1 kilogram of sugar costs approximately 0.36 grams of silver. Paradox! It turns out that even now, after the rise in sugar prices in dollars, 1 kg of sugar still costs significantly less silver (by weight) than in 1966. Okay, let's mark this important historical moment!
🔀The Sugar Price Phenomenon: Dollars VS Silver
In US dollars: From 1966 (when the price was $0.03/kg) to today (approximately $0.38/kg), sugar has risen by more than +1000% or twelve times, which seems like an enormous increase.
In grams of silver: But over the same period, sugar has fallen by half, from 0.72 grams of silver in 1966 to 0.36 grams of silver per 1kg of sugar today.
Thus, important time points for the ⚖️silver/sugar ratio are defined:
📍 1800: ≈ 20 grams of silver per 1 kg
📍 1966: ≈ 0.72 grams of silver per 1 kg
📍 2025: ≈ 0.36 grams per 1 kg of sugar
❓ What does this mean?
This contrast is a powerful argument showing that the nominal price increase in US dollars is, in essence, nothing more than the depreciation of the dollar itself ! While the real value of sugar, measured in precious metal (which has maintained its purchasing power for centuries), has actually fallen. This further reinforces the idea of how "undervalued" sugar is historically; it remains extremely cheap compared to its purchasing power in silver in 1966. Furthermore, all these examples demonstratively highlight how severely silver is undervalued today and how distorted the ⚖️silver to gold ratio is, as well as how perverted the weight-for-weight barter valuation has become—that is, the exchange of real commodity sugar for real silver weight, without the involvement of cut green paper 💵 or zeros on screens 💳.
📌Conclusion of the Second Part of the Article
We can confidently state that from $\sim$1800, the cost of sugar continuously declined, reaching its bottom in 1966 at 3 cents per 1kg. Now, the 1966 minimum can be considered the starting point from which the price surged by $\sim$5000%, establishing a maximum at the end of 1974 at $1.45 per kilogram of sugar. This entire rise should be interpreted as wave (A) of a large correction to the decline from 1800. For the next 50 years, the price was confined in a sideways consolidation, which should be interpreted as a massive triangle within wave (B), whose internal structures are almost fully complete. This "sweet slumber" lasting half a century is coming to an end.
In the next 10-15 years, a sharp breakout upwards from this narrowing consolidation should be expected, with targets around $5 per kilogram of sugar. The expected sharp price increase from 2025-2026, from $0.30 into the $3-10 range—that is, by +1000-3000%—will be considered wave (C) of the large correction that began in 1966. In other words, after a prolonged 150-year wave of declining sugar prices (from $\sim$1800 to 1966), a counter-trend upward movement began in 1966 as part of a correction to the decline, whose final targets are roughly forecasted around five dollars by 2040, which would collectively amount to 70-80 years of growth from the 1966 minimum, if the entire growth from 0.03 is considered within the framework of a correction to the decline from the 1800 ATH.
Based on all of the above, we can move on to the forecast for the next 10-15 years. The rise in sugar prices from 1966 can be seen as the end of the "sweet life," where after the first wave of growth from 0.03 to 1.45—a 40-fold increase—a fifty-year lull followed, depicted on the chart as a narrowing triangle. Next, we should expect a sharp uncoiling of this "spring" that lasted half a century, with prices soaring from approximately $0.30 per 1kg into the range of $5 US dollars. The highlighted range of $3 to $10 above is the projected long-term target for where the price will head in the future.
📊 Geopolitical Forecast for 2025-2040
Forecasts are thankless, but the current situation leaves no doubt: sugar prices will skyrocket! So-called "climate change", rising inflation, and geopolitical bacchanalia are the perfect catalysts for a price explosion between 2025 and 2040, mirroring the dynamics observed in 1966-1974. The global sugar market is known for its volatility, and several potential triggers could cause significant price surges. Given the escalating factors of uncertainty, such as the global debt crisis, rising inflation and unemployment, the conduct of a hybrid World War III proxy war, the probable blockage of maritime trade routes, new pandemics, "climate change," and so on, the likelihood of sharp sugar price increases in the coming decades appears very high.
◻️ Possible Triggers and Causes:
Climate Change and Extreme Weather Events: Droughts, floods, hurricanes, and other extreme weather events can severely damage sugarcane and sugar beet crops in key producing regions (Brazil, India, Thailand, EU). Climate change can lead to long-term shifts in weather patterns, making sugar production more unstable. Mother Nature, or whoever controls the weather, clearly decided not to be bored.
Geopolitical Instability and Conflicts: Wars, regional conflicts, and political instability in producing countries or transit regions can disrupt supply chains and lead to sugar shortages in the global market. Sanctions and trade wars can limit sugar exports from key countries. When cannons speak, logistics go silent. And prices rise.
Energy Crisis and Oil Prices: A sharp rise in oil prices can increase the cost of sugar production and transportation. Higher oil prices can also stimulate ethanol production from sugarcane, especially in Brazil, leading to a reduction in sugar supply for the food industry.
Global Demand Growth: Continued global population growth, especially in developing countries, can increase demand for sugar. Changes in dietary habits and increased consumption of processed foods also contribute to rising demand.
Supply and Logistics Problems: Pandemics or other global crises can disrupt port operations, transport networks, and supply chains, leading to delays and increased costs for sugar delivery.
Government Policies and Trade Restrictions: Changes in government policy, such as the introduction of export restrictions, increased import tariffs, or the abolition of subsidies, can affect world sugar prices.
Plant Diseases, Mold, and Pests: The spread of new diseases and pests resistant to existing control methods, as well as prolonged "traffic jams" at sea, can lead to significant crop losses and spoilage of goods.
Market Speculation: The activity of large speculative funds can amplify price fluctuations in the sugar market, especially in conditions of uncertainty. And of course, let's not forget our "friends" the speculators, who won't miss a chance to throw fuel on this inflationary fire.
◽️ Currently, the top 10 global sugar producers are:
Brazil: Traditionally the largest producer and exporter of sugar in the world. Sugar production in Brazil is closely linked to ethanol production from sugarcane.
India: In recent years, India has also risen to a leading position in sugar production, even surpassing Brazil in some years. India is also a major consumer of sugar.
European Union: The combined production of EU countries makes it a significant player in the global sugar market, mainly from sugar beet.
China: A major producer but also a large importer of sugar due to high domestic demand.
Thailand: Holds an important place among the largest global sugar exporters.
USA: Sugar production in the US comes from both sugar beet and sugarcane.
Pakistan: A significant sugar producer, primarily from sugarcane.
Russia: The main sugar production comes from sugar beet.
Mexico: An important sugar producer and exporter.
Australia: A major producer and exporter of cane sugar.
◽️ Key Points:
Global Production: World sugar production fluctuates around 170-190 million tons per year.
Traded Market: Approximately 30-40% of total world sugar production is traded on the global market. This traded portion is almost exclusively transported by sea for international deliveries.
Major Exporters: Countries like Brazil and Thailand, being leading exporters, ship the vast majority of their export volumes by sea.
◽️ Approximate Estimate:
Given that approximately 30-40% of global production enters the international trade market, and the primary method for international transportation of large volumes of raw materials is sea transport, we can assume that approximately 30-40% of all produced sugar is transported by sea.
🚢 Blocking maritime trade channels can have a significant impact on sugar delivery and its price, as, as we have already discussed, a significant portion of the world's sugar is transported by sea. Here are the main consequences:
Impact on Sugar Delivery:
▫️ Supply Delays: Blocking key maritime routes will lead to significant delays in sugar delivery from exporting to importing countries. This will disrupt established logistical chains.
▫️ Route Diversion: Ships will have to seek alternative, longer sea routes. This will increase transit times and, consequently, the delivery times for sugar to consumers.
▫️ Increased Transportation Costs: Longer routes mean higher fuel consumption, increased insurance premiums (especially in high-risk areas), and possible additional charges for passage through alternative channels.
▫️ Risk of Cargo Spoilage: Increased transit time can raise the risk of sugar spoilage, especially under improper storage conditions or adverse weather.
▫️ Reduced Availability: Delays and disruptions can lead to a temporary decrease in sugar availability in importing countries' markets.
Impact on Sugar Price:
▫️ Price Increase: Increased transportation costs will inevitably lead to higher prices for imported sugar. These costs will be passed on to wholesalers and retailers, and ultimately to consumers.
▫️ Supply Shortage: Supply delays and reduced sugar availability can create shortages in markets, which will also contribute to price increases. Speculators may exploit the situation, further driving up prices.
▫️ Market Volatility: The blocking of trade routes will create uncertainty in the market, leading to increased volatility in sugar prices.
▫️ Regional Price Differences: Depending on which maritime channels are blocked and which countries face the most significant supply difficulties, sugar prices can vary significantly in different regions of the world. Countries heavily dependent on imports through blocked channels will suffer the most.
▫️ Impact on the Food Industry: Rising sugar prices will impact food and beverage manufacturers who use sugar as a primary ingredient. This could lead to increased prices for finished products or the search for cheaper alternatives (e.g., artificial sweeteners).
⚓️ Examples of Critical and Key Maritime Channels:
Suez Canal: The most important route connecting Asia and Europe. Blockage could cause serious delays in sugar supplies from countries like India and Thailand to Europe and the Mediterranean. Remember the farce with the Ever Given in March 2021? That was just a rehearsal.
Strait of Malacca: A key strait for shipping goods from the Indian Ocean to the Pacific Ocean, including sugar from Thailand and Australia to China and other East Asian countries.
Panama Canal: Important for trade between the Atlantic and Pacific Oceans, affecting sugar supplies between North and South America.
Bab-el-Mandeb Strait and the Red Sea: Recently, this region has become an area of increased instability, and blockage or threats to shipping can affect sugar supplies through this important route.
Summary: The blocking (in bottlenecks) of global maritime trade channels can have serious negative consequences for sugar delivery, leading to delays, increased costs, and reduced availability, which in turn will cause a significant increase in prices in the global market. In short, the more global chaos, the sweeter life will be for sugar owners, and the more bitter for everyone else.
◻️ Scenario: Military Conflict between India and Pakistan (2025-2030)
In addition to the already described factors of geopolitical instability and climate change, a full-scale or prolonged military conflict between India and Pakistan could have a significant and multifaceted impact on global sugar prices, becoming a powerful additional trigger for their rise. As if we didn't have enough other problems, right?
Impact on Sugar Production:
▫️ Production Disruption in Key Regions: Both states are major producers of sugarcane. Military actions can directly disrupt agricultural work, the logistics of harvesting and transporting crops in border regions that may be important for sugarcane cultivation.
▫️ Resource Diversion: Military needs can lead to the diversion of financial and material resources from agriculture, including sugar production (e.g., fuel, labor, fertilizers).
▫️ Population Migration: Conflict can cause mass migration of populations from combat zones, leading to labor shortages on plantations and processing plants.
▫️ Infrastructure Destruction: Combat operations can damage or destroy key infrastructure related to the sugar industry, such as roads, railways, bridges, ports, and sugar factories.
Impact on Trade and Logistics:
▫️ Disruption of Regional and Global Supply Chains: Given India and Pakistan's strategic location and their role in regional trade, conflict could disrupt broader logistics chains in Asia, including maritime routes used to transport sugar from other countries (e.g., Thailand) to East Asia and beyond. War is the best way to create a global shortage.
▫️ Closure or Restriction of Transport Corridors: Hostilities could lead to the closure or restriction of key land and sea transport corridors used for transporting raw materials, including sugar, resulting in delays, increased transport costs, and insurance premiums.
▫️ Increased Risks for Shipping: Military presence in regional waters could increase risks for commercial shipping, including vessels carrying sugar, leading to higher freight and insurance costs.
Impact on the World Market:
▫️ Reduction in Global Supply: The combined reduction in production and disruption of exports from India and Pakistan, as major producers, will lead to a reduction in the overall global sugar supply.
▫️ Increased Speculation: Military instability in a region affecting major food producers will cause concerns in global markets and trigger speculative sugar purchases, further fueling price increases.
▫️ Increased Price Volatility: The uncertainty caused by military conflict will lead to sharp fluctuations in sugar prices on global commodity exchanges.
▫️ Regional Imbalances: Countries dependent on sugar imports from India or through regional logistics chains may face shortages and sharp price increases in their domestic markets.
◻️ Scenario: Recession, Market Collapse, and Monetary Inflation as a Factor in Rising Sugar Prices (2025-2030) – Or how economic "saviors" will gut your wallet.
There are strong reasons to believe that in 2025-2026, Western economies will finally officially enter a recession, which will be accompanied by a sharp collapse in stock markets. In response, regulators (central banks such as the Fed, ECB, and Bank of England) will take decisive measures: sharply cut interest rates and launch quantitative easing (QE) programs, effectively turning on the "money printing press." Although initially, these measures aim to stabilize the financial system and stimulate the economy, they could trigger a new wave of monetary inflation between 2026 and 2030, putting additional pressure on sugar prices. And this inflation, as always, will fall on the shoulders of ordinary mortals addicted to sweets.
Initial Impact of Recession and Market Collapse (2025):
▫️ Reduced Demand: Recession leads to a decrease in consumer activity and business confidence. This can temporarily reduce demand for many goods, including sugar, especially from industrial consumers (beverage manufacturers, confectioners, etc.).
▫️ Temporary Dollar Strengthening: In conditions of global uncertainty, the US dollar often acts as a "safe-haven currency," which can temporarily make dollar-denominated commodities relatively more expensive for buyers with other currencies.
Impact of Monetary Policy (2026-2030):
▫️ Depreciation of Paper Money: Sharp cuts in interest rates and massive money emission (QE) lead to the weakening of currencies against other assets, including real assets such as raw materials. This makes sugar, traded on international markets, more expensive when converted into these currencies.
▫️ Rising Inflationary Expectations: An increase in the money supply in circulation and low interest rates can create inflationary expectations among businesses and consumers. This can lead sugar producers and sellers to factor higher inflationary risks into their prices.
▫️ Increased Production Costs: Monetary inflation leads to rising prices for energy, fertilizers, transport, and labor — key components of the cost of producing sugarcane and sugar beet. This cost pressure will be passed on to the final price of sugar.
🔁 Interaction with Other Factors:
The presented scenarios of geopolitical instability, climate change, and potential military conflict between India and Pakistan will not develop in isolation from the macroeconomic situation. A recession in Western economies and subsequent monetary stimulus can significantly amplify or alter sugar price dynamics:
Increased Inflationary Pressure: Monetary inflation caused by regulatory actions can multiply the price pressure already present due to supply problems caused by climate anomalies or geopolitical conflicts. Reduced supply amid depreciating currencies will lead to an even sharper rise in imported sugar prices.
Limited Investment in Production: Recession can lead to reduced investment in expanding and modernizing the sugar industry due to decreased business activity and uncertain economic prospects. This can limit the market's ability to respond to growing demand or supply disruptions, exacerbating shortages and pushing prices up.
Impact on Purchasing Power: Recession and rising unemployment reduce the purchasing power of the population. Amid rising sugar prices, this could lead to reduced consumption, but also trigger social discontent and pressure on governments to regulate prices, which could create additional market imbalances.
Speculative Capital: Loose monetary policy with low interest rates can direct speculative capital into commodity markets, including the sugar market, in search of higher returns or protection against inflation. This can lead to artificial price inflation unrelated to fundamental supply and demand factors.
Energy Crisis and Monetary Inflation: If an energy crisis coincides with a period of monetary inflation, the cost of producing and transporting sugar will rise even more sharply, putting additional pressure on final prices. Higher oil prices, stimulating ethanol production, could further reduce sugar supply for the food industry during inflation.
Interaction with Trade Route Blockades: In conditions of monetary inflation, the blocking of key maritime trade routes will lead to an even more significant rise in sugar prices due to increased shipping costs and limited supply. Countries dependent on imports will face sharp price increases in their national currency due to the weakening of that currency against the dollar (the commodity trading currency).
📝 Basic Scenario: Sugar Price Surge (2025-2040) - An Echo of 1966-1974
This scenario posits a period of escalating global instability and environmental pressure that disrupts sugar production and trade, leading to sustained price increases, similar in trajectory (though not necessarily in magnitude) to the 1966-1974 period.
◽️ Phase 1: Escalation of Global Instability and Production Concerns (2025-2030)
Geopolitical Tensions and Conflicts: Persistent regional conflicts intensify, and new hotspots of instability emerge, including potential escalation of tensions in key producing regions and transit zones. The risk of military conflict between India and Pakistan poses an additional threat to regional production and logistics.
Increased Impact of "Climate Change": Extreme weather events (droughts, floods, hurricanes) become more frequent and intense in major sugarcane and sugar beet growing regions (Brazil, India, Thailand, EU), leading to reduced yields and crop losses.
Energy Crisis and Oil Prices: Volatility and potential increases in energy prices raise the cost of agricultural production, harvesting, and sugar transportation. High oil prices incentivize ethanol production from sugarcane, reducing sugar supply for the food industry.
Supply and Logistics Problems: Persistent consequences of pandemics and geopolitical tensions can lead to disruptions in port operations, transport networks, and increased shipping costs. The risk of blockades of key maritime trade routes (Suez, Malacca, Panama, Bab-el-Mandeb Straits) increases, causing delays, ship rerouting, and a sharp increase in transport expenses.
Recession in Western Economies (beginning of the period): A decline in consumer demand amid a recession may initially exert a dampening effect on prices, but this will be a temporary factor. But don't be fooled, this will only be a brief respite before the real circus begins.
◽️ Phase 2: Supply Shortages and Accelerating Price Growth (2030-2035)
Continued Production Problems: Several consecutive years of adverse weather conditions and potential military conflicts lead to a sustained decline in global sugar production and depletion of stocks.
Trade and Logistics Disruptions: Blockades of maritime routes and regional instability create significant obstacles for international sugar trade, leading to shortages in importing countries.
Growing Global Demand: Continued population growth and economic development in developing countries increase global demand for sugar.
Monetary Inflation: Central banks' actions to stimulate the economy after the recession (interest rate cuts, QE) begin to manifest as monetary inflation, weakening currencies and increasing the cost of raw materials.
Speculative Buying: Concerns about supply shortages and inflationary expectations stimulate speculative buying in commodity markets, amplifying price growth.
◽️ Phase 3: Peak Prices and Substitution Potential (2035-2040)
Sugar Becomes (Relatively) a Luxury: Persistently high prices make sugar a significant expense item for the food industry and consumers.
Increased Use of Alternatives: The high cost of sugar stimulates broader use of artificial and natural sweeteners, as well as changes in food and beverage recipes. Your body will "welcome" new chemical experiments instead of familiar sweetness.
Government Intervention : Governments of importing countries may attempt to regulate prices or introduce subsidies to mitigate the effects of high food inflation.
Impact of Military Conflict: A prolonged or expanding military conflict between India and Pakistan could lead to a catastrophic reduction in supply from this region and a further explosive price increase.
📌 Final Forecast: The presented scenario paints a picture of a potential significant increase in sugar prices between 2025 and 2040, by 10-20 times. The combination of escalating geopolitical instability, the intensifying impact of climate change, potential military conflict in a key region, and loose monetary policy after a recession creates conditions for a significant and sustained rise in sugar prices during the 2025-2040 period. While the exact scale of the increase is difficult to predict, a repetition of the price dynamics observed in 1966-1974 (a multiple increase in value) seems quite likely. Global debt is a ticking time bomb, inflation is the cancer of the economy, wars are man-made chaos, and route blockades are a chokehold on global trade. And all this will merge into a perfect storm for sugar prices!
📊 Conclusion: "The Sweet Life" Has Ended
This article, created by me (with the help of artificial intelligence), and the analysis of historical sugar price dynamics — from its exotic status to a mass-consumed commodity — and the consideration of potential triggers in the current unstable global environment, suggest that the multi-year era of relatively low sugar prices is coming to an end.
The analogy with the 70s is not just a historical reference; it's a clear scenario of what's to come. The sugar market is preparing for a repeat of that explosive growth, and you will either ride the wave or be buried beneath it. The combination of intensifying geopolitical tensions, the destabilizing impact of climate weapons climate change on global agriculture, the vulnerability of global logistics chains, rising global demand, and potential monetary inflation creates a perfect storm capable of provoking a significant and sustained increase in the price of this key commodity in the next 10-15 years. The projected ten to twenty-fold increase in prices by 2040 does not seem excessive, given the historical volatility of the sugar market and the potential strength of the interaction of the factors mentioned above. The blocking of critically important maritime trade routes could be the catalyst that pushes prices to a fundamentally new level, highlighting the vulnerability of global commodity trade.
Summarizing all discussed aspects, we can confidently state that the "sweet life", in terms of low prices for this "white powder" is over in the foreseeable future. It's time to reconsider our perception of the value of this everyday, yet strategically important commodity, and be ready for potentially significant changes in its pricing in the coming decades.
🙏 Thank you for your attention and 🚀 for the idea.
☘️ Good luck, take care!
📟 Stay in touch.

Gold Completes A Correction Within Bullish TrendGold made another sharp leg to the upside in first half of April, even showed some accelerating price action away from the 3,000 level. This suggests it might have been part of wave three when looking at the Daily and 4-hour time frame, so there can be more upside within a much more extended impulse structure. Possibly already now after blue wave four consolidation shows first signs of a bottom near 3120. Notice that pullback from recent high is in three legs, while price recovered out of wave (C) channel, so looks like new recovery is in the cards.

GOLD - Trio Retest!Hello TradingView Family / Fellow Traders. This is Richard, also known as theSignalyst.
📈After rejecting the $3,500 round number and upper bound of the wedge, XAUUSD has been in a correction phase trading within the falling red channel.
📚 As Gold approaches the $3,100 - $3,150 support zone, I will be looking for buy setups on lower timeframes as it is the intersection of three rejections:
1- The lower bound of the falling red channel
2- The lower bound of the rising orange wedge
3- $3,100 - $3,150 support zone
📚 Always follow your trading plan regarding entry, risk management, and trade management.
Good luck!
All Strategies Are Good; If Managed Properly!
~Rich
Disclosure: I am part of Trade Nation's Influencer program and receive a monthly fee for using their TradingView charts in my analysis.
