Mastering the Art of Technical Analysis (Part 3)Technical indicators are mathematical calculations that are applied to price and volume data to identify potential trading opportunities. They are based on the belief that certain patterns or trends in price and volume data can provide insights into market trends and potential price movements. Technical indicators can be used to confirm trends, identify potential entry and exit points for trades, and to provide signals for when to buy or sell.
Moving Averages
Moving averages are one of the most common technical indicators used by traders. They are used to smooth out the price data and provide a clearer picture of the overall trend. Moving averages can be calculated using different time periods, such as 50-day moving average or a 200-day moving average. A crossover between a shorter-term moving average and a longer-term moving average is often used as a signal for when to buy or sell.
Relative Strength Index (RSI)
The Relative Strength Index (RSI) is a momentum oscillator that measures the speed and change of price movements. The RSI ranges from 0 to 100, with readings above 70 considered overbought and readings below 30 considered oversold. Traders often use the RSI to identify potential trend reversals or to confirm trends.
Bollinger Bands
Bollinger Bands are a technical indicator that is used to measure volatility. They consist of three lines - a simple moving average (SMA) in the middle, and two outer bands that are two standard deviations away from the SMA. The outer bands represent the upper and lower price ranges, and the width of the bands changes based on the volatility of the asset. Traders often use Bollinger Bands to identify potential entry and exit points for trades.
Moving Average Convergence Divergence (MACD)
The Moving Average Convergence Divergence (MACD) is a trend-following momentum indicator that uses two moving averages of different lengths to identify potential entry and exit points for trades. The MACD line is calculated by subtracting the 26-day exponential moving average (EMA) from the 12-day EMA. A signal line, which is a 9-day EMA, is then plotted on top of the MACD line. Traders often use the MACD to identify potential trend reversals or to confirm trends.
Fibonacci Retracement
The Fibonacci retracement is a technical indicator that is used to identify potential support and resistance levels based on the Fibonacci sequence. The Fibonacci sequence is a mathematical sequence of numbers, in which each number is the sum of the two preceding numbers. The retracement levels are calculated based on the high and low points of a particular price movement, and they are used to identify potential entry and exit points for trades.
Commodity

Mastering the Art of Technical Analysis (Part 2)Understanding the Basics of Technical Analysis
Technical analysis is a method of analyzing financial markets that relies on studying past market data to identify patterns and make predictions about future price movements. The aim is to identify opportunities to buy low and sell high or vice versa.
What is technical analysis and why is it important for traders?
Technical analysis is the study of market data, primarily price and volume data, to identify patterns that can be used to make informed trading decisions. It is important for traders because it provides a way to interpret market trends and identify potential entry and exit points for trades.
Unlike fundamental analysis, which focuses on the underlying economic factors that influence a security's value, technical analysis relies solely on the price and volume data of a security. This means that technical analysis can be used on any asset class that has a price chart available, including stocks, bonds, currencies, and commodities.
Technical analysis can be used for short-term trading or long-term investing. For short-term traders, technical analysis can help identify potential entry and exit points for trades based on the movement of price and volume data. For long-term investors, technical analysis can help identify the overall trend of a market or a specific asset class.
The key principles of technical analysis: price action, trends, and support and resistance levels.
The key principles of technical analysis are price action, trends, and support and resistance levels.
Price action refers to the movement of an asset's price over time, and it is the primary focus of technical analysis. Price action can be analyzed using different types of charts, including line, bar, and candlestick charts.
Trends refer to the direction of price movement, and they can be classified as uptrends, downtrends, or sideways trends. Identifying the trend of a market or a specific asset is an essential part of technical analysis, as it helps traders understand the overall direction of price movement.
Support and resistance levels are points on a chart where the price has historically tended to stop moving or reverse direction. Support levels are areas where buyers tend to enter the market, as they believe the price is low enough to represent good value. Resistance levels are areas where sellers tend to enter the market, as they believe the price is high enough to represent good value.
Different types of charts: line, bar, and candlestick charts.
Different types of charts are used in technical analysis, including line, bar, and candlestick charts.
A line chart connects the closing prices of an asset over a period of time with a line, providing a simple view of the overall trend. Line charts are useful for identifying the direction of the trend but do not provide much detail about the price movement within a specific period.
A bar chart shows the opening and closing prices of an asset, as well as the high and low prices during a particular period. Each bar represents a specific time period, such as a day or an hour. Bar charts provide more detailed information about price movements than line charts, as they show the price range for each period.
Candlestick charts display the same information as bar charts, but they use a visual representation of candles to convey price movements. Each candle represents a specific time period, and the color of the candle represents whether the price closed higher or lower than it opened. Candlestick charts provide a more detailed view of price movements than bar charts and are widely used by traders.

Mastering the Art of Technical Analysis (Part 1)Technical analysis is an essential tool for traders to analyze market movements and make informed trading decisions. Whether you are a beginner or an experienced trader, mastering technical analysis can greatly improve your trading performance.
We will explore the basics of technical analysis, the different types of charts and indicators, and how to use them effectively.
Understanding the Basics of Technical Analysis
- What is technical analysis and why is it important for traders?
- The key principles of technical analysis: price action, trends, and support and resistance levels.
- Different types of charts: line, bar, and candlestick charts.
Types of Technical Indicators
- Moving averages: Simple Moving Average (SMA) and Exponential Moving Average (EMA).
- Oscillators: Relative Strength Index (RSI), Stochastic Oscillator, and Moving Average Convergence Divergence (MACD).
- Volume Indicators: On-Balance Volume (OBV) and Chaikin Money Flow (CMF).
- Fibonacci Retracement and Extension Levels.
How to Use Technical Analysis for Trading
- Identifying trading opportunities using technical analysis.
- Setting up trading strategies using technical indicators.
- Understanding risk management and position sizing using technical analysis.
- Combining technical analysis with other trading techniques.
Technical analysis is a valuable tool that traders can use to make informed trading decisions. By understanding the basics of technical analysis and using it effectively, traders can increase their chances of success in the markets.
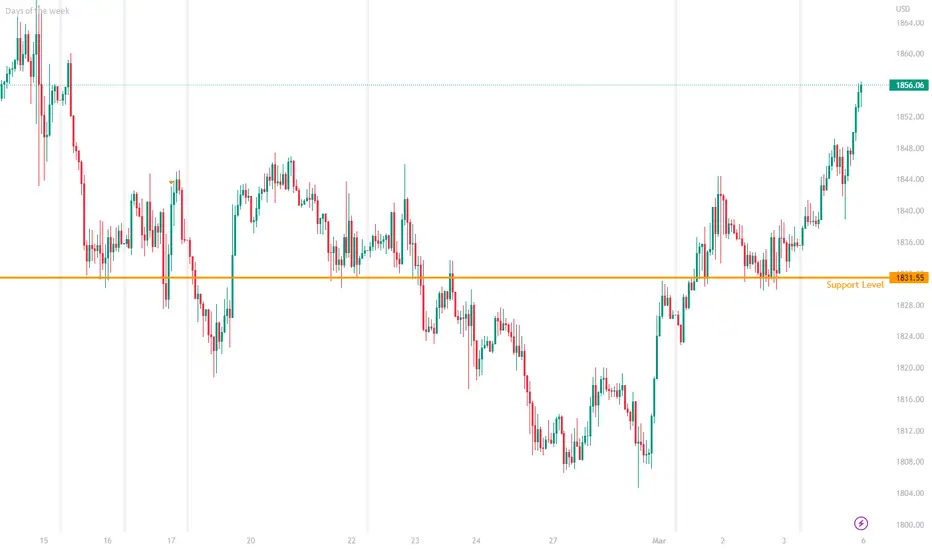
GOLD - Good Opportunity Hi, this is my new update for GOLD. In the month of February gold lost 8% of its value, but I think that was a healthy correction to get a bullish momentum in March. We tested big support level around 1800 - 1820$ and the same time we also tested 50 and 100 weeks moving averages and those levels helped us to get big bounce and break the down trendline channel. Right now we are going to test both the resistance 1858 - 1864$ and the 50 days moving average. I expect we are going to get a temporary pullback from the resistance and perhaps it is going to be the last accumulation for the traders and after that we are going to break those levels. It has higher probability that we are going up, since we have two beautiful gaps that we have to fill.

Gold Outlook 2nd March 2023Overnight, Gold saw significantly choppy price action as the price broke above the resistance level of 1834 to trade up to the 1846 price area.
However, as the DXY recovered in strength, Gold has retraced to retest the resistance and turned support level again.
At this level, look towards the DXY for further hints regarding the next directional bias of Gold.
If the DXY continues to strengthen, Gold could trade lower down to the next support level at 1819.75, which aligns with the 61.8% Fibonacci retracement level.

WTI OIL Triangle topping.WTI Oil is inside a Triangle pattern.
Sell any rejection on its top and taget Support A (75.00).
Buy any break above its top and target Resistance A (80.50).
Follow us, like the idea and leave a comment below!!

🥇Gold🥇 Analyze [Road map!!!🗺️(02/27/2023)]Gold was able to make an ending diagonal pattern in PRZ(Price Reversal Zone).
Also, we can see one of the valid candlestick patterns on the ending diagonal pattern & PRZ.
I expect Gold will rise to the Resistance zone ($1843.20-$1849.50)
Gold Analyze ( XAUUSD ), 4-hour Time frame ⏰.
Do not forget to put Stop loss for your positions (For every position you want to open).
Please follow your strategy, this is just my idea, and I will be glad to see your ideas in this post.
Please do not forget the ✅' like '✅ button 🙏😊 & Share it with your friends; thanks, and Trade safe.

LTC: $88 ---> $9.00 --> $400Charlie treating this like a penny stock done thru the custodian with a decent return
year after year or better year on year on the LONG side recent and now at the SHORT making
a killing

easyMarkets Brent Oil Daily - Quick Technical OverviewBrent oil continues to trade between two trendlines, a short-term upside one taken from the low of December 9th and a downside line drawn from the high of July 28th. As long as the commodity remains between those two lines, we will stay neutral.
If the downside line gets violated, we will start examining higher areas as potential targets, however, more buyers may join in if Brent oil jumps above the 89-dollar mark. Additionally, the commodity could also rise above the 200-day EMA, which also could be seen as a bullish indication.
Alternatively, a break below the aforementioned upside line and an additional move below the 80.43 zone may attract more sellers into the game, possibly clearing the way to the 75.00 area.
Disclaimer:
easyMarkets Account on TradingView allows you to combine easyMarkets industry leading conditions, regulated trading and tight fixed spreads with TradingView's powerful social network for traders, advanced charting and analytics. Access no slippage on limit orders, tight fixed spreads, negative balance protection, no hidden fees or commission, and seamless integration.
Any opinions, news, research, analyses, prices, other information, or links to third-party sites contained on this website are provided on an "as-is" basis, are intended only to be informative, is not an advice nor a recommendation, nor research, or a record of our trading prices, or an offer of, or solicitation for a transaction in any financial instrument and thus should not be treated as such. The information provided does not involve any specific investment objectives, financial situation and needs of any specific person who may receive it. Please be aware, that past performance is not a reliable indicator of future performance and/or results. Past Performance or Forward-looking scenarios based upon the reasonable beliefs of the third-party provider are not a guarantee of future performance. Actual results may differ materially from those anticipated in forward-looking or past performance statements. easyMarkets makes no representation or warranty and assumes no liability as to the accuracy or completeness of the information provided, nor any loss arising from any investment based on a recommendation, forecast or any information supplied by any third-party.

USOIL Potential Forecast | 1st March 2023Fundamental Backdrop
1. Optimistic reports of manufacturing expansion in China, which is recognized as the largest crude oil importer globally causing a better outlook for the demand.
2. Data showing China's factory activity rose for the first time in seven months in February
3. Output is still down more than 700,000 bpd from September with a high demand still in place
Technical Confluences
1. The overall bias for USOIL on the H4 chart is bullish.
2. To add confluence to our bias, price is above the Ichimoku cloud and looks to be breaking the descending trend-line.
2. Expecting price to possibly head towards the resistance at the 79.00 level.
Idea
I will be looking for price to break above the resistance at 77.8 and the descending trend line before continuing bullish towards the resistance at the 79.00 level.
NOT FINANCIAL ADVICE DISCLAIMER
The trading related ideas posted by OlympusLabs are for educational and informational purposes only and should not be considered as financial advice. Trading in financial markets involves a high degree of risk, and individuals should carefully consider their investment objectives, financial situation, and risk tolerance before making any trading decisions based on our ideas.
We are not a licensed financial advisor or professional, and the information we are providing is based on our personal experience and research. We make no guarantees or promises regarding the accuracy, completeness, or reliability of the information provided, and users should do their own research and analysis before making any trades.
Users should be aware that trading involves significant risk, and there is no guarantee of profit. Any trading strategy may result in losses, and individuals should be prepared to accept those risks.
OlympusLabs and its affiliates are not responsible for any losses or damages that may result from the use of our trading related ideas or the information provided on our platform. Users should seek the advice of a licensed financial advisor or professional if they have any doubts or concerns about their investment strategies.

Soybean Futures ( ZS1! ), H4 Potential for Bearish DropTitle: Soybean Futures ( ZS1! ), H4 Potential for Bearish Drop
Type: Bearish Drop
Resistance: 1535.00
Pivot: 1514.00
Support: 1490.75
Preferred case: Looking at the H4 chart, my overall bias for ZS1! is bearish due to the current price being under the Ichimoku cloud, indicating a bearish market. If this bearish momentum continues, expect price to possibly drop from the pivot at 1514.00, where the 23.6% Fibonacci line is before continue heading towards the support at 1490.75, slightly below where the -27.2% Fibonacci expansion line is.
Alternative scenario: Price may head back up to retest the resistance at 1535.00, where the 61.8% Fibonacci line is.
Fundamentals: There are no major news.

XAUUSD Potential for Bearish Drop | 28th February 2023Looking at the H4 chart, my overall bias for XAUUSD is bearish due to the current price being below the Ichimoku cloud , indicating a bearish market. To add confluence to this bias, price is also along a descending trendline.
Looking for a sell entry at 1818.975, where the overlap resistance and 23.6% Fibonacci line is. Stop loss will be at 1844.870, where the recent high is. Take profit will be at 1786.545, where the overlap support and -61.8% Fibonacci expansion line is.
Any opinions, news, research, analyses, prices, other information, or links to third-party sites contained on this website are provided on an "as-is" basis, as general market commentary, and do not constitute investment advice. The market commentary has not been prepared in accordance with legal requirements designed to promote the independence of investment research, and it is therefore not subject to any prohibition on dealing ahead of dissemination. Although this commentary is not produced by an independent source, FXCM takes all sufficient steps to eliminate or prevent any conflicts of interest arising out of the production and dissemination of this communication. The employees of FXCM commit to acting in the clients' best interests and represent their views without misleading, deceiving, or otherwise impairing the clients' ability to make informed investment decisions. For more information about the FXCM's internal organizational and administrative arrangements for the prevention of conflicts, please refer to the Firms' Managing Conflicts Policy. Please ensure that you read and understand our Full Disclaimer and Liability provision concerning the foregoing Information, which can be accessed on the website.

XAUUSD Potential for Bearish Drop towards overlap supportLooking at the H4 chart, my overall bias for XAUUSD is bearish due to the current price being below the Ichimoku cloud , indicating a bearish market. To add confluence to this bias, price is also along a descending trendline.
Looking for a sell entry at 1818.975, where the overlap resistance and 23.6% Fibonacci line is. Stop loss will be at 1844.870, where the recent high is. Take profit will be at 1786.545, where the overlap support and -61.8% Fibonacci expansion line is.
Please be advised that the information presented on TradingView is provided to Vantage (‘Vantage Global Limited’, ‘we’) by a third-party provider (‘Everest Fortune Group’). Please be reminded that you are solely responsible for the trading decisions on your account. There is a very high degree of risk involved in trading. Any information and/or content is intended entirely for research, educational and informational purposes only and does not constitute investment or consultation advice or investment strategy. The information is not tailored to the investment needs of any specific person and therefore does not involve a consideration of any of the investment objectives, financial situation or needs of any viewer that may receive it. Kindly also note that past performance is not a reliable indicator of future results. Actual results may differ materially from those anticipated in forward-looking or past performance statements. We assume no liability as to the accuracy or completeness of any of the information and/or content provided herein and the Company cannot be held responsible for any omission, mistake nor for any loss or damage including without limitation to any loss of profit which may arise from reliance on any information supplied by Everest Fortune Group.

Silver just gave a strong sell signal with fundamentalsHead and Shoulders formed on the daily of Silver.
The price could next head on up to trap the bulls before the downside (forming a Right shoulder).
21>7 MA
Price <200 - Bearish (Red back)
RSI<30 - Bearish
Target $16.30
ABOUT Silver and why the price could drop
Silver is a precious metal that has been used for coins, jewelry, and decorative purposes for thousands of years.
Silver is a valuable industrial metal, used in a variety of applications such as electronics, solar panels, and batteries.
The price of silver is influenced by supply and demand factors, such as the amount of silver available for sale and the level of demand from investors and industrial users.
If investors perceive that there is less inflation risk or less economic uncertainty, they may shift their investments away from precious metals like silver, which could cause the price to drop. Now that inflation is slowing easing, this is why people could be shifting their money to other markets.
The value of the US dollar, which is often inversely related to the price of silver, can impact the metal's price. If the dollar strengthens, the price of silver normally drops where investors seek other investment options.
If there is a decrease in geopolitical tensions or risks, investors may shift their investment focus away from precious metals like silver, which could cause the price to drop.

GOLD - Shift In Momentum In Action! 🥇Hello TradingView Family / Fellow Traders. This is Richard, as known as theSignalyst.
on WEEKLY: Left Chart
GOLD is approaching a support zone and round number 1800. So we will be looking for buy setups on lower timeframes.
on H4: Right Chart
XAUUSD is bearish from a short-term perspective trading inside the falling red channel.
🏹 Trigger => for the bulls to take over, we need a new swing high to form around the upper red trendline and then a break above it.
Meanwhile, until the buy is activated, GOLD can still trade lower till the 1800 support or even break it downward.
📚 Always follow your trading plan regarding entry, risk management, and trade management.
Good luck!
All Strategies Are Good; If Managed Properly!
~Rich

Gold under pressureAs the DXY strengthened, Gold broke the 1819 support level to trade lower, also resisted by the downward trendline.
Currently consolidating along the 1812 level, Gold is likely to continue sliding lower to test the round number level of 1800. If the price breaks below 1800, the next key support level is at 1785.
Overall, it is hard to anticipate sustained upside moves on Gold. Any retracements to the upside could be seen as a setup for further selling opportunities.

BTCUSD Futures ( BTCUSD ), H4 Potential for Bearish DropTitle: BTCUSD Futures ( BTCUSD ), H4 Potential for Bearish Drop
Type: Bearish Drop
Resistance: 25270.00
Pivot: 23815.00
Support: 21376.00
Preferred case: Looking at the H4 chart, my overall bias for BTCUSD is bearish due to the current price crossing below the Ichimoku cloud, indicating a possible shift to bearish market structure. If this bearish momentum continues, expect price to drop from the pivot at 23815.00 where the 38.2% Fibonacci line and overlap resistance is and continue heading down towards the support at 21376.00 where the previous swing low was. It’s worth noting that there is an intermediate support at 21939.00 which price might struggle to break through.
Alternative scenario: Price may head back up towards the resistance line at 25270.00 where the recent high is.
Fundamentals: There are no major news.

XAUUSD Potential for Bearish Drop towards overlap supportLooking at the H4 chart, my overall bias for XAUUSD is bearish due to the current price being below the Ichimoku cloud , indicating a bearish market. To add confluence to this bias, price is also along a descending trendline.
Looking for a sell entry at 1818.975, where the overlap resistance and 23.6% Fibonacci line is. Stop loss will be at 1844.870, where the recent high is. Take profit will be at 1786.545, where the overlap support and -61.8% Fibonacci expansion line is.
Please be advised that the information presented on TradingView is provided to Vantage (‘Vantage Global Limited’, ‘we’) by a third-party provider (‘Everest Fortune Group’). Please be reminded that you are solely responsible for the trading decisions on your account. There is a very high degree of risk involved in trading. Any information and/or content is intended entirely for research, educational and informational purposes only and does not constitute investment or consultation advice or investment strategy. The information is not tailored to the investment needs of any specific person and therefore does not involve a consideration of any of the investment objectives, financial situation or needs of any viewer that may receive it. Kindly also note that past performance is not a reliable indicator of future results. Actual results may differ materially from those anticipated in forward-looking or past performance statements. We assume no liability as to the accuracy or completeness of any of the information and/or content provided herein and the Company cannot be held responsible for any omission, mistake nor for any loss or damage including without limitation to any loss of profit which may arise from reliance on any information supplied by Everest Fortune Group.

XAUUSD Potential for Bearish Drop | 27th February 2023Looking at the H4 chart, my overall bias for XAUUSD is bearish due to the current price being below the Ichimoku cloud , indicating a bearish market. To add confluence to this bias, price is also along a descending trendline.
Looking for a sell entry at 1818.975, where the overlap resistance and 23.6% Fibonacci line is. Stop loss will be at 1844.870, where the recent high is. Take profit will be at 1786.545, where the overlap support and -61.8% Fibonacci expansion line is.
Any opinions, news, research, analyses, prices, other information, or links to third-party sites contained on this website are provided on an "as-is" basis, as general market commentary, and do not constitute investment advice. The market commentary has not been prepared in accordance with legal requirements designed to promote the independence of investment research, and it is therefore not subject to any prohibition on dealing ahead of dissemination. Although this commentary is not produced by an independent source, FXCM takes all sufficient steps to eliminate or prevent any conflicts of interest arising out of the production and dissemination of this communication. The employees of FXCM commit to acting in the clients' best interests and represent their views without misleading, deceiving, or otherwise impairing the clients' ability to make informed investment decisions. For more information about the FXCM's internal organizational and administrative arrangements for the prevention of conflicts, please refer to the Firms' Managing Conflicts Policy. Please ensure that you read and understand our Full Disclaimer and Liability provision concerning the foregoing Information, which can be accessed on the website.

Corn Futures ( ZC1! ), H4 Potential for Bearish DropTitle: Corn Futures ( ZC1! ), H4 Potential for Bearish Drop
Type: Bearish Drop
Resistance: 688.50
Pivot: 673.00
Support: 648.25
Preferred case: Looking at the H4 chart, my overall bias for ZC1! is bearish due to the current price crossing below the Ichimoku cloud, indicating a bearish market. To add confluence to this bias, price is also within a descending channel. If this bearish momentum continues, expect price to possibly retest the pivot at 673.00 where the overlap resistance and 50% Fibonacci line is before heading towards the support at 648.25, where the previous swing low is.
Alternative scenario: Price may head back up to retest the resistance at 688.50 where the recent high is located.
Fundamentals: There are no major news.

XAUUSD Potential for Bearish Drop to overlap supportLooking at the H4 chart, my overall bias for XAUUSD is bearish due to the current price being below the Ichimoku cloud , indicating a bearish market. To add confluence to this bias, price is also along a descending trendline.
Price is currently retesting the overlap support at 1824.515.
Looking for a sell stop entry at 1816.137, to ride the bearish momentum. Stop loss will be at 1844.870, where the overlap resistance is. Take profit will be at 1786.545, where the overlap support is.
Please be advised that the information presented on TradingView is provided to Vantage (‘Vantage Global Limited’, ‘we’) by a third-party provider (‘Everest Fortune Group’). Please be reminded that you are solely responsible for the trading decisions on your account. There is a very high degree of risk involved in trading. Any information and/or content is intended entirely for research, educational and informational purposes only and does not constitute investment or consultation advice or investment strategy. The information is not tailored to the investment needs of any specific person and therefore does not involve a consideration of any of the investment objectives, financial situation or needs of any viewer that may receive it. Kindly also note that past performance is not a reliable indicator of future results. Actual results may differ materially from those anticipated in forward-looking or past performance statements. We assume no liability as to the accuracy or completeness of any of the information and/or content provided herein and the Company cannot be held responsible for any omission, mistake nor for any loss or damage including without limitation to any loss of profit which may arise from reliance on any information supplied by Everest Fortune Group.

XAUUSD Potential for Bearish Drop | 24th February 2023Looking at the H4 chart, my overall bias for XAUUSD is bearish due to the current price being below the Ichimoku cloud , indicating a bearish market. To add confluence to this bias, price is also along a descending trendline.
Price is currently retesting the overlap support at 1824.515.
Looking for a sell stop entry at 1816.137, to ride the bearish momentum. Stop loss will be at 1844.870, where the overlap resistance is. Take profit will be at 1786.545, where the overlap support is.
Any opinions, news, research, analyses, prices, other information, or links to third-party sites contained on this website are provided on an "as-is" basis, as general market commentary, and do not constitute investment advice. The market commentary has not been prepared in accordance with legal requirements designed to promote the independence of investment research, and it is therefore not subject to any prohibition on dealing ahead of dissemination. Although this commentary is not produced by an independent source, FXCM takes all sufficient steps to eliminate or prevent any conflicts of interest arising out of the production and dissemination of this communication. The employees of FXCM commit to acting in the clients' best interests and represent their views without misleading, deceiving, or otherwise impairing the clients' ability to make informed investment decisions. For more information about the FXCM's internal organizational and administrative arrangements for the prevention of conflicts, please refer to the Firms' Managing Conflicts Policy. Please ensure that you read and understand our Full Disclaimer and Liability provision concerning the foregoing Information, which can be accessed on the website.

Fed minutes signal more rate hikes in 2023The Federal Reserve's meeting minutes reveal they continue to believe ongoing interest rate increases will be appropriate to combat inflation, with the target rate range set at 2%. This raised the risk-aversion mood in the market while strengthening the dollar. USD/CAD added 12 pips to 1.3549, but USD/JPY slid 9 pips to 134.90.
Germany's year-on-year inflation rate in February was 8.7% as Mitrade estimates. EUR/USD then fell 45 pips to 1.0601. GBP/USD dropped 71 pips to 1.2044, and AUD/USD decreased 49 pips to 0.6803.
Spot gold plunged almost $10 to $1,825.29 an ounce, and WTI oil futures declined $2.41 to $73.95 a barrel. Bitcoin and Ethereum closed lower at $24,150.0 and $1,641.40 respectively.
The Nasdaq 100 closed 5 points higher (+0.05%) at 12,066. On the other hand, the S&P 500 lost 6 points (-0.16%) to 3,991 and the Dow Jones Industrial Average dropped 84 points (-0.26%) to 33,045.
