Crude Oil Futures ( CL1! ), H4 Potential for Bullish RiseTitle: Crude Oil Futures ( CL1! ), H4 Potential for Bullish Rise
Type: Bullish Rise
Resistance: 85.61
Pivot: 80.62
Support: 77.31
Preferred case: Looking at the H4 chart, my overall bias for CL1! is bullish due to the current price being above the Ichimoku cloud, indicating a bullish market. If this bullish momentum continues, expect price to continue heading towards the resistance at 85.61, where the overlap resistance are.
Alternative scenario: Price may head back down to retest the support at 77.31, where the 38.2% Fibonacci line is.
Fundamentals: There are no major news.
Commodity

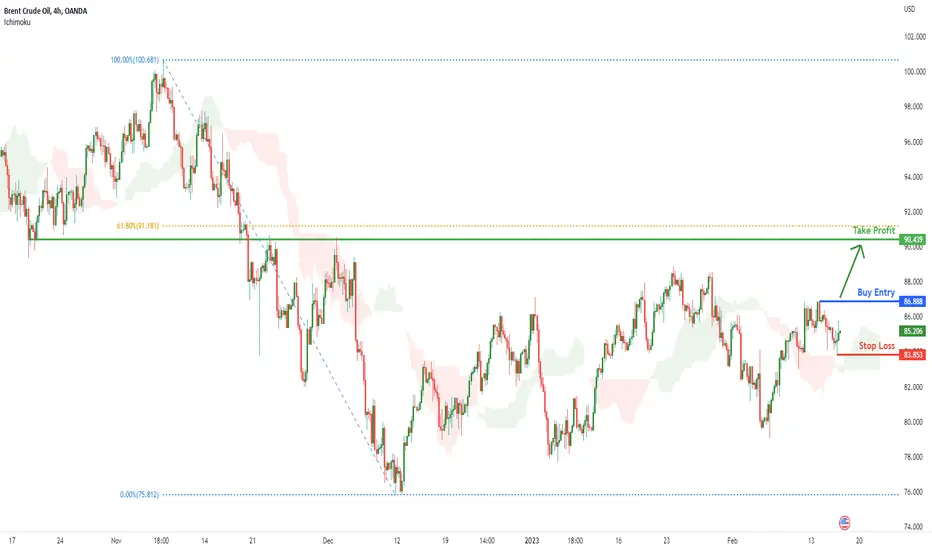
BCOUSD Potential for Bullish Rise | 16th February 2023Looking at the H4 chart, my overall bias for BCOUSD is bullish due to the current price being above the Ichimoku cloud , indicating a bullish market.
Looking for a buy stop entry at 86.888, where the recent high is to ride the bullish momentum. Take profit will be at 90.439, where the overlap resistance and 61.8% Fibonacci line is. Stop loss will be at 83.853, where the recent low is.
Any opinions, news, research, analyses, prices, other information, or links to third-party sites contained on this website are provided on an "as-is" basis, as general market commentary, and do not constitute investment advice. The market commentary has not been prepared in accordance with legal requirements designed to promote the independence of investment research, and it is therefore not subject to any prohibition on dealing ahead of dissemination. Although this commentary is not produced by an independent source, FXCM takes all sufficient steps to eliminate or prevent any conflicts of interest arising out of the production and dissemination of this communication. The employees of FXCM commit to acting in the clients' best interests and represent their views without misleading, deceiving, or otherwise impairing the clients' ability to make informed investment decisions. For more information about the FXCM's internal organizational and administrative arrangements for the prevention of conflicts, please refer to the Firms' Managing Conflicts Policy. Please ensure that you read and understand our Full Disclaimer and Liability provision concerning the foregoing Information, which can be accessed on the website.
easyMarkets Silver Daily - Quick Technical OverviewDisclaimer:
easyMarkets Account on TradingView allows you to combine easyMarkets industry leading conditions, regulated trading and tight fixed spreads with TradingView's powerful social network for traders, advanced charting and analytics. Access no slippage on limit orders, tight fixed spreads, negative balance protection, no hidden fees or commission, and seamless integration.
Any opinions, news, research, analyses, prices, other information, or links to third-party sites contained on this website are provided on an "as-is" basis, are intended only to be informative, is not an advice nor a recommendation, nor research, or a record of our trading prices, or an offer of, or solicitation for a transaction in any financial instrument and thus should not be treated as such. The information provided does not involve any specific investment objectives, financial situation and needs of any specific person who may receive it. Please be aware, that past performance is not a reliable indicator of future performance and/or results. Past Performance or Forward-looking scenarios based upon the reasonable beliefs of the third-party provider are not a guarantee of future performance. Actual results may differ materially from those anticipated in forward-looking or past performance statements. easyMarkets makes no representation or warranty and assumes no liability as to the accuracy or completeness of the information provided, nor any loss arising from any investment based on a recommendation, forecast or any information supplied by any third-party.

XAUUSD potential for bearish drop to overlap supportLooking at the H4 chart, my overall bias for XAUUSD is bearish due to the current price being below the Ichimoku cloud , indicating a bearish market.
Looking for an immediate sell entry at 1854.435 to ride the bearish momentum. Stop loss will be at 1870.800, slightly above where the intermediary resistance is. Take profit will be at 1824.515, where the overlap support is.
Please be advised that the information presented on TradingView is provided to Vantage (‘Vantage Global Limited’, ‘we’) by a third-party provider (‘Everest Fortune Group’). Please be reminded that you are solely responsible for the trading decisions on your account. There is a very high degree of risk involved in trading. Any information and/or content is intended entirely for research, educational and informational purposes only and does not constitute investment or consultation advice or investment strategy. The information is not tailored to the investment needs of any specific person and therefore does not involve a consideration of any of the investment objectives, financial situation or needs of any viewer that may receive it. Kindly also note that past performance is not a reliable indicator of future results. Actual results may differ materially from those anticipated in forward-looking or past performance statements. We assume no liability as to the accuracy or completeness of any of the information and/or content provided herein and the Company cannot be held responsible for any omission, mistake nor for any loss or damage including without limitation to any loss of profit which may arise from reliance on any information supplied by Everest Fortune Group.

XAUUSD Potential for Bearish Continuation | 15th February 2023Looking at the H4 chart, my overall bias for XAUUSD is bearish due to the current price being below the Ichimoku cloud , indicating a bearish market.
Looking for an immediate sell entry at 1854.435 to ride the bearish momentum. Stop loss will be at 1870.800, slightly above where the intermediary resistance is. Take profit will be at 1824.515, where the overlap support is.
Any opinions, news, research, analyses, prices, other information, or links to third-party sites contained on this website are provided on an "as-is" basis, as general market commentary, and do not constitute investment advice. The market commentary has not been prepared in accordance with legal requirements designed to promote the independence of investment research, and it is therefore not subject to any prohibition on dealing ahead of dissemination. Although this commentary is not produced by an independent source, FXCM takes all sufficient steps to eliminate or prevent any conflicts of interest arising out of the production and dissemination of this communication. The employees of FXCM commit to acting in the clients' best interests and represent their views without misleading, deceiving, or otherwise impairing the clients' ability to make informed investment decisions. For more information about the FXCM's internal organizational and administrative arrangements for the prevention of conflicts, please refer to the Firms' Managing Conflicts Policy. Please ensure that you read and understand our Full Disclaimer and Liability provision concerning the foregoing Information, which can be accessed on the website.

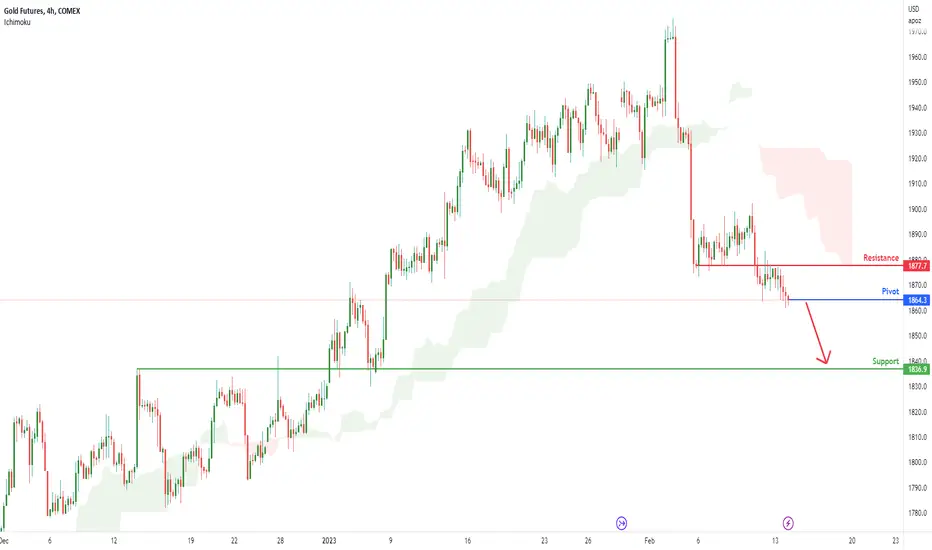
Gold Futures ( GC1! ), H4 Potential for Bearish ContinuationTitle: Gold Futures ( GC1! ), H4 Potential for Bearish Continuation
Type: Bearish Continuation
Resistance: 1877.7
Pivot: 1864.3
Support: 1836.9
Preferred Case: Looking at the H4 chart, my overall bias for GC1! is bearish due to the current price crossing below the Ichimoku cloud , indicating a bearish market. Expecting price to possibly drop towards the support at 1836.9, where the overlap support is.
Alternative scenario: Price may head back up towards the resistance at 1877.7, which is the overlap resistance.
Fundamentals: There are no major news.
USOIL Potential for Bullish Rise to previous swing highLooking at the H4 chart, my overall bias for USOIL is bullish due to the current price being above the Ichimoku cloud, indicating a bullish market.
Looking for a pullback buy entry at 77.90, where the overlap support and 50% Fibonacci line is. Stop loss will be at 76.50, where the minor low is. Take profit will be at 82.60, where the previous swing high is.
Please be advised that the information presented on TradingView is provided to Vantage (‘Vantage Global Limited’, ‘we’) by a third-party provider (‘Everest Fortune Group’). Please be reminded that you are solely responsible for the trading decisions on your account. There is a very high degree of risk involved in trading. Any information and/or content is intended entirely for research, educational and informational purposes only and does not constitute investment or consultation advice or investment strategy. The information is not tailored to the investment needs of any specific person and therefore does not involve a consideration of any of the investment objectives, financial situation or needs of any viewer that may receive it. Kindly also note that past performance is not a reliable indicator of future results. Actual results may differ materially from those anticipated in forward-looking or past performance statements. We assume no liability as to the accuracy or completeness of any of the information and/or content provided herein and the Company cannot be held responsible for any omission, mistake nor for any loss or damage including without limitation to any loss of profit which may arise from reliance on any information supplied by Everest Fortune Group.

XAUUSD Potential for Bearish Continuation to overlap supportLooking at the H4 chart, my overall bias for XAUUSD is bearish due to the current price being below the Ichimoku cloud , indicating a bearish market.
Looking for an immediate sell entry at 1853.740 to ride the bearish momentum. Stop loss will be at 1872.210, slightly above where the intermediary resistance is. Take profit will be at 1824.515, where the overlap support is.
Please be advised that the information presented on TradingView is provided to Vantage (‘Vantage Global Limited’, ‘we’) by a third-party provider (‘Everest Fortune Group’). Please be reminded that you are solely responsible for the trading decisions on your account. There is a very high degree of risk involved in trading. Any information and/or content is intended entirely for research, educational and informational purposes only and does not constitute investment or consultation advice or investment strategy. The information is not tailored to the investment needs of any specific person and therefore does not involve a consideration of any of the investment objectives, financial situation or needs of any viewer that may receive it. Kindly also note that past performance is not a reliable indicator of future results. Actual results may differ materially from those anticipated in forward-looking or past performance statements. We assume no liability as to the accuracy or completeness of any of the information and/or content provided herein and the Company cannot be held responsible for any omission, mistake nor for any loss or damage including without limitation to any loss of profit which may arise from reliance on any information supplied by Everest Fortune Group.

XAUUSD Potential for Bearish Continuation | 14th February 2023Looking at the H4 chart, my overall bias for XAUUSD is bearish due to the current price being below the Ichimoku cloud , indicating a bearish market.
Looking for an immediate sell entry at 1853.740 to ride the bearish momentum. Stop loss will be at 1872.210, slightly above where the intermediary resistance is. Take profit will be at 1824.515, where the overlap support is.
Any opinions, news, research, analyses, prices, other information, or links to third-party sites contained on this website are provided on an "as-is" basis, as general market commentary, and do not constitute investment advice. The market commentary has not been prepared in accordance with legal requirements designed to promote the independence of investment research, and it is therefore not subject to any prohibition on dealing ahead of dissemination. Although this commentary is not produced by an independent source, FXCM takes all sufficient steps to eliminate or prevent any conflicts of interest arising out of the production and dissemination of this communication. The employees of FXCM commit to acting in the clients' best interests and represent their views without misleading, deceiving, or otherwise impairing the clients' ability to make informed investment decisions. For more information about the FXCM's internal organizational and administrative arrangements for the prevention of conflicts, please refer to the Firms' Managing Conflicts Policy. Please ensure that you read and understand our Full Disclaimer and Liability provision concerning the foregoing Information, which can be accessed on the website.

easyMarkets Cotton Daily - Quick Technical OverviewDisclaimer:
easyMarkets Account on TradingView allows you to combine easyMarkets industry leading conditions, regulated trading and tight fixed spreads with TradingView's powerful social network for traders, advanced charting and analytics. Access no slippage on limit orders, tight fixed spreads, negative balance protection, no hidden fees or commission, and seamless integration.
Any opinions, news, research, analyses, prices, other information, or links to third-party sites contained on this website are provided on an "as-is" basis, are intended only to be informative, is not an advice nor a recommendation, nor research, or a record of our trading prices, or an offer of, or solicitation for a transaction in any financial instrument and thus should not be treated as such. The information provided does not involve any specific investment objectives, financial situation and needs of any specific person who may receive it. Please be aware, that past performance is not a reliable indicator of future performance and/or results. Past Performance or Forward-looking scenarios based upon the reasonable beliefs of the third-party provider are not a guarantee of future performance. Actual results may differ materially from those anticipated in forward-looking or past performance statements. easyMarkets makes no representation or warranty and assumes no liability as to the accuracy or completeness of the information provided, nor any loss arising from any investment based on a recommendation, forecast or any information supplied by any third-party.

XAUUSD Potential for Bearish Continuation to overlap supportLooking at the H4 chart, my overall bias for XAUUSD is bearish due to the current price being below the Ichimoku cloud , indicating a bearish market.
Looking for an immediate sell entry at 1861.430 to ride the bearish momentum. Stop loss will be at 1890.250, where the previous swing high is. Take profit will be at 1824.515, where the overlap support is.
Please be advised that the information presented on TradingView is provided to Vantage (‘Vantage Global Limited’, ‘we’) by a third-party provider (‘Everest Fortune Group’). Please be reminded that you are solely responsible for the trading decisions on your account. There is a very high degree of risk involved in trading. Any information and/or content is intended entirely for research, educational and informational purposes only and does not constitute investment or consultation advice or investment strategy. The information is not tailored to the investment needs of any specific person and therefore does not involve a consideration of any of the investment objectives, financial situation or needs of any viewer that may receive it. Kindly also note that past performance is not a reliable indicator of future results. Actual results may differ materially from those anticipated in forward-looking or past performance statements. We assume no liability as to the accuracy or completeness of any of the information and/or content provided herein and the Company cannot be held responsible for any omission, mistake nor for any loss or damage including without limitation to any loss of profit which may arise from reliance on any information supplied by Everest Fortune Group.

XAUUSD Potential for Bearish Continuation | 13th February 2023Looking at the H4 chart, my overall bias for XAUUSD is bearish due to the current price being below the Ichimoku cloud , indicating a bearish market.
Looking for an immediate sell entry at 1861.430 to ride the bearish momentum. Stop loss will be at 1890.250, where the previous swing high is. Take profit will be at 1824.515, where the overlap support is.
Any opinions, news, research, analyses, prices, other information, or links to third-party sites contained on this website are provided on an "as-is" basis, as general market commentary, and do not constitute investment advice. The market commentary has not been prepared in accordance with legal requirements designed to promote the independence of investment research, and it is therefore not subject to any prohibition on dealing ahead of dissemination. Although this commentary is not produced by an independent source, FXCM takes all sufficient steps to eliminate or prevent any conflicts of interest arising out of the production and dissemination of this communication. The employees of FXCM commit to acting in the clients' best interests and represent their views without misleading, deceiving, or otherwise impairing the clients' ability to make informed investment decisions. For more information about the FXCM's internal organizational and administrative arrangements for the prevention of conflicts, please refer to the Firms' Managing Conflicts Policy. Please ensure that you read and understand our Full Disclaimer and Liability provision concerning the foregoing Information, which can be accessed on the website.

XAUUSD Potential for Bearish Continuation to overlap supportLooking at the H4 chart, my overall bias for XAUUSD is bearish due to the current price being below the Ichimoku cloud , indicating a bearish market.
Looking for an immediate sell entry at 1861.430 to ride the bearish momentum. Stop loss will be at 1890.250, where the previous swing high is. Take profit will be at 1824.515, where the overlap support is.
Please be advised that the information presented on TradingView is provided to Vantage (‘Vantage Global Limited’, ‘we’) by a third-party provider (‘Everest Fortune Group’). Please be reminded that you are solely responsible for the trading decisions on your account. There is a very high degree of risk involved in trading. Any information and/or content is intended entirely for research, educational and informational purposes only and does not constitute investment or consultation advice or investment strategy. The information is not tailored to the investment needs of any specific person and therefore does not involve a consideration of any of the investment objectives, financial situation or needs of any viewer that may receive it. Kindly also note that past performance is not a reliable indicator of future results. Actual results may differ materially from those anticipated in forward-looking or past performance statements. We assume no liability as to the accuracy or completeness of any of the information and/or content provided herein and the Company cannot be held responsible for any omission, mistake nor for any loss or damage including without limitation to any loss of profit which may arise from reliance on any information supplied by Everest Fortune Group.

XAUUSD Potential for Bearish Continuation | 10th February 2023Looking at the H4 chart, my overall bias for XAUUSD is bearish due to the current price being below the Ichimoku cloud , indicating a bearish market.
Looking for an immediate sell entry at 1861.430 to ride the bearish momentum. Stop loss will be at 1890.250, where the previous swing high is. Take profit will be at 1824.515, where the overlap support is.
Any opinions, news, research, analyses, prices, other information, or links to third-party sites contained on this website are provided on an "as-is" basis, as general market commentary, and do not constitute investment advice. The market commentary has not been prepared in accordance with legal requirements designed to promote the independence of investment research, and it is therefore not subject to any prohibition on dealing ahead of dissemination. Although this commentary is not produced by an independent source, FXCM takes all sufficient steps to eliminate or prevent any conflicts of interest arising out of the production and dissemination of this communication. The employees of FXCM commit to acting in the clients' best interests and represent their views without misleading, deceiving, or otherwise impairing the clients' ability to make informed investment decisions. For more information about the FXCM's internal organizational and administrative arrangements for the prevention of conflicts, please refer to the Firms' Managing Conflicts Policy. Please ensure that you read and understand our Full Disclaimer and Liability provision concerning the foregoing Information, which can be accessed on the website.

Is Gold telling us something?Gold is forming a picture perfect Bear Flag.
If this pattern breaks and triggers we have 2 downside targets.
The importance of analyzing this pattern is Gold encompasses much of the macro landscape in its price action.
If Gold is acting bearishly based off this pattern it could be foreshadowing a dollar strengthening.
It could also foreshadow perhaps a good jobloss claims number tomorrow that could force yields higher.
Whatever the catalyst may be, based off of this pattern were likely to see some additional weakness in the near term unless we break out of the bear flag upper range.

XAGUSD potential for bearish drop towards overlap supportLooking at the H4 chart, my overall bias for XAGUSD is bearish due to the current price being below the Ichimoku cloud, indicating a bearish market.
Looking for a pullback sell entry at 23.01995, where the overlap resistance and 38.2% Fibonacci line is. Stop loss will be at 24.63700, where the previous swing high is. Take profit will be at 20.80500, where the overlap support is.
Please be advised that the information presented on TradingView is provided to Vantage (‘Vantage Global Limited’, ‘we’) by a third-party provider (‘Everest Fortune Group’). Please be reminded that you are solely responsible for the trading decisions on your account. There is a very high degree of risk involved in trading. Any information and/or content is intended entirely for research, educational and informational purposes only and does not constitute investment or consultation advice or investment strategy. The information is not tailored to the investment needs of any specific person and therefore does not involve a consideration of any of the investment objectives, financial situation or needs of any viewer that may receive it. Kindly also note that past performance is not a reliable indicator of future results. Actual results may differ materially from those anticipated in forward-looking or past performance statements. We assume no liability as to the accuracy or completeness of any of the information and/or content provided herein and the Company cannot be held responsible for any omission, mistake nor for any loss or damage including without limitation to any loss of profit which may arise from reliance on any information supplied by Everest Fortune Group.

XAUUSD Potential for Bearish Continuation | 9th February 2023Looking at the H4 chart, my overall bias for XAUUSD is bearish due to the current price being below the Ichimoku cloud , indicating a bearish market.
Looking for a pullback sell entry at 1901.743 where the 38.2% Fibonacci line and overlap resistance is. Stop loss will be at 1959.770, where the previous swing high is. Take profit will be at 1824.515, where the overlap support is.
Any opinions, news, research, analyses, prices, other information, or links to third-party sites contained on this website are provided on an "as-is" basis, as general market commentary, and do not constitute investment advice. The market commentary has not been prepared in accordance with legal requirements designed to promote the independence of investment research, and it is therefore not subject to any prohibition on dealing ahead of dissemination. Although this commentary is not produced by an independent source, FXCM takes all sufficient steps to eliminate or prevent any conflicts of interest arising out of the production and dissemination of this communication. The employees of FXCM commit to acting in the clients' best interests and represent their views without misleading, deceiving, or otherwise impairing the clients' ability to make informed investment decisions. For more information about the FXCM's internal organizational and administrative arrangements for the prevention of conflicts, please refer to the Firms' Managing Conflicts Policy. Please ensure that you read and understand our Full Disclaimer and Liability provision concerning the foregoing Information, which can be accessed on the website.

GBPUSD GOING TOWARDS RESISTANCE price fails to make new lower low where price indicating going up to touch its resistance in coming days due to low liquidity it may take time but soon chances are high to make hit resistance one. where bear and bulls race will continue lets see who will win. As the price action allowing us bullish move up to 1.23 zone where again may see a bear move accordingly from the mentioned resistance.

gold channel moveprice action is beautiful both channel move is following accordingly if descending channel move continue will see again in 1865 zone

Copper & Stocks DivergingCopper and S&P500 is making a divergence.
Could this mean that we are going to be seeing weakness creep into the real estate market with Lumber and copper falling recently?
SPY has tracked copper closely with the rise & fall in inflation and yields.
The most used commodity in the world should provide pivotal insights into the next turn in the market.
If we do enter disinflation/deflation that's typically not positive for equties despite the "soft landing" narrative.

Lumber & Stocks DivergeLumber is signalling disinflation.
Stocks are signaling inflation.
There has bee a high correlation with stocks and lumber for about 18 months. Is this correlation officially breaking or does it imply we will see some weakness in stocks?
Right now lumber is showing weakness.

XAUUSD Potential for Bearish drop to overlap supportLooking at the H4 chart, my overall bias for XAUUSD is bearish due to the current price being below the Ichimoku cloud , indicating a bearish market.
Looking for a pullback sell entry at 1901.743 where the 38.2% Fibonacci line and overlap resistance is. Stop loss will be at 1959.770, where the previous swing high is. Take profit will be at 1824.515, where the overlap support is.
Please be advised that the information presented on TradingView is provided to Vantage (‘Vantage Global Limited’, ‘we’) by a third-party provider (‘Everest Fortune Group’). Please be reminded that you are solely responsible for the trading decisions on your account. There is a very high degree of risk involved in trading. Any information and/or content is intended entirely for research, educational and informational purposes only and does not constitute investment or consultation advice or investment strategy. The information is not tailored to the investment needs of any specific person and therefore does not involve a consideration of any of the investment objectives, financial situation or needs of any viewer that may receive it. Kindly also note that past performance is not a reliable indicator of future results. Actual results may differ materially from those anticipated in forward-looking or past performance statements. We assume no liability as to the accuracy or completeness of any of the information and/or content provided herein and the Company cannot be held responsible for any omission, mistake nor for any loss or damage including without limitation to any loss of profit which may arise from reliance on any information supplied by Everest Fortune Group.

XAUUSD Potential for Bearish Continuation | 8th February 2023Looking at the H4 chart, my overall bias for XAUUSD is bearish due to the current price being below the Ichimoku cloud , indicating a bearish market.
Looking for a pullback sell entry at 1901.743 where the 38.2% Fibonacci line and overlap resistance is. Stop loss will be at 1959.770, where the previous swing high is. Take profit will be at 1824.515, where the overlap support is.
Any opinions, news, research, analyses, prices, other information, or links to third-party sites contained on this website are provided on an "as-is" basis, as general market commentary, and do not constitute investment advice. The market commentary has not been prepared in accordance with legal requirements designed to promote the independence of investment research, and it is therefore not subject to any prohibition on dealing ahead of dissemination. Although this commentary is not produced by an independent source, FXCM takes all sufficient steps to eliminate or prevent any conflicts of interest arising out of the production and dissemination of this communication. The employees of FXCM commit to acting in the clients' best interests and represent their views without misleading, deceiving, or otherwise impairing the clients' ability to make informed investment decisions. For more information about the FXCM's internal organizational and administrative arrangements for the prevention of conflicts, please refer to the Firms' Managing Conflicts Policy. Please ensure that you read and understand our Full Disclaimer and Liability provision concerning the foregoing Information, which can be accessed on the website.
