XAGAUD Longs (Daily)Higher low hold on support - buying back into the trend. Target is the resistance zone highlighted!
Bullish momentum
Trading IDEA --- NOT AN INVESTMENT OPPORTUNITY!
Commodity

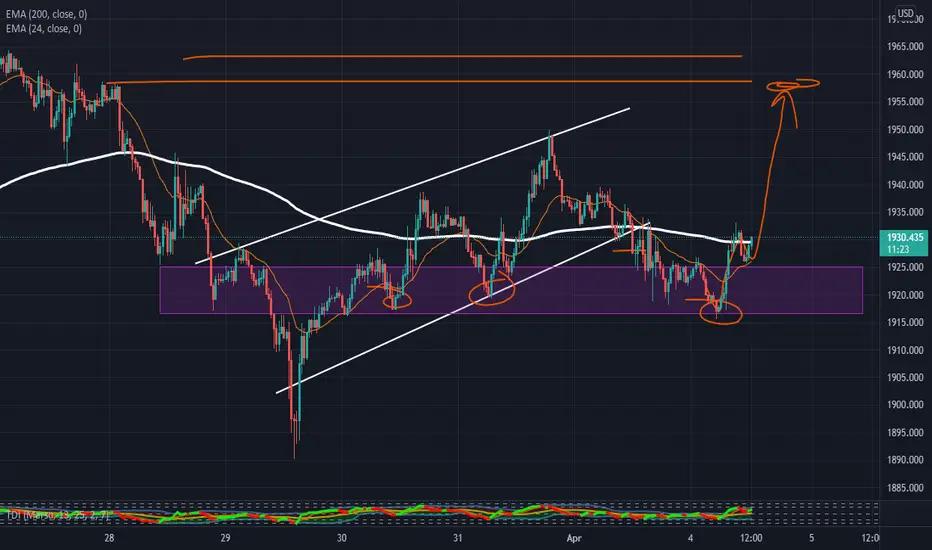
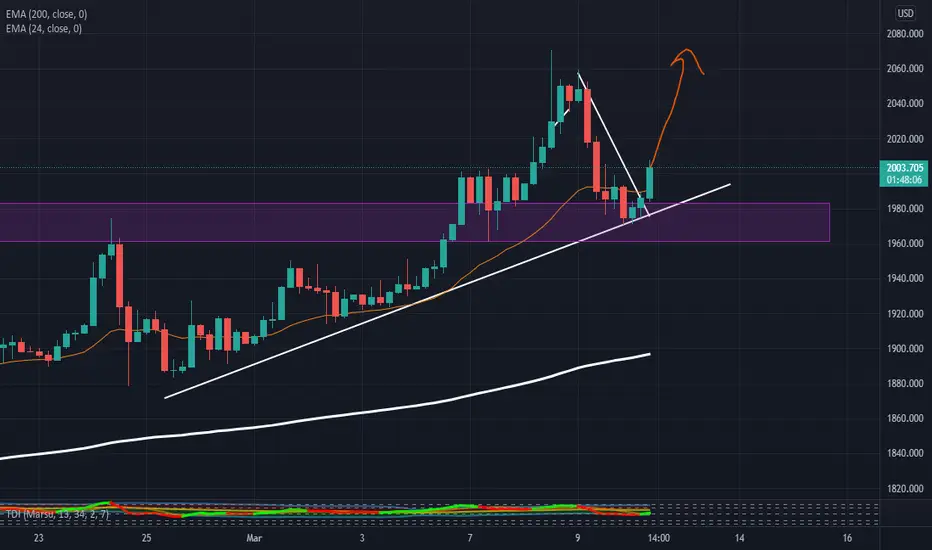
Gold (xauusd) looking to go out the box to touch 1980 zone, Gold against Dollar pair looking good to buy this week , Last week it breaks the long term resistance of 1929 area and trending above the zone, and its expect to touch 1980 zone this week and again price may return to box
Analysis only for education purpose

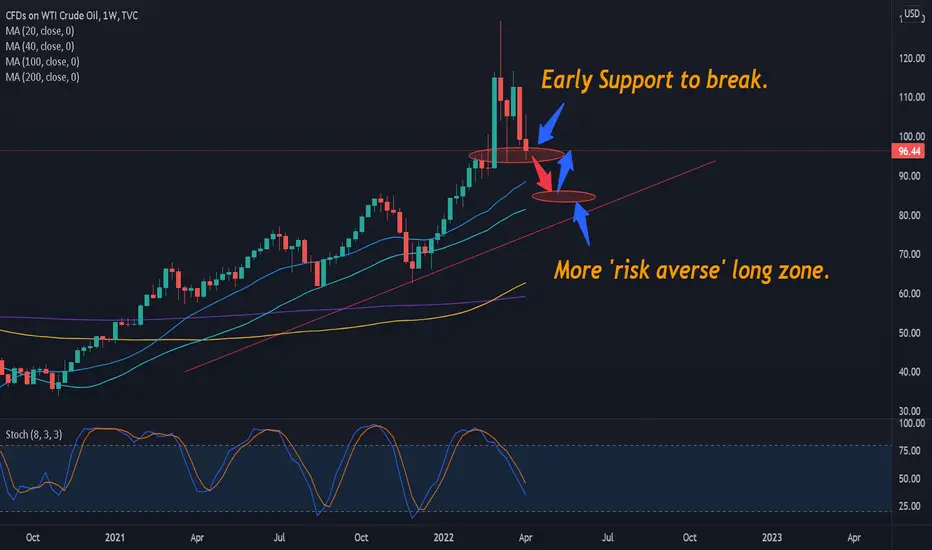
USOIL Longs on the fallOur OILUSD Chart demonstrates a fast change in sentiment dragging a key commodity down.
We are arriving at early support. For those with accurate RM you can stagger positions.
If you are happy to wait and are more risk averse, you take LZ2 underneath.
SHORT THEN LONG OILJust an idea and trade at your own risk.
Oil still bullish long-term and still in its uptrend.
Correction may be underway to 85 area before next move up.

USOIL M15 LongsIntraday Longs on USOIL bull trend - Nice HH/HL pattern continuing, with plenty of room to move up. Good hold on support.

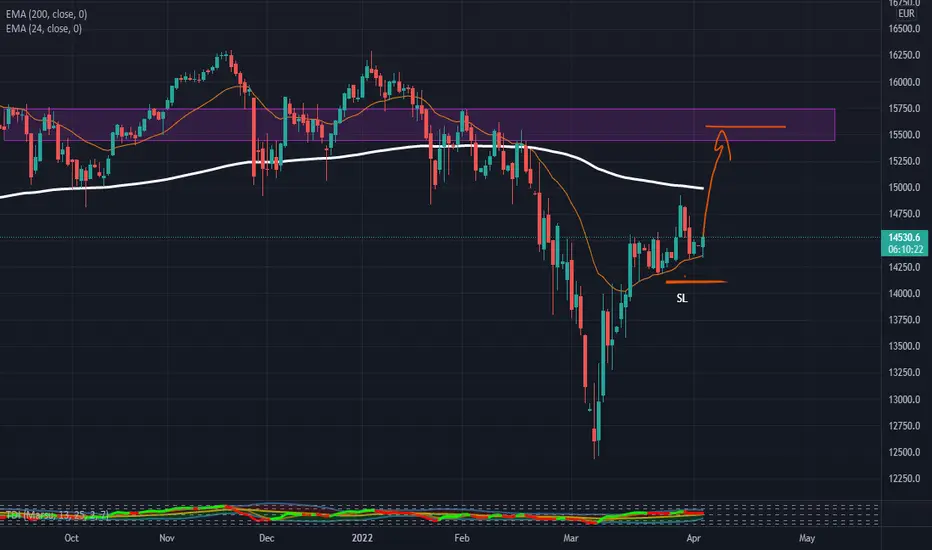
Ger40 Longs (Daily )Longs on Daily - Nice V-shaped recovery, divergent swing. Plenty of bullish momentum and a nice pullback to climb from to the supply zone, where price will decide what to do next.
TRADING IDEA --- NOT AN INVESTMENT OPPORTUNITY!
XAUUSD Longs (M30)Nice higher low formed after retest of demand zone with some bull divergence. Plenty of bullish momentum and Bears are looking quite weak at the moment.
TRADING IDEA --- NOT AN INVESTMENT OPPORTUNITY!
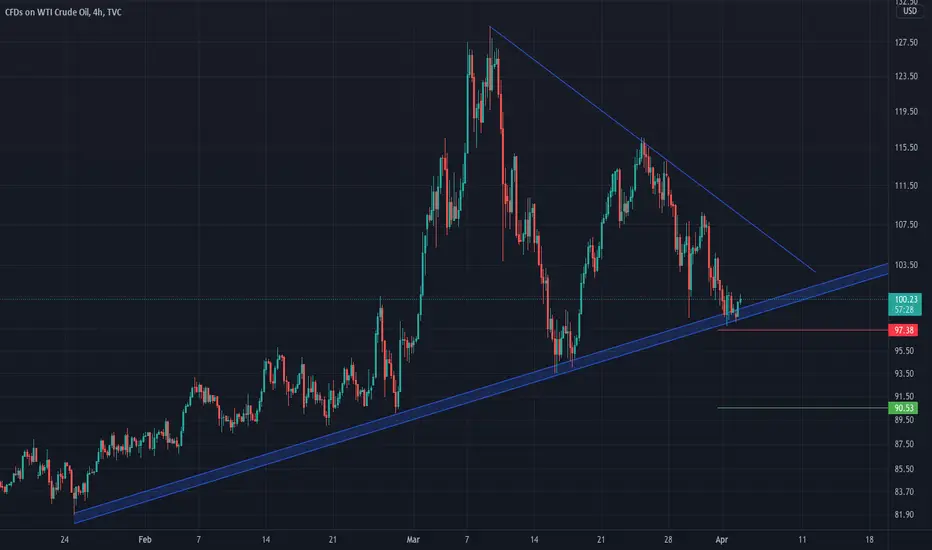
US oil symmetrical triangle US oil making a nice symmetrical triangle.
Short once it breaks the red ray
Target is marked with green ray
SL at 102
Sugar update - 03/04/2022remaining higher than 18.657 will reinforce the idea of wave 3 that target higher than 22, critical support at 17.746

DBC update - 03/04/2022 remaining higher than 24.28 will reinforce the idea of wave ((v)) of 3 that target higher than 30

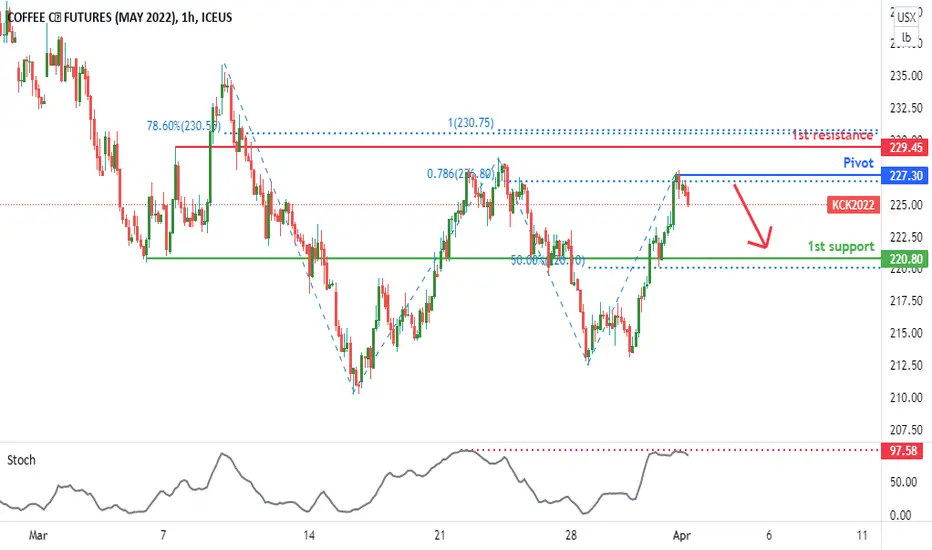
Coffee Futures (KCK2022), H1 Potential for Bearish Dip!Type: Bearish Dip
Resistance : 229.45
Pivot: 227.30
Support : 220.80
Preferred case: We see the potential for further bearish continuation from our Pivot at 227.30 in line 78.6% Fibonacci projection towards our 1st support at 220.80 in line with 50% Fibonacci retracement. Our bearish bias is further supported by stochastic indicator where it is at resistance level.
Alternative scenario: Price might move towards the 1st resistance level of 229.45 in line with 100% Fibonacci projection and 78.6% Fibonacci retracement.
Fundamentals: No major news
Cocoa Futures (CCK2022), H1 Bullish BounceType : Bullish Bounce
Resistance : 2639
Pivot: 2552
Support : 2500
Preferred Case: Price is near pivot level of 2552 in line with 50% Fibonacci retracement and 78.6% Fibonacci projection. Price can potentially bounce up to the 1st resistance level of 2639, in line with 78.6% Fibonacci projection, along with a graphical swing high resistance. Our bullish bias is further supported by stochastic indicator where price is near resistance level.
Alternative scenario: Price might continue to drop towards the 1st support level of 2500 in line with 78.6% Fibonacci projection.
Fundamentals: No Major News

HGK2022 (Copper Futures) | H1 Bullish PressureType : Bullish Pressure
Resistance : 4.7730
Pivot: 4.7000
Support : 4.6415
Preferred Case: Price is near pivot level of 4.7000 in line with 50% Fibonacci retracement. Price can potentially rise up to the 1st resistance level at 4.7730, in line with 78.6% Fibonacci retracement and 78.6% Fibonacci projection. Our bullish bias is further supported by the stochastic indicator where it is at resistance level.
Alternative scenario: Price might also dip towards the 1st support level of 4.6415 in line with a graphical swing low support.
Fundamentals: No Major News

Decline of the US Dollar Means Commodities Will Continue To RoarThe pound sterling, the United Kingdom’s foreign currency instrument, was the global reserve currency in the 19th century and the first half of the 20th century. For decades, the US dollar has been the world’s reserve currency, which became official in 1944 after a delegation from forty-four allied countries decided that the world’s currencies would no longer be linked to gold but pegged to the US dollar, which was linked to gold. The Bretton Woods Agreement established the authority of central banks to maintain fixed exchange rates between their foreign exchange instruments and the US dollar. In turn, the US would redeem US dollars for gold on demand. The redemption option ended in 1971 when President Richard Nixon announced that the United States would no longer convert dollars to gold at a fixed value.
The dollar’s link to commodities
Three factors that will continue to weigh on the dollar’s global role
Expect higher base prices for commodities
Long-term trends are very bullish
Buying dips is likely to be the optimal approach
For seventy-eight years, since the end of World War II, the US dollar has been the king of the currencies. On December 27, 1945, the participating countries signed the Bretton Woods Agreement. On August 15, 1971, President Nixon abandoned the gold standard. On February 4, 2022, a handshake on a “no-limits” support agreement between Chinese President Xi and Russian President Putin may go down in history as the beginning of the end of the US dollar as the leading world reserve currency. The watershed event could have far-reaching consequences for markets across all asset classes. Commodities are global assets. The end of the dollar’s reign as the monarch of money will likely lift raw material prices in dollar terms in the coming years.
The dollar’s link to commodities
As the world’s reserve currency, the dollar has been the leading global pricing mechanism for most commodities. Over the past decades, a rising dollar often weighed on commodity prices as the essentials became more expensive in other currency terms. A weak dollar encouraged buying as prices fell in different foreign exchange instruments.
While the US is the world’s leading economy, the population at around 333 million is only 4.2% of the total number of people on our planet. Therefore, the dollar’s link to commodities is financially based on the US position in the global financial markets and not on the supply and demand equations for the raw materials.
If the dollar’s role in the world declines, its link to commodity prices will diminish.
Three factors that will continue to weigh on the dollar’s global role
King dollar is facing a challenge in 2022 as world economic and political events threaten its dominance. The US dollar faces at least three issues that continue to erode its purchasing power and role in the global economy:
Inflation - The February US CPI and PPI data pointed to the highest inflation in over four decades. The March data will be even worse. The Fed began increasing short-term interest rates but remains far behind the inflationary curve. Rising inflation erodes the US dollar’s purchasing power.
Geopolitical tensions - The war in Ukraine and China’s support for Russia has dramatically changed the geopolitical landscape. In the leadup to the expansionary move, Russia reduced its US dollar reserves, increasing holdings in euros and gold. Sanctions on Russia will likely cause China to follow the same course. China is the world’s second-leading economy, and Russia is a leading commodity-producing country. As China and Russia move away from using the US currency as a reserve currency, the dollar’s global role will decline. Geopolitical tensions have accelerated the descent.
The decline of fiat currencies - The rise of cryptocurrencies is a sign of the fall of fiat currencies. Cryptos derive value from bids and offers for the currencies in an open and transparent market that transcends borders. Fiat currencies derive value from the full faith and credit in the governments that issue the legal tender. Meanwhile, rising commodity prices signify the decline in the dollar’s purchasing power.
The dollar index measures the US currency against other world currencies, but it is a bit of a mirage as when all fiat currencies lose value, it is not apparent. The dollar index measures the US currency against other world reserve currencies, including the euro, yen, pound, Canadian dollar, Swedish krona, and Swiss franc. The most significant weighting, at 57.6%, is against the euro currency. The dollar may be moving higher against the basket of currencies, but that does not mean that all of them, including the dollar, are losing value.
Expect higher base prices for commodities
The decline of the dollar and all fiat currencies makes purchasing power drop and commodity prices rise. Therefore, a strong dollar index has not weighed on many commodity prices over the past year.
The weekly chart shows that the dollar index has rallied, making higher lows and higher highs since early 2021. Over that period, most commodities have risen to multi-year and all-time highs. The strength of the dollar did nothing to restrain increasing raw material prices.
Meanwhile, higher US interest rates increase the cost of carrying commodity inventories and boost the US dollar’s value against other currencies.
The weekly chart of the US 30-Year Treasury bond futures shows the pattern of lower highs and lower lows, pushing long-term interest rates higher.
The bottom line is that a rising dollar and increasing US interest rates have not stopped commodity prices from rallying since early 2021.
Higher interest rates, rising inflation, geopolitical turmoil leading to supply chain issues, and sanctions that interfere with many raw materials supply and demand equations mean that production costs are rising. The base prices for raw materials are moving higher.
Long-term trends are very bullish
Bull markets rarely move in straight lines, and since commodities are highly volatile assets, corrections can be brutal. However, the long-term charts in four leading commodities, copper, crude oil, corn, and gold, display the same bullish patterns.
The quarterly chart of COMEX copper futures shows the bullish pattern over the past two decades.
The highly political crude oil market displays the path of least resistance of the price is higher. US energy policy and geopolitical turmoil have only exacerbated the upward trajectory of the energy commodity since April 2020.
Corn’s price path has been higher, making higher highs and higher lows for decades.
Gold’s bull market dates back over two decades. Gold may be the best example of the decline in fiat currency values as it is a hybrid between a commodity and a foreign exchange instrument.
Many other commodities display the same long-term trends. The recent strength in the US dollar means that commodity prices in other currencies have followed even more bullish price paths over the past year.
Buying dips is likely to be the optimal approach
The trend is always your best friend in markets. While short-term and medium-term traders follow technicals that depend on the market’s sentiment, long-term trends are a function of macro and microeconomic factors. The decline of fiat currency values continues to push commodity prices higher.
Over the past decades, price corrections have been long-term buying opportunities in the commodities asset class. The economic and geopolitical landscapes point to a continuation of the trend. Buying on price weakness has offered optimal results. Even if the US dollar index continues to rise, it will not mean the currency is strong. The foreign exchange market is a mirage that only measures one fiat currency’s value against another. Commodity prices are the actual value indicator, and the long-term trends reveal that currencies are all losing purchasing power.
We remain bullish on commodities. However, the higher the prices, the more vicious the corrections will become. Buying when they look the worse could be the best course of action over the coming months and years.
--
Trading advice given in this communication, if any, is based on information taken from trades and statistical services and other sources that we believe are reliable. The author does not guarantee that such information is accurate or complete and it should not be relied upon as such. Trading advice reflects the author’s good faith judgment at a specific time and is subject to change without notice. There is no guarantee that the advice the author provides will result in profitable trades. There is risk of loss in all futures and options trading. Any investment involves substantial risks, including, but not limited to, pricing volatility , inadequate liquidity, and the potential complete loss of principal. This article does not in any way constitute an offer or solicitation of an offer to buy or sell any investment, security, or commodity discussed herein, or any security in any jurisdiction in which such an offer would be unlawful under the securities laws of such jurisdiction.

SUGARUSD (2022 March 8th Trend Line)After the retest of the Trend Line, Enter a Long Position at the closing price of the retest candlestick at 0.19536. Next, place the stop loss beneath EMA 20 Close Price 0.19441. Set Take Profit at 0.19916 and 0.20072.

USOIL Longs (M30) IntradayUSOIL longs, third retest of demand at a higher low. Looking to resume the bull trend and make moves higher. In line with higher TFs.
TRADING IDEA --- NOT AN INVESTMENT OPPORTUNITY!
OIL, THREE REASONS why did the price fall by 28%!WTI CRUDE OIL. About a week ago, oil almost has reached its all-time highs ( ATH ), but a few days later it fell by 28%. Why could this happen? Let's look at the situation in more detail!
FIRSTLY, the White House promised to take oil sanctions off Venezuela in exchange for intensified negotiations between President Maduro and the country's opposition. Although the country positions itself as a friend of Moscow but the situation inside the country can make its own adjustments. To recall, the country is in deep crisis and its national currency has been devalued by 97%, but it has the largest crude oil reserves in the world! Would you miss such an opportunity?
SECONDLY, despite Iranian air attacks on bases in Iraq, the Nuclear deal is expected to be signed next week. This would allow the U.S. to ease sanctions on Iran and allow the country to sell more Iranian oil . But of course we need to watch the official statements of the governments.
THIRD reason, the British prime minister may visit Saudi Arabia next week to ask the country's leadership to increase the country's oil production. So far this is just a rumor, but could it come out of nowhere?
These three reasons could have triggered the OIL price to fall!
What do you think of the oil market? Share your thoughts in the comments!
Friends, push the like button and share with your mates - that would be the best THANK YOU!

Palladium Fakeout!There is plenty of volatility in the markets due to current events happening around
the world right now and Palladium is an example of this.
An all-time high was created in May 2021 at $3017. Price then went into consolidation
using the weekly 200 simple moving average as support.
From there, we have seen a gradual increase in price, and by the end of February,
price was just $7 shy of the all-time high.
The second week of March saw the breakout we were all anticipating, but this was
short-lived as price has now retreated back into the consolidation zone.
This is the very reason why we wait for confirmation following a breakout before
jumping into positions after a long period of consolidation. This is something we
make our members aware of.
Many traders and investors would have taken a position in Palladium as soon as it
broke out but we understand that when price consolidates for a lengthy period of
time, it could form a fake breakout.
We will continue to stand aside until our confirmation is met and preserve our
capital in the meantime so that we can use it for high-probability opportunities.
See below for more information on our trading techniques.
As always, keep it simple, keep it Sublime.

Gold Attempts Record High!Gold had an attempt at the August 2020 all-time high at $2075 this month but has
come short of even breaking through this level.
Price was only $5 away from having a shot at creating a new record high, but the
sellers came in strong to ensure that never happened.
What does this mean for price now? Since there has been some short-term weakness,
we want to identify areas of support that price may come to. This support could act
as a springboard that helps to push price back towards this all-time high resistance level.
Price is now trading below the $2000 round number, so the next level of support based
on this timeframe is the previous all-time high from September 2011 at $1920.
There is another level just before that, which is also classified as a strong level of support,
and that is last year’s high at $1959.
We will have to keep an eye on Gold because if there is a breakout, we could be in store
for a long-term trend lasting several years.
See below for more information on our trading techniques.
As always, keep it simple, keep it Sublime.

Seasonal Futures Market Patterns Corn SoybeansSeasonal Futures Market Patterns Corn Soybeans
Hey traders today I wanted to go over the best Seasonal Patterns in the Corn & Soybeans Futures Market. Corn and Soybeans and other grain markets follow an annual reliable seasonal pattern revolving around supply demand planting cycles. Knowing when to find these seasonal market patterns on your charts can really benefit us in our trading of Corn and Soybeans.
Enjoy!
Trade Well,
Clifford

Wheat: Is the bull market over?Hello and Welcome,
We expect wave (3) to end at 1157.6 which at this level wave (3) will equal 3.618 multiply of wave (1).

XAUUSD (Gold) Longs H4Very simple higher low set up, volatile bounce from higher low at support /demand zone. Targeting the highs as first TP and let the rest run.
TRADING IDEA --- NOT AN INVESTMENT OPPORTUNITY!
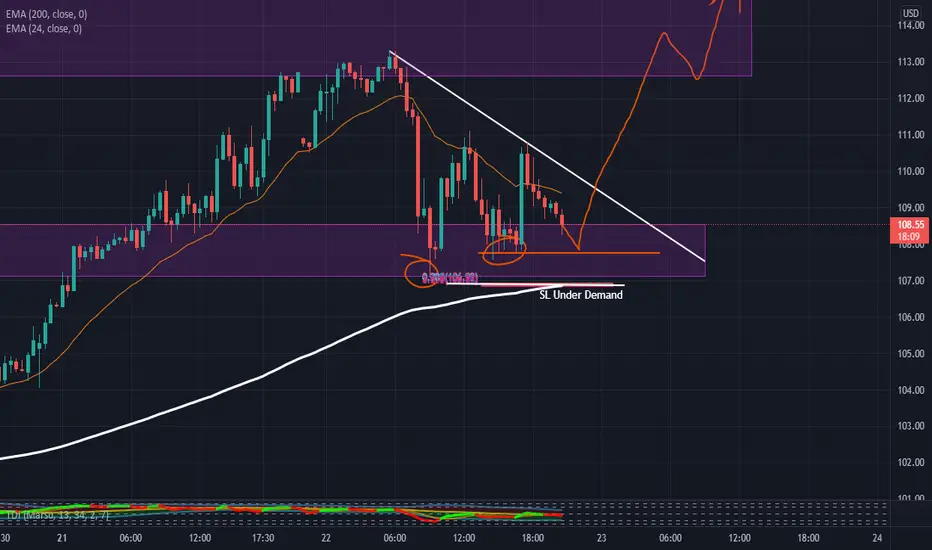
Micro analysis on Crude Oil - to spike once morePreviously, in what was hoped to be a blow off top, there was a need for crude oil prices to close the gap soonest.
Well, it did... thing is, it closed the gap, only to reopen with gusto.
In a Gap and Close, we know it is a reversal.
In a Gap and Run, we also know that the gap may or, more likely, not to be tested, and prices continue the trend strongly.
In the crude oil scenario, it closed the gap (rectangular black box in chart) , only to reopen it with bullish looking candlesticks. The 4H MACD has not yet crossover bullishly, but suggest potential to.
Crude oil is now more likely to spike up to the last high, and even exceed it, some time within the rest of this week.
In correlation, yesterday we saw the S&P500 and NASDAQ post its worst day since Oct 2020, but it is suspected to have more downside momentum, given another reason to trigger a crude oil price spike.
Now... IF, and when, prices should retrace, it should fall back to close that gap, and close it more permanently. By then, it should be below the 4H 55EMA.
Heads up!
