Gold Go down first and then go up fastMonthly in Red, Weekly in Blue, short term(8 hours) in Pink and 45 mnts in Black
Very simple case. We are in a stage where the probability of going upward is high. But this idea is about 45 mnts
Eventually I see the gold at 1832 but shall we take every drop of water available, of course yes when possible.
Because it has run fast 1750 to 1814, it must retrace towards 50% and 61.8% of 45 mnts which is in Black and with a support from weekly fib level 23% around 1775 area.
Agree so far???
What next? once it reaches 1775 area, No evaluation is needed because it will then try to go to the confluence of weekly , monthly and daily fib level which is 1830.
Please let me know what you think. gold is considered as complicated, is it really?
Commodity

BHP - Will a fed rate hike lead to a breakout in the SP?History says it will.
I expect next years rate hike will lead to a rally in PM's and commodities, as it did back in early 2016.

GOLD - Wyckoff Price Cycle!Hello TradingView Family, this is Richard, and if you like this idea, kindly support with a like or a comment.
I found GOLD chart as a great practical example of Wyckoff's Theory.
GOLD is overall bullish trading inside the brown channel and it is currently sitting around the lower bound/brown trendline acting as non-horizontal support.
So we are looking for trend-following buy setups. Unless of course, the bears manage to break below 1750, which would invalidate the idea.
As per Wyckoff Price Cycle, we are currently in an accumulation phase. For the Markup to start, we need the bulls to prove control by breaking the blue channel upward.
As per my trading plan:
Since the blue channel is already valid, I will be waiting for a momentum candle close above the last major high in gray to buy.
Always follow your trading plan regarding entry, risk management, and trade management.
Good luck!
All Strategies Are Good; If Managed Properly!
~Rich

Silver (XAGUSD) - Support, Resistance, Trendlines - 2021 - DaySilver (XAGUSD) - 2021 Support Resistance, Trendlines (Daily Chart):
-Resistance Price Levels (colored horizontal lines above current price)
-Support Price Levels (colored horizontal lines below current price)
-Trendline Resistances (diagonal yellow lines above current price)
-Trendline Supports (diagonal yellow lines below current price)
note: chart is on log scale.

USO (US Oil ETF) - Support, Resistance, Trendlines - 2021USO (United States Oil Fund ETF) - 2020 to 2021 - Support, Resistance, Trendlines:
-Resistance Price Levels (colored horizontal lines above current price)
-Support Price Levels (colored horizontal lines below current price)
-Trendline Resistances (diagonal yellow lines above current price)
-Trendline Supports (diagonal yellow lines below current price)
note: chart is on log scale.

UNG (Natural Gas ETF) - 2021 - Support, Resistance, TrendlinesUNG (United States Natural Gas Fund) - 2021 - Support, Resistance, Trendlines:
-Resistance Price Levels (colored horizontal lines above current price)
-Support Price Levels (colored horizontal lines below current price)
-Trendline Resistances (diagonal grey lines above current price)
-Trendline Supports (diagonal grey lines below current price)
note: chart is on log scale.

Gold Flag BreakoutGold had another flag breakout which should signal the end of consolidation atleast for the short term. With larger pattern breakout still intact, the expected uptrend from this breakout can extend to a formidable run on the upside too.
Targets are on the chart.

Silver ReversalSilver has been in a downtrend since hitting the top of the flag/channel.
The price has nearly touched the bottom of the channel and is expected to bounce back towards the top again giving a good long entry opportunity with an excellent risk reward setup.

XAUUSD LONG TO $2300 (ALTERNATIVE SCENARIO)As many of you who follow me, know by now I am short on Gold down to 1570 long term as my main bias. I have even uploaded the analysis on my page which you can go back on see. However, this here is an alternative analysis and has a likely chance of coming into play. After last years strong bullish momentum, Gold has spent most of this year within a correction phase which now seems to be complete according to the Elliot Wave Theory.
Gold is now in it's final stages before making its next big move. I am expecting one more micro push down on Gold towards the 1745-1735 price, before we see Gold start pushing back up again. Don't forget, this is an ALTERNATIVE to my Gold short analysis. I am still holding both my long (1742) and short (1870) positions hedged against each other, in accordance to all the previous analysis I have uploaded on my page (feel free to go check them out).
I will be catching this move on behalf of myself & my Account Management investors within my private fund. Drop a like and follow if you would like to see more analysis uploaded.

Wheat is going to start Wave.5If this down-trend is Wave.4, I am waiting to reverse and take profit!

A continuous short trend for BRENT OIL!At the end of the last week and after the sudden emersion of omicron coronavirus, the price of oil faced a dramatic decrease! In the beginning of this week, after a slight consolidation upward, it has fallen even more dipper than the point which was closed previous week.
Right now in this position I guess that the upward correction is about to finish and in minimum case the fall to its last area is possible.

TINTINTINTINCheatsheet for Tin. Tin futures plus the only three 'real' equity postions one can consider

Bulls are getting ready in Silver?!?Yes, it seems like the bulls are getting ready to attack!
IF the silver price overcomes the 23.6 % Fib level and 50's MA with a sustained close around 23.30 USD, it would be time to fasten your seat belts.
IF XAG/USD doesn't overpower this critical resistance area and is making a move to the south, I would take another short trade into consideration. But this situation needs to be re-evaluated.

WHAT IS GOLD GONNA DO??So, I think that come market open today Gold could open around 1760 or even where it is at now but we should see a correction up to 1840!

Zinc | Bullish sign for this Winter 2021MCX - Zinc offers 2 opportunity to ride the bullish trend. From the seasonality historical data, it has been always witnessed that by the end of November price starts accumulating demand the demands of the market.
As represented in the above chart, wait for the price to come near our area of interest and wait for other bullish conformations.

Bearish Flag Pattern Setup on Gasoline, Target at 2Trend Analysis
The main view of this trade idea is on the 4-Hour Chart. Gasoline futures (RBOB) appears to be in a bearish flag pattern setup. The pole of the flag can be seen from the sharp decline from 2.55 highs to the initial low at 2.31. Then RBOB began to gingerly channel lower and is currently retesting the 2.31 support level. If RBOB breaks below that support, the futures contract is expected to decline towards 2. A negation of this move will be observed if RBOB breaks above the resistance trendline towards 2.35.
From a Daily perspective, RBOB is pulling back from the 2.55 highs. Next levels of support on the Daily Chart is seen around the 2.10 price level.
Technical Indicators
On the 4-Hour Chart the moving averages (MAs) are above the RBOB price. Also there have been negative crossovers on the short (50-MA), medium (100-MA) and long (200-MA) fractal moving averages. The RSI is below 50 with the KST recently having a negative crossover.
Recommendation
The recommendation will be to go short at market, with a stop loss at 2.35 and a target of 2. This produces a risk/reward ratio of 3.39.
Disclaimer
The views expressed are mine and do not represent the views of my employers and business partners. Persons acting on these recommendations are doing so at their own risk. These recommendations are not a solicitation to buy or to sell but are for purely discussion purposes.

BRENT adjusted for DXY (rev)The DXY-adjusted BRENT has reached the previous level and is trying to move above the pre-pandemic highs despite the RSI divergence

BRENT adjusted for DXYThe DXY-adjusted BRENT has already reached the previous level and is trying to move above the pre-pandemic highs despite the RSI divergence

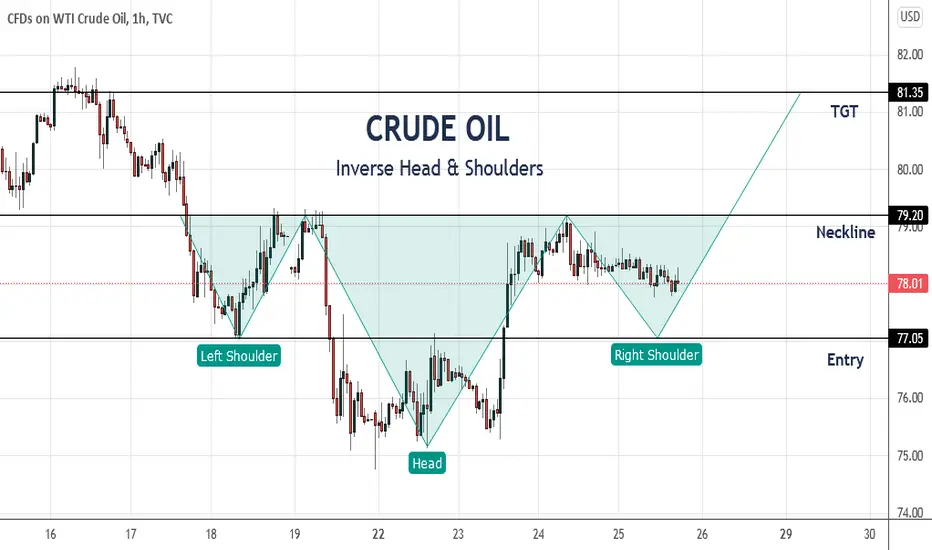
Crude Oil Inverse Head & ShouldersCrude Oil is likely making the formation of Inverse Head & Shoulders as the price got rejected at the neckline again which should push it down to make the low of right shoulder. If the neckline is broken without a fall its still a buy and if broken after the pattern gets formed its an obvious bullish breakout.
Gold Wedge MovementGold has been trading in a wedge formation where it has touched the bottom again, a reversal is on the cards which should take the price higher above the $1900 mark as observed on the chart as previous highs have the difference of 75 points.
A great risk reward setup for a long here.

XAUUSD (GOLD)GOLD is moving in a HH and HL formation with trendline support. Already this rally expand and came a long way. But we still have room to upside towards 1875. and if bulls are exhausted and bear attacking then we could see a sell-off towards 1845. So careful and Good luck!

XAUUSD | GOLD will likely have a bounce from the daily MAHello Traders,
Gold is pushing towards the downside at the moment, I believe its next pitstop will be the resistance which now became support or the 25-50 moving averages.
You can enter either on the resistance with bullish engulfing candle as confirmation or moving average with bullish engulfing candle.

Copper Triangle BreakoutCopper had a triangle breakout few days ago, it is providing a long entry again as the price is currently retesting the breakout post having a minor correction. Risk reward remains highly favorable given the current setup.
