Gold’s weekly outlook: Sept 21-25Gold yet again remained in consolidation even after another pattern breakout offering no respite to either camps (bulls and bears) as they just kept biting into one another for glory. This kind of nonchalant movement with every weekly candle closing above the trendline support remains one of the key indicators for the continuity of the trend on technical front while fundamentals remains largely supportive for higher prices as officially pandemic enters into the 2nd wave though comparatively less lethal but its forcing countries to reimpose strict restrictions which raises uncertainty of economic revival even more along with ongoing geopolitical concerns. For gold this year is quite special as it has one of the most important events – U.S Presidential Elections which in itself is a huge ambivalence generator. While dollar tried several times to reverse course post Fed policy outcome which ultimately it could not adding to the bullish build of gold and stop-start vaccine trials continue to add anxiety. To watch this week – Fed Chair Powell testimony and other important economic events.
On the chart –
While gold’s showcased struggle continues as it remains range bound unable to break away, its pretty evident from the price action that its technically in a strong bull trend breaking pattern after pattern on weekly basis. Again another triangle was broken in daily timeframe which was also retested reigniting hopes of a directive move finally. We have 2 scenarios –
1. Gold closed above the support, till this is held it can go to $1963. If this is crossed it can move towards $1989. And if this is taken out it can rally to $2008.
2. Bearish bets remain in denial as breakouts are happening on the upside except scalp trades.
Bullish view – Bulls finally broke the ongoing triangle which they were stuck in plus even had a successful retest of the breakout adding to the prevailing bullishness and hopefully this move should lead to a directive price action. The technical aspect looks quite formidable post the breakout, fundamentals too provide massive support as uncertainty is on the rise with pandemic evolving into 2nd wave in most countries along with overly concerning geopolitical issues. And being the election year gold can see sharp moves with $2700 plus as a mid to long term target.
Bearishness still remains off grid.
On larger terms, Gold remains bullish and prices are expected to head higher.
Possible trades are on both sides but mainly on upside, gold can be bought above $1955 for the targets of $1963 and $1989 with a stop loss placed below $1944. Longer term target $2008.
Dips towards support (and breakout region) can be used to create longs for the above mentioned targets.
Shorts can be useful for scalp trades only.
Commodity

Gold has an early indication of potential breakout rallyThe week ended with Gold going nowhere, but early indications suggest a possible potential breakout rally.
Compare the current setup with the previous setup and entry (white arrow), the technicals appear similar yet again, as well as candlestick pattern shows a bullish harami... just like a coiling pattern.
Having said that, being very wary about this imminent (and yet to be confirmed breakout) as the higher time frame suggest a toppish area about 2100, and an expected handle pattern to form (faint yellow line).
Meanwhile, the breakout range spans 1930 to 1980.
Perhaps other aspects might be giving some insights, especially the USD?
Watch for it.

MCX Natural gas Struggling at Strong SupportOn the chart above, we have plotted three different MAs on the 1-hour chart of MCX Natural gas futures. As you can see, the 62 MA is indicating a downtrend ahead. And 5 MA & 30 MA are crossing each other for a reversal. This reversal can be for 174 to 180 levels.
But according to the support & resistance trendline, we may see continue price collapsing.
I have also highlighted a support area with green color . Particularly from this point, it's taking a u-turn.
For safe traders, short positions can be initiated after 170 levels.
Targets: 167.6 - 165 - 162.6 - 160

Gold's Most Important Levels Before The WeekendIn this analysis I will go over Gold's most important levels right now and show you a potential trade set-up.
The first and most important thing that I want to highlight is the location of the price currently with regards to its distance to horizontal levels.
We can see that the price is far away from the nearest very strong support zone, but also not very close to the resistance zone level I.
The means that we cannot possibly enter a trade with a good risk-reward. Please be patient and don't enter a trade right now. Wait for the price to get closer to a horizontal level first.
Seeing as gold is trending bullish I would suggest to wait for the price to get close to the horizontal resistance zone and get ready for a short trade there. There is quite a chance on a reversal seeing that gold reversed from bullish to bearish the last three times it hit the zone around $1,970.
The horizontal support zone at the bottom seems the be extremely strong, so I wouldn't trade any short position beyond the $1,900 level. You should probably take profit slightly above the zone at around $1,915.
Follow me for consistent high quality updates, with clear explanations and charts.
Please like this post to support me.
- Trading Guru
--------------------------------------------------------------
Disclaimer!
This post does not provide financial advice. It is for educational purposes only!


Elliott Wave View: Correction in Oil CompletedElliott Wave View of Oil (CL) suggests the cycle from August 26 high has ended as wave II. The correction unfolded as double three Elliott Wave Structure. Down from August 26 high, wave ((W)) ended at 40.22 low. The bounce in wave ((X)) ended at 41.87 high. Afterwards, the commodity resumed lower and ended wave ((Y)) at 36.21 low. This ended wave II pullback in the higher degree. Since then, the commodity has resumed the rally higher.
Up from wave II low, wave 1 ended at 38.45 high. Wave 2 dip unfolded as zigzag correction and ended at 36.67 low. Currently, wave 3 higher is in progress. The subdivision of wave 3 is unfolding as 5 waves impulse structure. Wave ((i)) ended at 37.82 high and wave ((ii)) dip ended at 36.82 low. Wave ((iii)) higher ended at 40.34 high. Afterwards, pullback in wave ((iv)) ended at 39.51 low. Oil can push for another high before ending wave 3 and followed by a pullback in wave 4 later. As long as 36.21 low stays intact, expect the dips in 3,7 or 11 swings to find support. However, oil still needs to break above August 26 high at 43.78 to confirm that next leg higher in wave III has already started. Otherwise, wave II could still unfold as a double correction before upside resume again.

Gold’s weekly outlook: Sept 14-18Gold for the 4th straight week proved to be directionless with moves limited in a range although its continuously sending bullish signals via breakouts over and over again. Probably it can be seen as a wait and watch game going on in gold as it seeks further direction from U.S Fed which is due to meet on 16th for its monetary policy or maybe its the same old operator play happening before a substantial move where all the retail bets are cleaned up before any actual movement. This stalemate from gold can be clearly contradicted by a breakdown in dollar and the ailing fundamentals across the the globe which is still reeling under pressure of the pandemic along with geopolitical tensions which seem to tag along without any concessions. All the buzz around a probable vaccine and its availability remains just a noise until one is actually cleared by the FDA which continues to be a generator of uncertainty. Going with the above factors it is quite easy to detect the ongoing trend of gold which remains bullish until things make an one-eighty degree move. To watch next week – U.S fed meeting, Brexit talks and other important economic data.
On the chart –
While gold poses indecisiveness chart suggests otherwise as pattern breakouts are being registered and tested almost every week which advocate continuity of the trend once the lull ends. Last week once again gold had a triangle breakout which can be eyed as an extension of previous triangle which had already been broken. The 10 day moving average (weekly) has also been tested as it caught up with time consolidation suggesting gold might finally be ready to make a directive move. We have 2 scenarios –
1. Gold closed above the support, till this is held it can go to $1945. If this is crossed it can move towards $1963. And if this is taken out it can rally to $1989.
2. Short bets continue to be void in the given situation except scalp trades.
Bullish view – Bulls again held the support of previous high as they continue to fight in the consolidation. It might be tiring for the bulls to just hang around without being able to push the price higher but this movement only strengthens the trend as the supports are getting stronger with every retest with a possibility of a large move remaining high. Apart from the ongoing uncertainty caused by pandemic and other cross border tensions, technically gold has provided another breakout which should aid the bulls further for the quest of $2700 plus in medium to long term.
Bears still don’t find any trade support as trend remains bullish.
On larger terms, Gold continues to remain bullish and prices are expected to head higher.
Possible trades are on both sides but mainly on upside, gold can be bought above $1947 for the targets of $1963 and $1989 with a stop loss placed below $1935. Longer term target $2008.
Dips towards support (and breakout region) can be used to create longs for the above mentioned targets.
Shorts can be useful for scalp trades only.


Gold’s weekly outlook: Sept 07-11Gold remained in consolidation even after the breakout as a fresh wave of profit booking ensued across all asset classes in the last 2 days of the week which can be again termed as flushing of retailer bets since the fall was limited to the retest of previous high/breakout. This agonizing movement of gold which is clearly saddled between the support and resistance does not offer much of composure in either camp as bets are getting restless and indeed once the consolidation gets broken it would lead to a quite large directional move which ideally should be on the upside since its already having a bullish breakout along with fundamental support comprising mainly of a weaker dollar. The Fed Chair Powell again reiterated the easing stance and signaled lower rates till the situation improves which is an unlikely scenario in short – medium term as the damage done/being done by the pandemic is severe and would require substantial amount of time to get economic order back to normal. On the positive side, again the vaccine news is doing rounds with countries claiming to use them for general masses as they seem satisfied by the trial but again none of the said vaccines have got a FDA clearance which makes them an uncertainty. For gold both situations are a win win as uncertainty remains at large in either which should keep the trend intact. To watch next week – ECB meeting and other important economic data.
On the chart –
Gold had a red week of consolidation but nothing changed on the technical front rather trend got even more confirmed as the supports got tested again. Gold remains in an uptrend with breakouts being revisited only to get more credible as the dollar remains weak and in downtrend which shall be the likely scenario going forward as well since the money printing is in no sight of being paused or stopped. We have 2 scenarios –
1. Gold closed above the support, till this is held it can go to $1945. If this is crossed it can move towards $1963. And if this is taken out it can rally to $1989.
2. Short trades remain baseless except scalp trades.
Bullish view – Bulls had another hostile week as the price moved between the support and the resistance with no clear direction even after having a breakout in the week before. This actually is a favorable move for bulls since the trend is getting intense by every successful retest and the price is expected to flare up once the range gets broken. This sums up the technical part, coming to fundamentals the concerning factors continues to persist with pandemic not shying away from scaling up (turning into 2nd wave) and geopolitical tensions remaining escalated, it still doesn’t offer any kind of respite acting as a positive catalyst for gold. Price remains on track for new highs and the pattern target of $2700 plus.
Bearishness still fails to entice.
On larger terms, Gold remains bullish and prices are expected to head higher.
Possible trades are on both sides but mainly on upside, gold can be bought above $1936 for the targets of $1945 and $1963 with a stop loss placed below $1924. Longer term target $1989.
Dips towards support (and breakout region) can be used to create longs for the above mentioned targets.
Shorts can be useful for scalp trades only.

SILVER - XAGUSD video top-down AnalysisHello everyone, here is the top-down analysis for Silver, feel free to request any pair/instrument or ask any questions in the comment section below.
Best of luck!

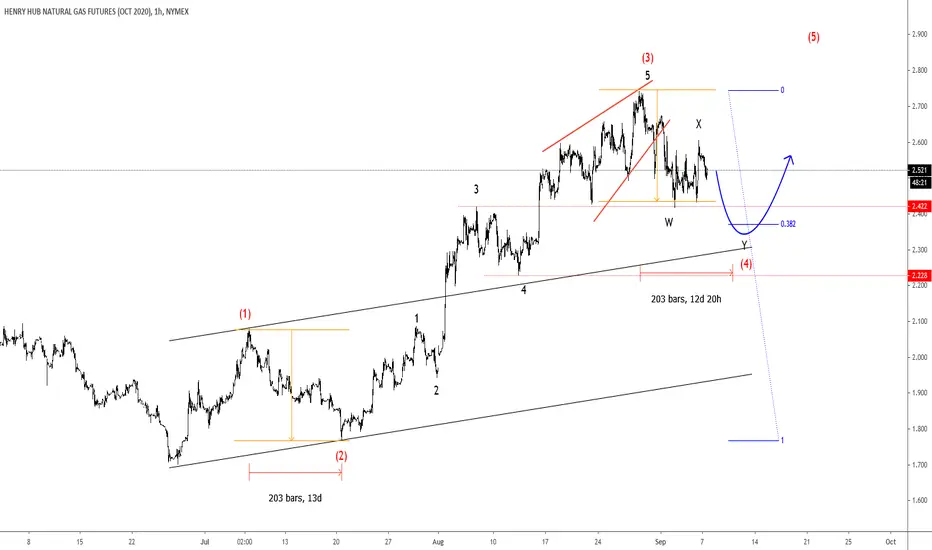
Natural Gas At Support - Elliott wave analysisHi traders,
Looking at natural gas, we are still tracking a correction in wave (4). Currently it is trading at 2.4 support level, which can be first potential turning point zone, however, in case of a deeper corrective W-X-Y, price can retest 38.2 Fibo. retracement and the base channel line (2.2 area), where support can also be seen.
How High Will MCX Silver Go?By following the symmetrical triangle (ST), we can say that if candles will consecutively crossover the upper line, the silver will hit the following targets: 72460 - 75360 - 77800 - 80000+
According to the ST, the final targets are 86700 to 88000 levels.
But if you look at the volume and S RSI indicators, it is planning for a downtrend. And at present, silver is very close to the control price line. Hence, a downtrend may start from this point. A breakdown of control price can initiate a new fall for 70000 - 55785 - 50570 levels.
Keep eyes open while it breaks ST upside or downside. It's a key for the smart traders.
If you have any questions regarding this article, you can ask without hesitation through the below comment box.

USOIL + 20%Trade Recap.
Trade of the week for me, manages to catch this big drop on oil that I had been patiently waiting for, for a while now. Set an order at my key level of resistance, got triggered and then she was off. Some sort of correction on OIL has needed for a while now technically it was a great set up, big accumulation on this pair for a while, catching people out and building liquidity for the big move.

GOLD Monthly chart’s “Rally & Tell”Just to recap again...
1. In early 2013, a “friend” brought me to a gathering, where the charismatic speaker claimed he was told that Gold would be tracking higher than the last high, etc. There was a following who dumped everything and loaded up on Gold then. I never went back because I saw the opposite. Clearly, from the chart, I was not wrong, although I was apparently the only one at that time to be bearish on Gold. Chided and ran over I was... I left Gold alone for a long time. Clearly, this “friend” never came back to speak to me for very obvious reasons.
2. In August 2018, I started tracking Gold closely (having left it aside since the last high in 2013), and this was due to an Enquiries for my opinion by a long time friend who suddenly was keen to accumulate Gold. Since then, I saw a multi-year opportunity and wrote about it in my Gold Odyssey blog chapter until I migrated over to TradingView. The patterns observed since then are drawn here. Namely, a multi-year Cup & Handle. Previous idea posts depict the last two years worth of experience in technicals and in real trades.
3. The projection to Gold at USD2000 was observed since last year, particularly after Trump declared a trade war by imposition of trade tariffs.
4. Gold exceeded the target by almost 5%, particularly in 2020. So where to now?
From the monthly chart, few things catch my eye...
Firstly, the candlestick pattern of August. With a 5%ish long shadow above the candle, practitioners would read for a following down candle in September. While early into September, price retraced enough to find the first support of 1930(-1950). This area is significant historically as it was the 2011 rejected high. Probabilities stack up against staying above this level, although most of the analysis by others yelp about the support to bounce. Clearly, I am a lot more bearish in this view (similar to 2013) and perhaps I am one of the few seeing this as a possible move towards 1500, possibly to 1400 at the lowest point. Unthinkable.
Secondly, the MACD is burnig out in the rate of acceleration, and with a huge range of volatility, it looks to be able to pull back to 1800 with little effort and time, and even to 1500 (white support line).
Thirdly, 1800 is a good support for a very bullish case. But the C&H pattern might need a deeper retracement to 1600 or below.
Fourth, around the toppish area, the net interest of non-commercials (orange line, lower panel) and Top 8 Traders (yellow line, lower panel), all point to lowered interest, encouraging more downside.
Fifth, outside of this chart, the USD is setting up a strong bullish bounce back, having almost waterfalled over the past months. This would definitely put pressure on Gold prices, as well as any USD denominated commodities.
Fifth, it appears to be a time of moderation as all other asset classes are reacting, including cryptocurrencies.
Lastly, the seasonal cycle is aligned for Gold to rotate lower from now till end of year, possibly extending into February next year. As projected by the handle of the cup.
Whichever way Gold is going, there is definitely robust (up) trend, and being aware of the bigger picture helps going forward... as it clearly did over the past two years.
IF the Cup & Handle pattern plays out... just imagine the multi year target price upon breakout. 😳😉

Crude does not look sustainable...Yes, still bullish up trending, but honestly, look at the technicals and it’s like crazy...
Cannot keep this weak rally up for too much longer.
MACD is so bearishly divergent and recent rally is weak
Th ebottom panel is the net non-commercial interest and it has been steadily waning as price edge higher.
I thought it was going to give way earlier but everything is extending into September.
Now I still expect Crude to roll over in September...

Gold-ing down...Not something to short, but finally an opportunity to get ready for a second bite of the cherry, if not the last stop to boar the train is coming up... this expected pullback (mentioned before that it can pull back as deep at 1400-1600 technically, despite all rational reasoning) mane deeper than expected. Regardless, it allows an opportunity to look for entry points.
Technically, there has been a series of lower highs, albeit a lack of lower lows for now. It is resting at a horizontal support as well as the triangle support. Later next week, with a risk to break out of the triangle, and breakdown below 1910 (also meeting the 55EMA orange line support), it would be clear as daylight that Gold is retracing and not consolidating.
Other technicals suggest more downside to follow, for example, the MACD has crossed down in the bear territory. Other correlations include a strong bullish divergence of the USD to put downside pressure on USD denominated commodities like gold and oil (Crude oil gave way first).
1800 is the immediate target over the next two weeks. Watch for it.
By the way, the white arrows indicate my last trade entry and exit points. I walk my talk.

Buy The Dip - Trading 101After the hard crash of the stock markets (and cryptocurrency markets) we've seen gold suddenly take a big plunge. Obviously, you remember your trading lessons and you don't panic sell here. Instead, you buy the dip.
I marked a yellow area on this chart where I highlight the area I would still feel comfortable buying. If the price goes above $1940 a new uptrend might have started towards $2000 and I would say you missed the train.
Make sure to always have proper risk-reward for your trades. Don't buy too far in the middle between support and resistance.
I suggest a nice long trade here towards the ~$2000 region with a buy close to support around ~$1920. Good luck!
Follow me for consistent high quality updates, with clear explanations and charts.
Please like this post to support me.
- Trading Guru
--------------------------------------------------------------
Disclaimer!
This post does not provide financial advice. It is for educational purposes only!

Wait for XAU's Retracement and Enter With Great Profit PotentialAll info can be found on the chart. DMs are open!

Elliott Wave View: Further Correction in Gold Still PossibleGold 1 hour chart below shows that the metal has ended the cycle from August 18 high in wave 1 at 1911.20 low. From there, the metal then bounced higher and ended wave 2 at 1994.06 high. The bounce unfolded as flat Elliott Wave Structure. From wave 1 low, wave ((a)) ended at 1962.18 high. Wave ((b)) then ended at 1902.30 low. The metal then extended higher in wave ((c)), which ended at 1994.06 high. This ended wave 2 in larger degree.
Down from wave 2 high, the metal has resumed lower in wave ((i)), which ended at 1921.66 low. The subdivision of wave ((i)) unfolded as 5 waves impulsive Elliott Wave Structure. Wave (i) ended at 1955.70 low and the bounce in wave (ii) ended at 1967.45 low. Wave (iii) then ended at 1926.80 low and wave (iv) ended at 1945.94 high. The push lower in wave (v) ended at 1921.66 low. Currently, wave ((ii)) is in progress. While below 1994.06 high, expect bounce in 3,7 or 11 swings to fail for more downside. However, gold needs to break below August 12 low to confirm that next leg lower has started. If that low is broken, then the target to the downside is the 100% extension from August 7 high at 1800 level.

silver: long , corrections in play some possible buysStill a strong positive outlook on silver, may see further draw down into the 24 range if supports dont hold. Will update with some positions and better metrics, quick and dirty chart on the mobile app

Soybeans - Short IdeaI discussed this long trade back in may, I now see the short.. it just kept riding up!
There it is.. highlighted on the chart.


Gold’s weekly outlook: Aug 31 – Sept 04Gold finally had a green week after a gap of 14 days as U.S Fed reaffirmed its easing monetary policy rather it extended the timeline to few years from the earlier 2022 end. This move by the Fed indicates that the economic revival will be slow and painful as the pandemic is still creating fresh turbulence and will likely continue for sometime as historically seen during the Spanish Flu outbreak. Ample liquidity combined with bullish breakouts certainly makes gold the most desirable option mainly due to its safe haven class in times of uncertainty. Though the money from the dollar is also flowing towards equities pretty strongly as most world indices are hovering near/above all time highs, it might be getting fairly overstretched in terms of valuation and risk-reward and may well demand a pullback for further followup which again will be bullish for gold prices. The stage is set for gold to make a commendable move once again. To watch next week – Important economic data.
On the chart –
Gold posted its first weekly gains after the massive fall mainly on back of a lower dollar continuity which was confirmed by the Fed last week. The yellow metal at last broke out of the triangle consolidation which it was in for last 15 trading sessions signalling a fresh leg of upmove which should now test new highs. We have 2 scenarios –
1. Gold closed above the support, till this is held it can go to $1989. If this is crossed it can move towards $2008. And if this is taken out it can rally to $2033.
2. Short bets again go in limbo after the fresh bullish breakout except scalp trades.
Bullish view – Bulls finally made a green bar as dollar continued to decline breaking out of the triangle consolidation. This breakout opens up a new wave of uptrend allowing the metal another run towards its pattern target of $2700 plus which can be deemed quite optimistic in short run but nonetheless it is the breakout target which should be achieved in mid-long term. Factors supporting higher gold prices remain ultra supportive as pandemic continues to wreck havoc on global economies and geopolitical tensions remain elevated with no signs of any near term respite. Technicals have turned super bullish after the breakout with price expected to test new highs.
Bearishness remains unmindful after the breakout.
On larger terms, Gold continues to remain bullish and prices are expected to head higher.
Possible trades are on both sides but mainly on upside, gold can be bought above $1970 for the targets of $1989 and $2008 with a stop loss placed below $1955. Longer term target $2033.
Dips towards support (and breakout region) can be used to create longs for the above mentioned targets.
Shorts can be useful for scalp trades only.
