Commodity Channel Index (CCI)
DXY (###/USD) MA actionUSD Strength continues in the fundamentals, (Economic trouble of Covid19)
Looking at the MA here, the next wave is up
Use of Price action (resistance becomes support etc)
and Hull Moving Average, FIB levels, and TSICCI
Custom indicators found here:
www.tradingview.com
MT4 Bots available
COPPER 15M INTRADAY TRADING STRATEGYMCX Copper Intraday Trading Strategy
Now, the first thing you must understand is how the CCI works in relation to the price and the moving average:
CCI is measuring how fast the price moves away from an average price (20-period MA).
The further the price moves away from the 20-period MA, the stronger the momentum.
When the price is hugging the 20 MA means that it’s lacking momentum.
When the price is pulling from the MA it signals momentum.
Now, we still haven’t used the CCI readings, which is the missing component you’ll learn next. The relationship between the price and the moving average is just not enough to trade copper profitably.
So read on…
The CCI indicator will help you measure the strength of Copper momentum. This will help us decide if it’s worth to pull the trigger and trade Copper.
Here is what you must know:
If you want to buy Copper the price has to cross and close above the 20-period moving average.
At the same time, the CCI must cross above the zero line.
for this particular copper trade setup, futures traders can hide their stop-loss below the candlestick that triggers the trade for a long position. At the same time, the profit target needs to be multiple times as much as your stop-loss to help you balance the risk.
Note* A break below the 20 MA can be a good profit-taking strategy. Moving average breakouts are known for signaling a trend reversal.
Visual CCI with Smoothing OptionVisual CCI by Bert2020
Displays the CCI (Commodity Channel Index) indicator with background colors making it more readable when the values go outside the bands.
Here's a list of included features:
All the CCI parameters (length and band limits) are configurable from the user interface.
The smoothing option (off by default) helps eliminate some noise by applying EMA when CCI values are outside the defined limits . It also merges events that belong in the same trend.
The colors and line styles are all configurable including the band and shape backgrounds.
USDCAD 120min CCI turn signals diver retest hi TLBThis could have been posted 2-3 hr ago but trading comes first. There are still pips available, but more importantly the turn signals were so clear that the value is in the tutorial.
The first warning that uptrend was waning came with strong CCI divergence from price
Second, there was an abc down which corrected back up to retest the high (following divergence)
at the CCI high of the price hi retest, the CCI had a short signal with slanted rooftop. Together, those were a
first signal short.
Third, CCI crossed down thru an up-trendline giving a later signal short.
Reversal signal would be when CCI crosses back up thru a down-trendline on CCI (not shown)
GBPUSD: Bullish Divergence on the 1H ChartThere are multiple divergences on the chart that seemed to have provided valid signals.
A few hours ago there was a bullish divergence at the time when the price touched and bounced off the support-line.
Price went up a few pips and probably is now in a pullback phase, so it might be a good opportunity to enter the trade.
The profit target is at 1.236 - just below the red resistance line.
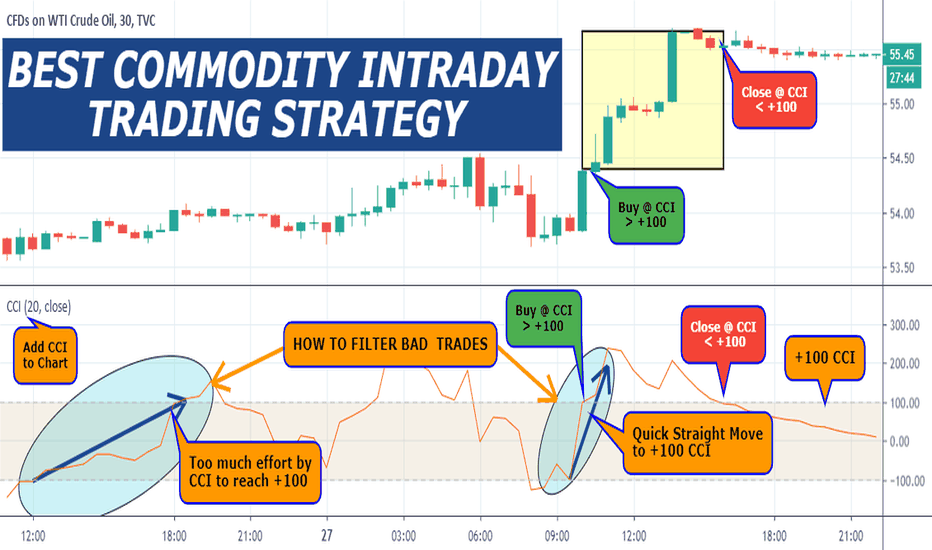
BEST COMMODITY INTRADAY TRADING STRATEGY Before we outline the best commodity intraday trading strategy, it’s important to understand that trading commodities are different from trading Forex or stocks. Every financial asset has its own set of unique characteristics. The commodity market has its own behavior, that’s why some strategies are more suitable than others to generate profits from commodity trading.
We’re going to reveal some of the most well-kept commodity trading secrets only known by successful commodity traders.
Let’s now see what commodity trading strategy you can use to buy and sell products in the commodity market.
Here is the link to "Best Commodity Intraday Trading Strategy" pdf.
tradingstrategyguides.com
USDCAD 240 min Short. CCI lessons on end of continuationThe apex of triangle on CCI is below zero, favoring down. The move continues down from the previous CCI short signals. Because there is now a CCI divergence, two new things may be on the horizon.
1) at some time, the price is likely to be revisited where it was when the CCI low prior to the divergence occurred.
2) normally a CCI divergence occurs before trend can change direction. CCI now has a diver, but before the price turns up, usually price needs to retest the low or drop lower. The only exception to this is if CCI spurts north so fast that it crosses up thru the zeroline before pulling down a bit
Direction change to Long requires what is described in 2) above, and requires a CCI crossing up thru a down-trendline and moving above -100.
EURAUD 240 min CCI tlb Fib Retr Short-sidewaysThe EURAUD retraced 38.2% of last move down and CCI has a 2 bar flat, a reliable short signal. But the apex of the CCI triangle is slightly above 0, slightly favoring upside. we could see a retest of swing high before downside gets serious. Conservative traders would wait. Aggressive traders might have to enter again later or take SL 1.586- 1.626. Watch the spread
Entry 1.618
TP1 1.604
TP2 1.594
then 1.57, 1.55
USDCAD 240 min CCI TBL LongH4 CCI crossed up through down-trendline and signaled Long as soon as it was inside -100. A second opportunity is likely following likely retracement to 38.2% of move up from 12:45 on 5.22.19
Entry ~ 1.34068
SL ~ 1.3395
TP1 ~ 1.344
TP2 When CCI crosses down thru an up-trendline


