XAUUSD Golden Cross and the 1H MA50 are supporting this uptrend.Last time we looked at Gold (XAUUSD), it gave us two sell opportunities both of which hit their targets (see chart below):
The price has been rising since, supported by the 1H MA50 (blue trend-line) and on top of that, the 1H Golden Cross has been formed. Last time we saw that pattern was on August 23. On that fractal, once the 1H MA50 broke, the price pulled-back to the 0.5 Fibonacci retracement level and then resumed the uptrend.
As a result, we are bullish already since the 1H MA50 is supporting. If it holds, we will simply add one more buy position when the pull-back hits the 0.5 Fib. In either case, the target is 1953 (Resistance 3).
-------------------------------------------------------------------------------
** Please LIKE 👍, FOLLOW ✅, SHARE 🙌 and COMMENT ✍ if you enjoy this idea! Also share your ideas and charts in the comments section below! **
-------------------------------------------------------------------------------
💸💸💸💸💸💸
👇 👇 👇 👇 👇 👇
Commoditysignals

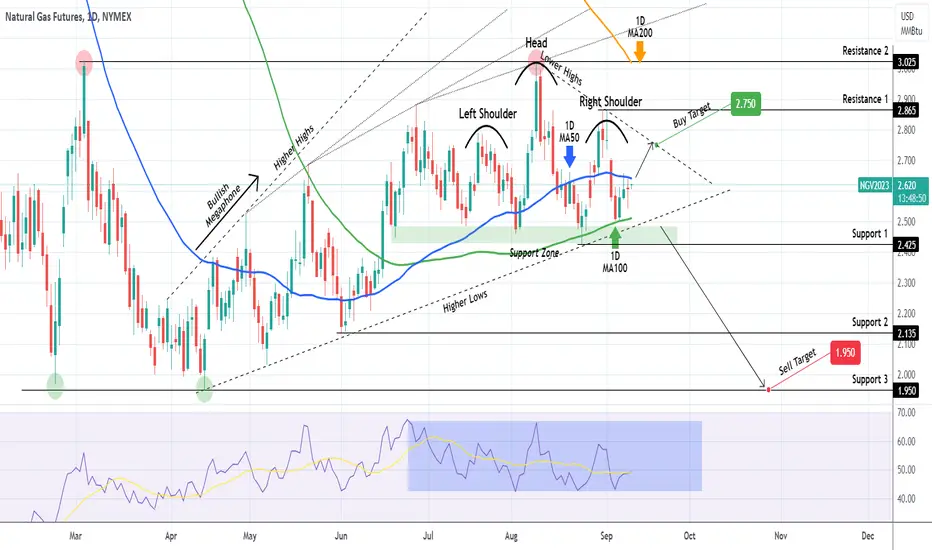
NATURAL GAS Short-term buy but expect long-term reversal soon.Natural Gas (NG!) is struggling to get past the 1D MA50 (blue trend-line), which is the short-term Resistance and at the same time is supported by the 1D MA100 (green trend-line). The long-term pattern is a Bullish Megaphone and besides the 1D MA100, the price action is supported by the pattern's bottom (Higher Lows trend-line).
Recently however the pattern that has emerged is a Head and Shoulders (H&S) and it remains to be seen if it establishes itself on the immediate price action, which technically means a sharp decline, as in theory it is a bearish pattern.
On the short-term, you can buy up to the Lower Highs trend-line and target 2.750. On the long-term we believe the upside is limited by the 1D MA200 (orange trend-line), which is now on Resistance 2 (3.025) and most likely will reject any spike on Resistance 1 (2.865).
So on the long-term, if the price breaks and closes a 1D candle below the 1D MA100 and Higher Lows trend-line, we will open a long-term sell and target 1.950 (Support 3).
-------------------------------------------------------------------------------
** Please LIKE 👍, FOLLOW ✅, SHARE 🙌 and COMMENT ✍ if you enjoy this idea! Also share your ideas and charts in the comments section below! **
-------------------------------------------------------------------------------
💸💸💸💸💸💸
👇 👇 👇 👇 👇 👇
XAUUSD Sell opportunity within the Channel Up.Gold (XAUUSD) is trading within a Channel Up pattern but following the downtrend since the September 01 High, it may be nothing more but a Bull Flat pattern.
Whatever the long-term case, the short-term trade is a sell as the price appears to be getting rejecting at the top of the pattern, while the 1D MA200 (orange trend-line) looms above. Our target is the bottom (Higher Lows trend-line) at 1918.
We will make short-term trades only and buy every candle closing above the 1D MA200, targeting the upper Resistance levels. Similarly we will sell if a 4H candle closes below Support 1 and target 1903.50 (Support 2).
-------------------------------------------------------------------------------
** Please LIKE 👍, FOLLOW ✅, SHARE 🙌 and COMMENT ✍ if you enjoy this idea! Also share your ideas and charts in the comments section below! **
-------------------------------------------------------------------------------
💸💸💸💸💸💸
👇 👇 👇 👇 👇 👇

XAUUSD Quick buy opportunity but upside long-term limited.Gold (XAUUSD) may have formed a Golden Cross on the 4H time-frame but the bullish effect can only be short-term as the Falling Wedge pattern limits the upside below its Lower Highs trend-line. Regardless of that, ahead of an emerging 4H MACD Bullish Cross, we are using this opportunity for a quick buy that targets 1947.50. A closing below the 0.5 Fibonacci retracement level, invalidates that opportunity and opens the way to a deeper decline such as on August 02.
-------------------------------------------------------------------------------
** Please LIKE 👍, FOLLOW ✅, SHARE 🙌 and COMMENT ✍ if you enjoy this idea! Also share your ideas and charts in the comments section below! **
-------------------------------------------------------------------------------
💸💸💸💸💸💸
👇 👇 👇 👇 👇 👇

Strong Sell signal (ZS soybean) futuresShort term trade entry (ZS Soybean) with risk/reward of 2.03.

XAUUSD Buy opportunity on a 2 week horizon.Gold (XAUUSD) has been consolidating for the past 2 trading sessions, having held the 1D MA50 (blue trend-line) on Friday as Support. With the 4H STOCH RSI on a similar cross-to-cross sequence as July 05/06, one last pull-back inside the Ichimoku cloud, can be a Higher Low on an emerging Channel Up. If we see that rebound, we will buy and set a quick target just below the 4H MA200 (orange trend-line). If the price manages to close a 4H candle above it, we will buy again and pursue a final target at 1975 (just below the 2.5 Fibonacci extension).
-------------------------------------------------------------------------------
** Please LIKE 👍, FOLLOW ✅, SHARE 🙌 and COMMENT ✍ if you enjoy this idea! Also share your ideas and charts in the comments section below! **
-------------------------------------------------------------------------------
💸💸💸💸💸💸
👇 👇 👇 👇 👇 👇

WTI OIL Rejection on the 4H MA50, sell if the 4H MA200 breaks.WTI Oil (USOIL) got emphatically rejected yesterday on the 4H MA50 (blue trend-line) and formed another Lower High on the emerging Channel Down. The price is now approaching the 4H MA200 (orange trend-line) on an additional sell signal as the 4H MACD just completed a Bearish Cross, the first since the one that started this correction at the top on August 10.
As a result, we are waiting for this bearish continuation confirmation, and will sell after a 4H candle closing below the 4H MA200. Our target will by 76.00 (just above the 1D MA50 (red trend-line)).
-------------------------------------------------------------------------------
** Please LIKE 👍, FOLLOW ✅, SHARE 🙌 and COMMENT ✍ if you enjoy this idea! Also share your ideas and charts in the comments section below! **
-------------------------------------------------------------------------------
💸💸💸💸💸💸
👇 👇 👇 👇 👇 👇

XAUUSD Still nothing bullish about it yet.Gold (XAUUSD) broke below the 1D MA200 (orange trend-line) for the first time since December 19 2022 and that of course didn't do any favors to the bullish cause. The trend remains bearish within a Channel Down since the May 04 2023 High and the technical outlook gets even worse as the 1D MA50 (blue trend-line) is on course to forming a 1D Death Cross below the 1D MA200, projected at the end of the month (would be the first such pattern since July 04 2022).
As a result we expect the price to remain under pressure and eventually test the 1W MA100 (yellow trend-line) within 1860 - 1850, regardless of a potential decline on the DXY (green trend-line) which was unable to lift Gold as we saw in June.
The bullish trend will re-emerge only if the price breaks above the Channel Down and more specifically, the 0.618 Fibonacci retracement level from the bottom at that given time.
-------------------------------------------------------------------------------
** Please LIKE 👍, FOLLOW ✅, SHARE 🙌 and COMMENT ✍ if you enjoy this idea! Also share your ideas and charts in the comments section below! **
-------------------------------------------------------------------------------
💸💸💸💸💸💸
👇 👇 👇 👇 👇 👇

XAUUSD hit the 1D MA200 for the first time in 8 months.Gold (XAUUSD) easily hit our 1913 short-term target within the narrow Channel Down, as presented on our last idea (see chart below):
As the price hit yesterday the 1D MA200 (orange trend-line) for the first time since December 20 2022, it is time we look again at the long-term charts in an attempt to identify potential Support/ Pivot levels.
On the 1D time-frame, we have Support 1 at 1893 which along with Resistance 1 (1987.50) form the most noticeable pattern on the 1D time-frame, a 3 month Rectangle. As long as the 1D candle closes above the 1D MA200, we may see a bounce without a Support 1 test. In either case, we will buy and target 1980 (just below Resistance 1). If however a 1D candle closes below Support 1, we will take the loss and sell instead targeting the 1W MA50 (red trend-line) at 1870.
Amidst the above, once/ if the 1D RSI breaks below its 30.00 barrier, Gold will start turning into a solid long-term buy opportunity, so regardless of having hit the 1870 target or not, we will close the sell and turn bullish again, targeting initially the 1D MA50 (blue trend-line).
-------------------------------------------------------------------------------
** Please LIKE 👍, FOLLOW ✅, SHARE 🙌 and COMMENT ✍ if you enjoy this idea! Also share your ideas and charts in the comments section below! **
-------------------------------------------------------------------------------
💸💸💸💸💸💸
👇 👇 👇 👇 👇 👇

XAUUSD Sell signal on the 1H time-frameGold (XAUUSD) broke below its 1H MA50 again (blue trend-line). Within the 2-week Channel Down pattern on this chart, every time the price broke below the 1H MA50, it continued to a Lower Low. With the 1H MACD also under a Bearish Cross formation, this is a clear technical sell signal and below Support 1 (1925) is Support 2 (1912.60) for a potential Lower Low. We are targeting 1913. If however the price closes above the 1H MA200 (orange trend-line) we will take the loss and buy instead, targeting the Lower Highs trend-line at 1970.
-------------------------------------------------------------------------------
** Please LIKE 👍, FOLLOW ✅, SHARE 🙌 and COMMENT ✍ if you enjoy this idea! Also share your ideas and charts in the comments section below! **
-------------------------------------------------------------------------------
💸💸💸💸💸💸
👇 👇 👇 👇 👇 👇

XAUUSD: Huge Inverse Head and Shoulders calling for rebound.Gold crossed and will most likely close the day under the 1D MA50 turning the 1D timeframe marginally bearish (RSI = 44.910, MACD = 1.190, ADX = 25.617). The strongest Support level is the 1D MA200, which right now is trading exactly on S1 (1,893). We have however a bullish pattern close to completion as the price may be forming the RS of a huge Inverse Head and Shoulders pattern. This technical pattern is associated with long term bottoms and bullish trend reversals.
The price is now on the 0.236 Fibonacci level from the market high. The longer it stays there, the more likely it is to hold it as the neckline's Support and complete the Inverse Head and Shoulders. A 1D candle close over R1 (1,987.50) will target the 0.786 Fibonacci and that is our long position's target (TP = 2,040).
## If you like our free content follow our profile to get more daily ideas. ##
## Comments and likes are greatly appreciated. ##

XPDUSD Sell signal below the 1D MA50.Palladium (XPDUSD) has been trading inside a Channel Down for almost a year. The price ic currently near the top (Lower Highs trend-line) of the Channel Down, just below the 1D MA50 (blue trend-line), which is intact since May 23.
The 1D RSI action shows that we are potentially in a similar spot as December 27 2022, when a deep Lower Low sequence started. As long as the price stays below the 1D MA50, we will stay bearish and target the middle of the Channel Down at 1050.
-------------------------------------------------------------------------------
** Please LIKE 👍, FOLLOW ✅, SHARE 🙌 and COMMENT ✍ if you enjoy this idea! Also share your ideas and charts in the comments section below! **
-------------------------------------------------------------------------------
💸💸💸💸💸💸
👇 👇 👇 👇 👇 👇

XPTUSD Long-term buy opportunity near 1 year Support.Platinum (XPTUSD) is having a strong start to the week following a streak of 2 red 1W candles rejected on both the 1W MA50 (blue trend-line) and 1W MA200 (orange trend-line). Regardless of the obvious 1W Golden Cross pattern that those two are aiming to complete, the price got again near the 895 - 903 Support Zone, which has been closing all 1W candles above since September 2022.
With the 1W RSI on a bottom sequence similar to the February 2023, December 2021 and September 2021 fractals, we consider this an excellent long-term buy opportunity. Our target is the bottom of the Resistance Zone at 1100.
-------------------------------------------------------------------------------
** Please LIKE 👍, FOLLOW ✅, SHARE 🙌 and COMMENT ✍ if you enjoy this idea! Also share your ideas and charts in the comments section below! **
-------------------------------------------------------------------------------
💸💸💸💸💸💸
👇 👇 👇 👇 👇 👇

XAUUSD 1D MA50 in Support but MACD Bearish Cross threat.Gold (XAUUSD) kept the 1D MA50 (blue trend-line) as Support as it made a Friday rebound exactly on it. At the same time the 1D RSI bounced on its Higher Lows trend-line since the June 29 bottom.
As long as the price is closing above the 1D MA50 (and obviously the 1943 Support that was formed), the trend is bullish towards the Lower Highs with a 1978 short-term target. In order to extend the uptrend, a 1D candle needs to close above Resistance 1 (1987.50).
The biggest bearish signal however is the Bearish Cross on the 1D MACD that is about to be formed. This means that if the price breaks below the Higher Lows trend-line, it will be a sell signal towards Support 2 at 1913. If the 1D MA200 (orange trend-line) supports on Support 2 and 3, the long-term bullish trend remains intact.
-------------------------------------------------------------------------------
** Please LIKE 👍, FOLLOW ✅, SHARE 🙌 and COMMENT ✍ if you enjoy this idea! Also share your ideas and charts in the comments section below! **
-------------------------------------------------------------------------------
💸💸💸💸💸💸
👇 👇 👇 👇 👇 👇

COPPER Two year Triangle may finally break.Copper (XCUUSD) is trading within a Triangle pattern since the March 07 2022 High. The price is currently above the 1D MA200 (orange trend-line), supported twice by the 1D MA50 (blue trend-line). The 1D RSI shows that we may be replicating the July 15 - September 20 2022 fractal.
If the price breaks above the top (Lower Highs trend-line) of the Triangle, then based on the fractal should target initially the 1.5 Fibonacci extension level at 4.1800.
As long as it closes below the Lower Highs, we will sell and target the 3.6870 Support.
-------------------------------------------------------------------------------
** Please LIKE 👍, FOLLOW ✅, SHARE 🙌 and COMMENT ✍ if you enjoy this idea! Also share your ideas and charts in the comments section below! **
-------------------------------------------------------------------------------
💸💸💸💸💸💸
👇 👇 👇 👇 👇 👇

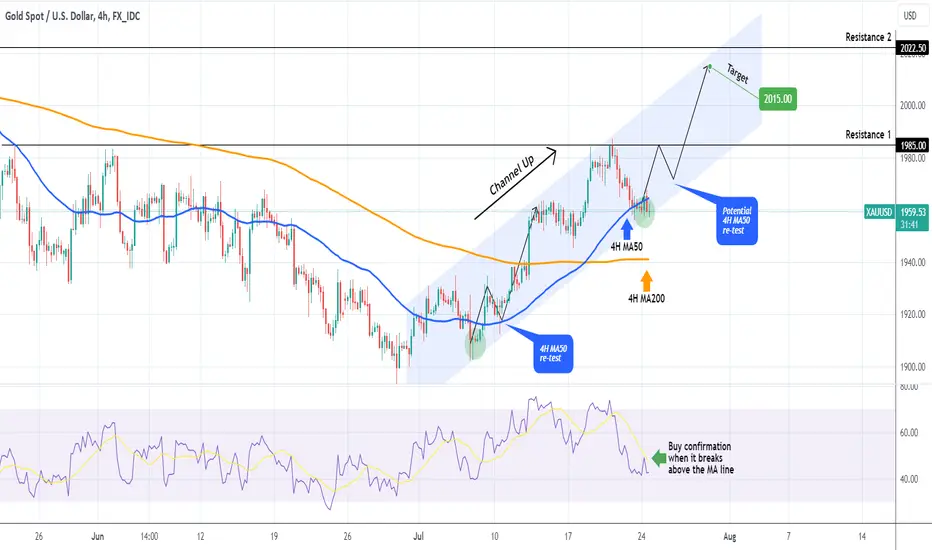
XAUUSD at the bottom of its 3 week Channel Up.Gold (XAUUSD) broke below the 4H MA50 (blue trend-line) and hit today the bottom of the 3 week Channel Up pattern that has been in effect for the whole month of July. This is a short-term buy signal as the 4H RSI is also on the same level it was on the July 06 Higher Low.
The lowest risk entry will be after the RSI breaks above its MA trend-line (yellow), as this has been a confirmed buy signal in at least the past 2 months. When it does, we will take a short-term buy and target 2015 (below Resistance 2 but Higher High for the Channel Up).
-------------------------------------------------------------------------------
** Please LIKE 👍, FOLLOW ✅, SHARE 🙌 and COMMENT ✍ if you enjoy this idea! Also share your ideas and charts in the comments section below! **
-------------------------------------------------------------------------------
💸💸💸💸💸💸
👇 👇 👇 👇 👇 👇
NATURAL GAS Buy lower, sell the break-outLast time we looked into Natural Gas (NG) we called for a buy entry (see chart below) right after the contact at the bottom (Higher Lows trend-line) of the Bullish Megaphone:
The 2.550 target has been hit but the rise didn't stop there, breaking even above the former 2.690 Resistance and making a Higher High in the process. The price is right now above the 1D MA50 (blue trend-line) but in terms of Risk/ Reward neither a favorable buy or a sell. We are willing to buy at 2.400 with a tight stop just below the Megaphone's Higher Lows trend-line and target 2.800 (below Resistance 1). If a 1D candle closes below the bottom (Higher Lows trend-line) of the pattern, we will sell and target the 1.950 Support.
The 1D RSI is trading inside a Channel Up pattern. If broken, it will be a first confirmation of a bearish break-out signal.
-------------------------------------------------------------------------------
** Please LIKE 👍, FOLLOW ✅, SHARE 🙌 and COMMENT ✍ if you enjoy this idea! Also share your ideas and charts in the comments section below! **
-------------------------------------------------------------------------------
💸💸💸💸💸💸
👇 👇 👇 👇 👇 👇

XAGUSD Massive success on last trade now looking for the next!Silver (XAGUSD) gave us a very successful sell trade on our last analysis (see chart below) on April 12:
The price rebounded right before hitting the 21.715 Pivot because it touched the 1W MA200 (orange trend-line). Even though May's rejection was done at the top (Lower Highs trend-line) of the Channel Down that started in August 2020, we may witness the break-out above this bearish structure finally as since the August 29 2022 bottom, a Bullish Megaphone and later a Channel Up are guiding the price action.
On top of that, Silver is completing the first 1W Golden Cross since May 2020. In any case we will not jump on this impulsively but rather wait for a clear bullish break-out signal, which will be if a 1W candle closes above the Lower Highs trend-line. In this case we will target Resistance 1 (26.230) and Resistance 2 (26.935) respectively. If the price gets rejected on the Lower Highs instead, we will wait for a buy on the 1W MA50 (blue trend-line).
Notice also the 1W MACD Bullish Cross that is about to be formed, indicating that a continuation of the current uptrend might be more probable than a rejection.
-------------------------------------------------------------------------------
** Please LIKE 👍, FOLLOW ✅, SHARE 🙌 and COMMENT ✍ if you enjoy this idea! Also share your ideas and charts in the comments section below! **
-------------------------------------------------------------------------------
💸💸💸💸💸💸
👇 👇 👇 👇 👇 👇

xauusd ⇨ when entering the short position.hello guys...
I believe the main trend is still bullish but there is some area in the lower level that should be touched!
on the other hand, the second yellow area is the QML area so we can expect a correction there!
I recommend you break your volume into three parts:
the first entering could be the second yellow area
the next one could be when the xauusd hunt the last higher high
and keep the last part when we get a confirmation for a short position in the lower time frame!
_______________________________
always do your research.
If you have any questions, you can write them in the comments below, and I will answer them.
And please don't forget to support this idea with your likes and comment

BluetonaFX - SILVER 26 Level Next TargetHi Traders!
There is strong resistance on Silver at the psychological 25 level. After the ascending channel break, there was a bullish wave towards the 25 level, and we now have a big slowdown in the bullish momentum.
Looking at the price action on the chart, the market looks like it wants to break the 25 level to target our long-term resistance level at 26.129, primarily due to the lack of any current pullbacks. However, we may need a new wave of bulls to achieve this.
That being said, the longer the 25 level holds, the more chance we have of getting a pullback to test the 24 level as support. If we get a momentum break and close above 25, then 26.129 is the next key level; there was a double top at this level in May 2023.
Please do not forget to like, comment, and follow, as your support helps us greatly.
Thank you for your support.
BluetonaFX

XAUUSD is trying to hold the 1D MA50. Huge rally if it succeeds.Gold (XAUUSD) eventually broke above the 2 month Channel Down and even made a candle closing above the 1D MA50 (blue trend-line) last week:
Currently the big development for buyers would be to hold the 1D MA50 and establish it as the new long-term Support. Based on both the 1D RSI and 1D MACD, Gold has alreayd formed a technical bottom similar to the February 27 2023 and October 21 2022 patterns. Assuming the long-term pattern is a Channel Up, this latest bottom is a technical Higher Low.
As a result, if the price breaks above Resistance 1 (1968.50), we expect a bullish extension first to Resistance 2 (2020) and then Resistance 3 and All Time High at 2080.
-------------------------------------------------------------------------------
** Please LIKE 👍, FOLLOW ✅, SHARE 🙌 and COMMENT ✍ if you enjoy this idea! Also share your ideas and charts in the comments section below! **
-------------------------------------------------------------------------------
💸💸💸💸💸💸
👇 👇 👇 👇 👇 👇

BluetonaFX - SILVER Ascending Channel 24.000 Target HIT!Hi Traders!
Our Silver ascending channel opportunity (LINK TO ORIGINAL IDEA BELOW) from a few days ago worked to perfection, and the market agreed with our bullish view. The 23.228 was finally broken with momentum, and we had a massive bull rally to our profit target of 24.000 to fulfil our opportunity.
We are now trading just above the 24.000 level. There is another resistance level at 24.521, so if the bullish momentum continues, that will be the next target.
Please do not forget to like, comment, and follow, as your support really helps us.
Thank you for your support.
BluetonaFX

BluetonaFX - USOIL 74 Target HITHi Traders!
Our range zone on USOIL worked exactly as predicted (LINK TO ORIGINAL IDEA BELOW). The range zone support of 66.88 refused to be broken, and the bulls took over to push the market up to the range zone resistance of 74.72.
Now, we need to see how the market behaves around this level, the psychological 75 barrier is just above, and there will be some resistance here as the market has not been above the 75 level in a couple of months.
Please do not forget to like, comment, and follow.
Thank you for your support.
BluetonaFX
