XAUUSD Close to a major bullish break-out!Gold (XAUUSD) closed on Friday above the 1D MA50 (blue trend-line) for the first time since August 12 that was practically the time that the stock market made its previous High. At the same time, Gold broke and closed above both the former Channel Down and Triangle patterns that we discussed where bullish break-out signals on our past analyses.
Despite the positives, the price remains within the long-term Channel Down pattern in late April. It is however the first time that the 1D MA50 breaks twice within a month during this 2022 downtrend. Also while the price was making a Triple Bottom on the 1615 - 1617 Support Zone, the 1D RSI has been rising on Higher Lows since September 26, a technical sign of a potential bullish reversal.
As a result the chances of the price breaking above the long-term Channel Down and testing the 1D MA100 (green trend-line) which has been untouched since May 09, are the best ever. That would be the major bullish break-out towards the 1D MA200 (orange trend-line). A closing within the Channel Down though, can target the Support again for a new re-test confirmation.
-------------------------------------------------------------------------------
** Please LIKE 👍, SUBSCRIBE ✅, SHARE 🙌 and COMMENT ✍ if you enjoy this idea! Also share your ideas and charts in the comments section below! This is best way to keep it relevant, support me, keep the content here free and allow the idea to reach as many people as possible. **
-------------------------------------------------------------------------------
You may also TELL ME 🙋♀️🙋♂️ in the comments section which symbol you want me to analyze next and on which time-frame. The one with the most posts will be published tomorrow! 👏🎁
-------------------------------------------------------------------------------
👇 👇 👇 👇 👇 👇
💸💸💸💸💸💸
👇 👇 👇 👇 👇 👇
Commoditysignals

XAUUSD Approaching a critical Resistance. Trading plan ahead!Gold (XAUUSD) has been trading within a Channel Down (blue) inside a Triangle pattern (dashed lines). The distinct characteristic is that the price hasn't had a 4H candle closing above the 4H MA200 (orange trend-line) since October 07. Even the recent attempts that broke above it (Oct 26/27 and Nov 02) failed to close above it and dropped emphatically back below the 4H MA50 (blue trend-line).
As a result, a candle close above the 4H MA200 would be the first bullish signal while one above the 1D MA50 (red trend-line), which is exactly on the top (Lower Highs trend-line) of the Triangle, would confirm it. In that case, we will target the top (Lower Highs trend-line) of the long-term March 2022 Channel Down (green line). Further break-out should test the 1D MA100 (yellow trend-line). Notice how the RSI on the 1D time-frame is on Higher Lows all this time, potentially accumulating a build-up for a major bullish break-out.
However, new rejection on the 4H MA200, will maintain the short-term bearish trend within the Channel Down and target the bottom (dashed line) of the Triangle pattern.
-------------------------------------------------------------------------------
** Please LIKE 👍, SUBSCRIBE ✅, SHARE 🙌 and COMMENT ✍ if you enjoy this idea! Also share your ideas and charts in the comments section below! This is best way to keep it relevant, support me, keep the content here free and allow the idea to reach as many people as possible. **
-------------------------------------------------------------------------------
You may also TELL ME 🙋♀️🙋♂️ in the comments section which symbol you want me to analyze next and on which time-frame. The one with the most posts will be published tomorrow! 👏🎁
-------------------------------------------------------------------------------
👇 👇 👇 👇 👇 👇
💸💸💸💸💸💸
👇 👇 👇 👇 👇 👇

WTI OIL Near the top of the 4 month Channel Down.The WTI Oil (USOIL) rebounded on its 4H MA200 (orange trend-line) yesterday and is once again near the top (Lower Highs trend-line) of the long-term Channel Down pattern that started at the end of June.
On the short-term, it has been trading within a Channel Up (dashed lines) since the October 18 Low. Naturally, the Higher Lows on the 4H RSI draw comparisons with the August 30 - September 20 fractal, which formed a Channel Down and eventually bottomed around the 1W MA100 (yellow trend-line).
Our trading plan involves break-outs. A 1D closing above the top (Lower Highs trend-line) of the Channel Down, targets the 1D MA100 (red trend-line) on the short-term, also inside the August Resistance Zone. On the longer term, the upper Fibonacci retracement levels can be targeted once the previous breaks.
If the price breaks below the 4H MA200, a short-term Channel Down similar to that of mid September (blue) can be materialized and target the 1W MA100 again.
-------------------------------------------------------------------------------
** Please LIKE 👍, SUBSCRIBE ✅, SHARE 🙌 and COMMENT ✍ if you enjoy this idea! Also share your ideas and charts in the comments section below! This is best way to keep it relevant, support me, keep the content here free and allow the idea to reach as many people as possible. **
-------------------------------------------------------------------------------
You may also TELL ME 🙋♀️🙋♂️ in the comments section which symbol you want me to analyze next and on which time-frame. The one with the most posts will be published tomorrow! 👏🎁
-------------------------------------------------------------------------------
👇 👇 👇 👇 👇 👇
💸💸💸💸💸💸
👇 👇 👇 👇 👇 👇

XAUUSD Inverse Head and Shoulders calls for a Buy.Gold (XAUUSD) dropped below its 4H MA50 (blue trend-line) after failing to close a candle above the 4H MA200 (orange trend-line) and remains within a Triangle pattern (dashed lines) since the September 28 Low.
The 1D RSI remains on Higher Lows since that day so it gives some edge to the upside, which can come if the current short-term pattern gets confirmed as an Inverse Head and Shoulders. Technically, this is a bullish pattern found on market bottoms and calls for a rebound. If it is validated by a break above the 4H MA50, we can pursue one short-term target on the 4H MA200, one medium-term on the 1D MA50 (red trend-line) and if that breaks then the top of the long-term (since March) Channel Down (green) around 1690.
On the other hand, the slightest break below the Triangle's Higher Lows trend-line (dashed line), calls for a long-term sell targeting the 1W MA300 (red trend-line, scroll lower on the chart, currently at 1548).
-------------------------------------------------------------------------------
** Please LIKE 👍, SUBSCRIBE ✅, SHARE 🙌 and COMMENT ✍ if you enjoy this idea! Also share your ideas and charts in the comments section below! This is best way to keep it relevant, support me, keep the content here free and allow the idea to reach as many people as possible. **
-------------------------------------------------------------------------------
You may also TELL ME 🙋♀️🙋♂️ in the comments section which symbol you want me to analyze next and on which time-frame. The one with the most posts will be published tomorrow! 👏🎁
-------------------------------------------------------------------------------
👇 👇 👇 👇 👇 👇
💸💸💸💸💸💸
👇 👇 👇 👇 👇 👇

WTI OIL Short-term breakout levels and one long-term to considerWTI Oil (USOIL) broke today above its 4H MA50 (blue trend-line) after three consecutive rejections and is going for the 1D MA50 (green trend-line) test where it was rejected on October 20. A break above it would be a short-term bullish break-out signal, targeting the top (Lower Highs trend-line) of the Channel Down pattern that the commodity has been trading in since June 29 (rough estimate 90.00).
Remember that this is the very same Channel Down that helped us take an accurate sell position 2 weeks ago as shown on the chart below:
If however the price breaks below the (dashed) Higher Lows trend-line, we will take it as a break-out sell signal, initially targeting the middle (dotted line) of the Channel Down, which is where the crucial 1W MA100 (yellow trend-line) is and then the September 25 Low (76.20) in extension (but only if the 1W candle closes below the 1W MA100).
Keep in mind that the only level we can buy comfortably on is upon a break above the 1D MA100 (red trend-line), which has been unbroken since July 05. That would target 105.00 initially.
-------------------------------------------------------------------------------
** Please LIKE 👍, SUBSCRIBE ✅, SHARE 🙌 and COMMENT ✍ if you enjoy this idea! Also share your ideas and charts in the comments section below! This is best way to keep it relevant, support me, keep the content here free and allow the idea to reach as many people as possible. **
-------------------------------------------------------------------------------
You may also TELL ME 🙋♀️🙋♂️ in the comments section which symbol you want me to analyze next and on which time-frame. The one with the most posts will be published tomorrow! 👏🎁
-------------------------------------------------------------------------------
👇 👇 👇 👇 👇 👇
💸💸💸💸💸💸
👇 👇 👇 👇 👇 👇

XAUUSD Bullish Flag repeating prior fractal. $1690 next?Gold (XAUUSD) largely confirmed our sell signal below the 4H MA50 (blue trend-line) on our last week analysis:
1620 was hit and the price bottomed on Lower Lows while the 4H RSI was on Higher Lows, with this Bullish Divergence signaling the most optimal buy entry. As you see, the same Bullish Divergence was formed on September 28, with Gold rebounding instantly back to the 4H MA50, which is exactly what took place last Friday. The price is now waving a Bull Flag below the 4H MA50 again and if the pattern continues to repeat, we can expect a new rally wave targeting the 1D MA50 (which is currently at 1695) and the dashed Lower Highs trend-line from the October 04 High. The top of the long-term Channel Up (green) gives an upside limit at 1710.
-------------------------------------------------------------------------------
** Please LIKE 👍, SUBSCRIBE ✅, SHARE 🙌 and COMMENT ✍ if you enjoy this idea! Also share your ideas and charts in the comments section below! This is best way to keep it relevant, support me, keep the content here free and allow the idea to reach as many people as possible. **
-------------------------------------------------------------------------------
You may also TELL ME 🙋♀️🙋♂️ in the comments section which symbol you want me to analyze next and on which time-frame. The one with the most posts will be published tomorrow! 👏🎁
-------------------------------------------------------------------------------
👇 👇 👇 👇 👇 👇
💸💸💸💸💸💸
👇 👇 👇 👇 👇 👇

WTI OIL broke below the 4H MA200. Bearish confirmation.This is an update to our WTI Oil (USOIL) post published last week, as our sell signal was confirmed:
The price broke below both the (dashed) Higher Lows trend-line and the 4H MA200 (orange trend-line) and following the Rejection on the August Resistance Zone and the pricing of the new Lower High on the Channel Down since June, we can now expect at least a test of the previous Low at 76.30. A break above the 4H MA50 (blue trend-line) shouldn't invalidate that.
In our opinion technically only a 1D candle closing above the August Resistance Zone will be a bullish break-out signal (aimed at the 0.786 Fib), which now will be a break above both the 1D MA100 (red trend-line) and the 0.5 Fibonacci retracement level. We can start considering booking the sell and instead open a lower buy position when the 4H RSI breaks into its multi-month Support Zone. As you see, such RSI rebounds have always hit the 4H MA50 at least.
-------------------------------------------------------------------------------
** Please LIKE 👍, SUBSCRIBE ✅, SHARE 🙌 and COMMENT ✍ if you enjoy this idea! Also share your ideas and charts in the comments section below! This is best way to keep it relevant, support me, keep the content here free and allow the idea to reach as many people as possible. **
-------------------------------------------------------------------------------
You may also TELL ME 🙋♀️🙋♂️ in the comments section which symbol you want me to analyze next and on which time-frame. The one with the most posts will be published tomorrow! 👏🎁
-------------------------------------------------------------------------------
👇 👇 👇 👇 👇 👇
💸💸💸💸💸💸
👇 👇 👇 👇 👇 👇

XAUUSD Bullish Divergence on RSI. Be ready to trade break-outs.Gold (XAUUSD) has been trading within a Channel Down since October 10 when it broke below its 4H MA50 (blue trend-line) and today it got rejected on its top (Lower Highs trend-line) and the 4H MA100 (green trend-line).
Even though this is a technical sell entry, we should be mindful of the 4H RSI which has been on a Channel Up since also Oct 10, meaning that there is a Bullish Divergence. Potentially this may signify a loss in strength for the downtrend and may see a bullish break-out soon.
The strategy is simple: continue selling below the 4H MA50 but buy if the price closes above it. Targets 1,620 and the 1D MA50 (red trend-line) respectively.
-------------------------------------------------------------------------------
** Please LIKE 👍, SUBSCRIBE ✅, SHARE 🙌 and COMMENT ✍ if you enjoy this idea! Also share your ideas and charts in the comments section below! This is best way to keep it relevant, support me, keep the content here free and allow the idea to reach as many people as possible. **
-------------------------------------------------------------------------------
You may also TELL ME 🙋♀️🙋♂️ in the comments section which symbol you want me to analyze next and on which time-frame. The one with the most posts will be published tomorrow! 👏🎁
-------------------------------------------------------------------------------
👇 👇 👇 👇 👇 👇
💸💸💸💸💸💸
👇 👇 👇 👇 👇 👇

WTI OIL Sell Signal and invalidation levelFollowing our break-out buy signal last week, the WTI Oil (USOIL) has entered a Resistance Zone, which since the start of August has rejected the price every time with the temporary exception of 1 day (29-30 Aug):
Eventually the Channel Down turned out to be wider. The price is now pulling back since hitting the August Resistance Zone and the 4H RSI has been emphatically rejected much lower than we'd normally expect. This shows how overbought the price was during that 2 week bullish stretch. Despite the imminent formation of a Bullish Cross (MA50 crossing above the MA200), it is best to wait for a confirmed break-out before entering again.
In our opinion a sell break-out will be when the (dashed) Higher Lows trend-line breaks, which will be a breach of the 4H MA50 (blue trend-line) as well, targeting the September Low.
A buy break-out won't be above the Resistance Zone or the top of the Channel Down but above the 1D MA100 (red trend-line), which has been untouched since July 05 2022, in which case we can target the 0.786 Fibonacci retracement level.
-------------------------------------------------------------------------------
** Please LIKE 👍, SUBSCRIBE ✅, SHARE 🙌 and COMMENT ✍ if you enjoy this idea! Also share your ideas and charts in the comments section below! This is best way to keep it relevant, support me, keep the content here free and allow the idea to reach as many people as possible. **
-------------------------------------------------------------------------------
You may also TELL ME 🙋♀️🙋♂️ in the comments section which symbol you want me to analyze next and on which time-frame. The one with the most posts will be published tomorrow! 👏🎁
-------------------------------------------------------------------------------
👇 👇 👇 👇 👇 👇
💸💸💸💸💸💸
👇 👇 👇 👇 👇 👇

XAUUSD Fierce battle on the 1W chart.Gold (XAUUSD) closed last week above the 1W MA200 (orange trend-line) but so far it started this week with a heavy drop back below it. This analysis shows a potential long-term Channel Down pattern on the 1W time-frame, which can extend the rebound that started two weeks ago after the price nearly touched the bottom (Lower Lows trend-line) of the formation.
Basically so far in terms of both MACD and RSI, it resembles the bearish leg that formed the first Low of the Channel on the week of March 15 2021. Notice also that two weekly candles ago, the price also hit the 0.5 Fibonacci retracement level (High Aug 03 2020, Low Aug 13 2018). The previous Low rebound broke within the 0.5 - 0.618 Fib Zone from the prior High, also above the 1W MA50 (blue trend-line), which is now within 1807 - 1852.
As the long-term trend and the US10Y, DXY correlations weigh more towards a bearish Gold sentiment, it may be best to engage after a confirmation. And right now the best you can get would be when the 1W MACD makes a Bullish Cross (green arrow). Failure to do so, will break below the Channel and invalidate the pattern, in which case we can target the 1W MA300 (red trend-line).
-------------------------------------------------------------------------------
** Please LIKE 👍, SUBSCRIBE ✅, SHARE 🙌 and COMMENT ✍ if you enjoy this idea! Also share your ideas and charts in the comments section below! This is best way to keep it relevant, support me, keep the content here free and allow the idea to reach as many people as possible. **
-------------------------------------------------------------------------------
You may also TELL ME 🙋♀️🙋♂️ in the comments section which symbol you want me to analyze next and on which time-frame. The one with the most posts will be published tomorrow! 👏🎁
-------------------------------------------------------------------------------
👇 👇 👇 👇 👇 👇
💸💸💸💸💸💸
👇 👇 👇 👇 👇 👇

SILVER Can't rise more unless this level breaksSilver (XAGUSD) has been pulling back in the last 3 days following an impressive +18% rise since the September 28 Low. As you see, we've charted Silver's pattern since February 01 2021, which is a Channel Down, most effectively viewed using the Fibonacci channel levels. This is basically the pattern we used to analyze the metal almost a month ago, and it helped us call accurately that bullish break-out:
After breaking above the 1D MA50 (blue trend-line), the price didn't reach as high as the 1D MA200 (orange trend-line) but it did hit the 0.786 Fibonacci retracement level, which is the level that the October 2021 rise topped (on November 12 2021) and got rejected back to the 0.236 Fibonacci a month later. The similarities between the two fractals are obvious even between their 1D RSI sequences where are you see, based on the symmetry, Silver might have made a peak similar to that of November 12 2021.
If the price continues to replicate the 2021 pattern, then we can target the 0.236 Fib again. The ideal confirmation will be given once the 1D MA50 breaks again. So trade this in accordance to your tolerance levels. The lowest risk buy would be exactly on the 0.236 Fib.
On the bull side, the above strategy is invalidated if the price breaks and closes above the 1D MA200 first. In that case, we can start buying again and target the 1.382 Fibonacci extension which was reached in March 2022 at the height of the Ukraine - Russia war.
-------------------------------------------------------------------------------
** Please LIKE 👍, SUBSCRIBE ✅, SHARE 🙌 and COMMENT ✍ if you enjoy this idea! Also share your ideas and charts in the comments section below! This is best way to keep it relevant, support me, keep the content here free and allow the idea to reach as many people as possible. **
-------------------------------------------------------------------------------
You may also TELL ME 🙋♀️🙋♂️ in the comments section which symbol you want me to analyze next and on which time-frame. The one with the most posts will be published tomorrow! 👏🎁
-------------------------------------------------------------------------------
👇 👇 👇 👇 👇 👇
💸💸💸💸💸💸
👇 👇 👇 👇 👇 👇

XAUUSD First time to hit the 1D MA50 in 1.5 month. What next?Last week (September 28) we posted our usual 1D Gold (XAUUSD) analysis, calling for a buy after the metal completed a -10.60% drop from its previous Channel Down High:
As you see the price action validated that projection and Gold finally hit yesterday the 1D MA50 (blue trend-line), which was our immediate target. That was the first time this MA level got hit since August 17. Notice how this rise broke above Channel Down (1) (blue one) and has effectively confirmed the emergence of Channel Down (2) (green one), that we talked about on last week's analysis. So how will Gold trade now?
From a 1D MACD standpoint, the sell confirmation comes when it forms a Bearish Cross. That has been a consistent Sell Signal throughout the whole year. Even though we are near the top of Channel Down (2), it is best to sell either on the 1D MACD signal or if we break below the 4H MA50 (red trend-line), which is again consistent with how the previous downtrends began. We are only willing to buy if the price breaks above the 1D MA100 (green trend-line), which is intact since May 06 and target the 1D MA200 (orange trend-line).
-------------------------------------------------------------------------------
** Please LIKE 👍, SUBSCRIBE ✅, SHARE 🙌 and COMMENT ✍ if you enjoy this idea! Also share your ideas and charts in the comments section below! This is best way to keep it relevant, support me, keep the content here free and allow the idea to reach as many people as possible. **
-------------------------------------------------------------------------------
You may also TELL ME 🙋♀️🙋♂️ in the comments section which symbol you want me to analyze next and on which time-frame. The one with the most posts will be published tomorrow! 👏🎁
-------------------------------------------------------------------------------
👇 👇 👇 👇 👇 👇
💸💸💸💸💸💸
👇 👇 👇 👇 👇 👇

WTI OIL Bullish break-out on the short-termThe WTI OIL (CL1! used on this analysis), broke today above the Internal Lower Highs trend-line that started on the last Lower High (August 30) of the long-term Channel Down pattern. By doing so, the price turned the 4H MA50 (blue trend-line) into a Support and technically targets the 4H MA200 (orange trend-line) as it did on September 14.
At the same time, it invalidated a Bearish Cross on the 4H MACD. A similar pattern has been on August 22, when the price again broke aggressively above the 4H MA50 after having plunged below it. That leg also hit the 4H MA200. However, the rise may be less than expected if it replicates the August 10 break-out, which was contained on the 0.5 Fibonacci level, which is where we are at now. You may consider closing then if we close below the 4H MA50.
-------------------------------------------------------------------------------
** Please LIKE 👍, SUBSCRIBE ✅, SHARE 🙌 and COMMENT ✍ if you enjoy this idea! Also share your ideas and charts in the comments section below! This is best way to keep it relevant, support me, keep the content here free and allow the idea to reach as many people as possible. **
-------------------------------------------------------------------------------
You may also TELL ME 🙋♀️🙋♂️ in the comments section which symbol you want me to analyze next and on which time-frame. The one with the most posts will be published tomorrow! 👏🎁
-------------------------------------------------------------------------------
👇 👇 👇 👇 👇 👇
💸💸💸💸💸💸
👇 👇 👇 👇 👇 👇

XAUUSD Potential Bearish Cross. Short-term trades.Gold (XAUUSD) has turned sideways after breaking above the 4H MA50 (blue trend-line), always within the Bearish Megaphone pattern that started after the August 10 High. We have a potential Sell Signal emerging as the 4H MACD is close to forming a Bearish Cross. As this chart shows, every such Bearish Cross has been a Sell Opportunity since August at least.
If you are a short-term traders, it would be best perhaps to engage upon confirmation and that would be if the price breaks below the 4H MA50. In that case, we can target the 1,641.10 Low of September 29 and the 1614.50 Support in extension.
If however the price breaks above the 1688.50 Resistance (previous High), it would be an upwards breach of the Bearish Megaphone and most likely the 4H MA200 (orange trend-line) at the time, in which case we will set the 1D MA50 (red trend-line) as Target.
-------------------------------------------------------------------------------
** Please LIKE 👍, SUBSCRIBE ✅, SHARE 🙌 and COMMENT ✍ if you enjoy this idea! Also share your ideas and charts in the comments section below! This is best way to keep it relevant, support me, keep the content here free and allow the idea to reach as many people as possible. **
-------------------------------------------------------------------------------
You may also TELL ME 🙋♀️🙋♂️ in the comments section which symbol you want me to analyze next and on which time-frame. The one with the most posts will be published tomorrow! 👏🎁
-------------------------------------------------------------------------------
👇 👇 👇 👇 👇 👇
💸💸💸💸💸💸
👇 👇 👇 👇 👇 👇

WTI OIL Buy Signal on RSI Support bounce-------------------------------------------------------------------------------
** Please LIKE 👍, SUBSCRIBE ✅, SHARE 🙌 and COMMENT ✍ if you enjoy this idea! Also share your ideas and charts in the comments section below! This is best way to keep it relevant, support me, keep the content here free and allow the idea to reach as many people as possible. **
-------------------------------------------------------------------------------
The WTI Oil (USOIL) has been trading within a Channel Down pattern since early July. A key characteristic of that formation is that every time the 1D RSI entered its 35.50 - 30.00 Support Zone, the price rallied short-term on an increase ranging from +8.40% to +13.70%. Two days ago the RSI hit the exact 30.00 level and rebounded. A minimum +8.40% increase would made a new (Lower) High at 82.90 while the maximum of +13.70% would print 86.70 and most likely test the 1D MA50 (blue trend-line) as the August 30 Lower High did.
-------------------------------------------------------------------------------
You may also TELL ME 🙋♀️🙋♂️ in the comments section which symbol you want me to analyze next and on which time-frame. The one with the most posts will be published tomorrow! 👏🎁
-------------------------------------------------------------------------------
👇 👇 👇 👇 👇 👇
👇 👇 👇 👇 👇 👇
👇 👇 👇 👇 👇 👇

XAUUSD Strong buy signal ahead-------------------------------------------------------------------------------
** Please LIKE 👍, SUBSCRIBE ✅, SHARE 🙌 and COMMENT ✍ if you enjoy this idea! Also share your ideas and charts in the comments section below! This is best way to keep it relevant, support me, keep the content here free and allow the idea to reach as many people as possible. **
-------------------------------------------------------------------------------
Gold (XAUUSD) has been trading within a long-term Channel Down (1) since the March 08 2022 High caused by the Ukraine - Russia war. A distinct characteristic of this pattern is that its Lower Lows completed a -10.50% decline from the previous Lower High.
Today's low completed another -10.50% decline from the August 10 High and if the pattern continues to replicate this characteristic, then we should see a 3-4 week rise. The previous two rises towards the top (Lower Highs trend-line) of the Channel Down (1) have both hit the 1D MA50 (blue trend-line) and reached at least the 0.382 Fibonacci retracement level, with the most recent even reaching the 0.618 Fib. On the current sequence, the 0.382 Fib is at 1690, while the 0.618 is at 1734.
If the latter is hit, then that would break the Channel Down (1). We can see however a new Channel Down (2) pattern (green lines) that can match this projection. Notice also the consistent signals that the 1D MACD has been providing since March 14. Every MACD Bearish Cross has been an accurate Sell Signal, while a Bullish Cross has been a Buy Signal. We might have a Bullish Cross within the next 2 days. That would confirm the 3-4 week rise.
Note for long-term traders: A closing above the 1D MA200 (orange trend-line), can change the trend from bearish to bullish long-term.
-------------------------------------------------------------------------------
You may also TELL ME 🙋♀️🙋♂️ in the comments section which symbol you want me to analyze next and on which time-frame. The one with the most posts will be published tomorrow! 👏🎁
-------------------------------------------------------------------------------
👇 👇 👇 👇 👇 👇
👇 👇 👇 👇 👇 👇
👇 👇 👇 👇 👇 👇

XAUUSD Channel Down bottomed. Potential short-term buy.Gold (XAUUSD) following the rejection on the 4H MA50 (blue trend-line), which is the short-term Resistance, hit and even marginally broke today, the bottom (Lower Lows trend-line) of the Channel Down since the August 10 High, which technically defines the medium-term bearish trend.
The recent Lower Lows though have been formed while the RSI on the 1D time-frame has been holding its Support Zone. The last time we saw that pattern was during the July 06 - July 21 Lower Lows. The RSI then bounced on its Support Zone and Gold rallied to its 0.618 Fibonacci level that was eventually the August 10 High.
As a result, we are willing to buy today's bottom rebound on what seems to be the early stages of a short-term rally. We are setting short-term targets and only if broken we're willing to move to the next one as the long-term trend remains bearish. As such the first would be the 4H MA50 (blue trend-line), following by the top (Lower Highs trend-line) of the Channel Down. If we close a day above it, then we can move to the 4H MA200 (orange trend-line) and the 0.618 Fib (1738.50) in extension.
** Please LIKE 👍, SUBSCRIBE ✅, SHARE 🙌 and COMMENT ✍ if you enjoyed this idea! Also share your ideas and charts in the comments section below! This is best way to keep it relevant and support me and allow the idea to reach as many people as possible. **
------------------------------------------------------------------------------------------
You may also TELL ME 🙋♀️🙋♂️ in the comments section which symbol you want me to analyze next and on which time-frame. The one with the most posts will be published tomorrow! 👏🎁
------------------------------------------------------------------------------------------
👇 👇 👇 👇 👇 👇
👇 👇 👇 👇 👇 👇
👇 👇 👇 👇 👇 👇

XAUUSD Following the Rate High. Will it really rebound??Gold (XAUUSD) despite the enormous volatility after the Fed Rate Decision yesterday (0.75% Rate Hike), held the 1653 Support. At the same time though it held and got rejected on the 4H MA50 (blue trend-line), which is the short-term Resistance.
Technically, the medium-term trend (as well as the long one) has been bearish within a Channel Down since the August 10 High. As long as its top is not breached, the short-term target is the bottom (Lower Lows trend-line), limited on the -0.236 Fibonacci extension (1616).
The recent Lower Lows though have been formed while the RSI on the 1D time-frame has been holding its Support Zone. The last time we saw that pattern was during the July 06 - July 21 Lower Lows. The RSI then bounced on its Support Zone and Gold rallied to its 0.618 Fibonacci level that was eventually the August 10 High.
As a result, we are willing to buy the break above the current Channel Down and target first the 4H MA200 (orange trend-line) and the 0.618 Fib (1749) in extension.
--------------------------------------------------------------------------------------------------------
** Please support this idea with your likes and comments, it is the best way to keep it relevant and support me. **
--------------------------------------------------------------------------------------------------------

XAUUSD Trading plan after the key 1680 break!Gold (XAUUSD) broke the 1680 long-term Support level last Thursday, a level that has been holding since March 08 2021. As we mentioned last week, the continued rising bond yields are a main reason of this market breaking this psychological Support. On today's analysis, we will focus on the 1D time-frame and how to trade the medium-term under the new dynamics.
First, the 1680 break came after a rejection on the 1D MA50 (blue trend-line), which technically adds up to the downtrend. This shows that the major market participants never intended to allow Gold to break upwards. In addition, we see the price today being rejected on the 1680 level, on its first test as a Resistance. On the short-term, this adds more weight to the selling side as it discourages dip buyers.
If the conditions don't change, we expect a new bearish leg that can reach as low as the 1.5 Fibonacci extension on the medium-term, which is at 1618.50. We are modeling this out of the bearish sequence of mid-January 2021 - early March 2021, which as you see had a similar set of parameters: fake out above the 1D MA50 (circle), followed by an instant sell-off and a dead-cat-bounce that was rejected on the 1D MA50, which only gave way to the final 1.5 Fib flush. Notice how the MACD on the 1W time-frame between the current sequence and that of 2020/21 are similar.
On the other hand, a new break above the 1D MA50, will most likely not be a fake-out this time and since it will break above the Lower Highs trend-line of the March 08 2022 'Ukraine-Russia' High, it should be enough to reverse the medium-term towards the 1808.50 Resistance.
--------------------------------------------------------------------------------------------------------
** Please support this idea with your likes and comments, it is the best way to keep it relevant and support me. **
--------------------------------------------------------------------------------------------------------

XAUUSD Crashing! Huge long-term bearish breakout! Caution buyersGold (XAUUSD) is crashing today as it broke below the 1680 Support, which is a level that got test 3 times since March 2021 and held. This is a major bearish break-out for the yellow metal and comes to confirm the analysis we posted 2.5 months ago on July 01, that went under the radar:
That was when we warned that Gold could be on the brink of collapse as on the 1M (monthly) time-frame, it has broken below its 1W MA100 (red trend-line) in a pattern similar to February 2013. Well the 1W MA100 was never recovered and today this is a confirmed bearish break-out, giving us the opportunity to update on that analysis.
This time, we have added the U.S. 10 year bond yield (US10Y displayed by the green trend-line), which in our opinion is the fundamental reason behind Gold's sharp selling. As this correlation shows, every time the US10Y was rising aggressively, Gold followed a negative correlation and was dropping aggressively. We have depicted those mini moves (on the 1M scale, otherwise they represent multi month moves).
The current move though is a major one, even for the 1M scale as it is getting extremely close to the 1M MA50 (blue trend-line), which has basically been the pivot within this 11 year Channel. In April 2013, the break below it saw the price extending the selling sequence below the 1M MA50 for the next 3 years that only broke above it again in June 2016. This is a potential scenario if Gold closes below the 1M MA50 and gets rejected on it upon re-test.
This time however we have the 1M MA200 (orange trend-line) coming in strongly (currently at 1292 but rising rapidly), which has been untouched since August 2003 and can make contact with the price around the 0.786 Fibonacci retracement level, assuming the trend continues. This is also in-line with the 1M RSI, which as you see is within a Channel Up since the 2011 High. As a result, we may see this time a rebound just before we hit the 1M MA200.
Back to the US10Y, like we said, the more it keeps rise, the lower it will push Gold. The reason is that the bonds are also a steady and safe asset, thus a direct competitor of Gold, which at the same time offers yields. It is reasonable to see risk-averse investors flee Gold and move capital to bonds as long as the yields rise.
So what can be next now? We saw in December 2013, that even though the US10Y reversed downwards, Gold didn't stage a rebound but instead entered this 3 year structured sell sequence below the 1M MA50. It appears that the US10Y is preparing for that move in the coming months.
--------------------------------------------------------------------------------------------------------
** Please support this idea with your likes and comments, it is the best way to keep it relevant and support me. **
--------------------------------------------------------------------------------------------------------

XAGUSD Hit the 1D MA50. Major break-out possible!Silver (XAGUSD) hit today its 1D MA50 (blue trend-line) for the first time in 4 weeks (since Aug 17). It did so after rebounding on an Internal Lower Lows trend-line similar to that of August 09 - September 29 2021. This is basically the formation that emerged within the 1.5 year long-term Channel Down pattern that has been dominating the bearish trend since the February 01 2021 market high.
The Aug-Sep 2021 fractal rebounded after hitting the Internal Lower Lows and following the 1D MA50 break-out, it hit the 1D MA200 (orange trend-line) on the 0.786 Channel Fib retracement. Notice that both fractals made the 1D MA50 test on the 0.382 Fib. The 1D RSI patterns among the two are also similar. As a result, if the price closes above the 1D MA50, we will target the 1D MA200 or the 0.786 Fib (whichever comes first, most likely th 0.786 Fib will).
We are only willing to short if the price closes below the Channel Down and target the Bearish Extreme of -0.382, just like the Bullish Extreme of the March 2022 Russia - Ukraine war, targeted the 1.382 Fibonacci extension.
--------------------------------------------------------------------------------------------------------
** Please support this idea with your likes and comments, it is the best way to keep it relevant and support me. **
--------------------------------------------------------------------------------------------------------

XAUUSD Double bullish break-out. One last level to go.Gold (XAUUSD) offered us a great double trade following our previous analysis, as first it was rejected on the 4H MA50 (blue trend-line) back near the multi-year Support and the rebounded back to the Lower Highs trend-line of the August High:
Now the price broke above both the 4H MA50 and the Lower Highs trend-line and as expected, is consolidating around the Pivot Zone. The last time it did so for that long was from July 22 to July 27. With the 4H MA50 holding as Support, the price then had a 2-week aggressive rally to the 1808 High, which is now our Resistance.
We expect a similar consolidation before another strong rally. The 1D MA50 (red trend-line) is now the Resistance to beat which will break that consolidation. Notice also how the RSI on the 1D time-frame has been rising since the September 01 low on the Oversold Zone.
--------------------------------------------------------------------------------------------------------
** Please support this idea with your likes and comments, it is the best way to keep it relevant and support me. **
--------------------------------------------------------------------------------------------------------
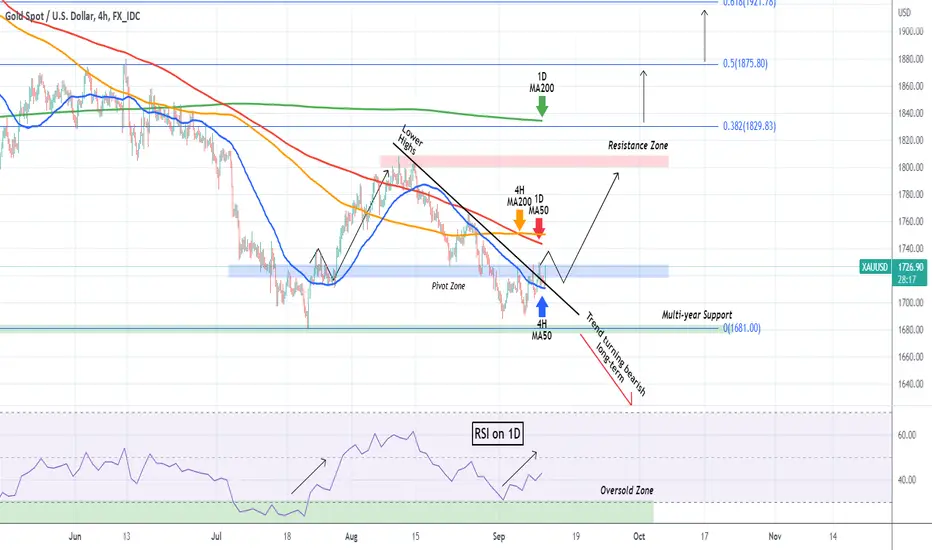
XAUUSD Rejected on the 4H MA50. Trading plan ahead.Gold (XAUUSD) closed its 3rd straight red week on Friday which erased all of the gains of the mid July - August gains. On our August 16 Gold post, we expected some relief but of course this selling is heavier than expected:
Still, as long as the multi-year Support of 1680 holds, a new rebound to at least the 1800 Resistance Zone is possible. However, the price needs to break above the 4H MA50 (blue trend-line), which rejected the short-term rebound yesterday and preferably the Lower Highs trend-line since the August 10 High. Added pressure is given by the Pivot Zone, which is now acting as Resistance (previously a Support).
A bullish factor is the fact that the 1D RSI hit its Oversold Zone. A break above the 4H MA50 can target the 4H MA200/ 1D MA50 (orange and red trend-line respectively) cluster and after a potential re-test of the 4H MA50/ Lower Highs trend-line as a Support this time, then target the 1800 Resistance on the medium-term.
On the other hand, a break and weekly closing below the 1680 Support, can turn the trend Bearish long-term.
--------------------------------------------------------------------------------------------------------
** Please support this idea with your likes and comments, it is the best way to keep it relevant and support me. **
--------------------------------------------------------------------------------------------------------
