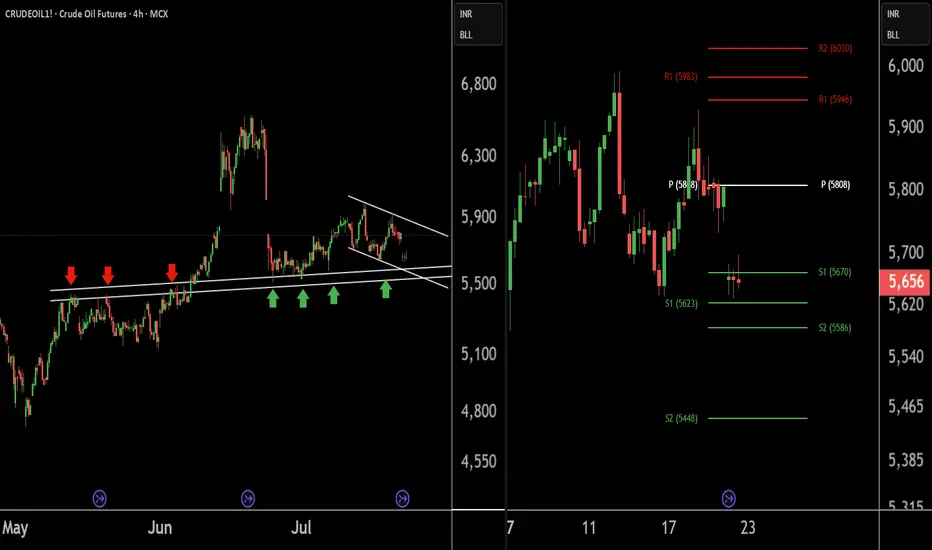
Crude Oil Buying Alert: Strategic Entry Point IdentifiedThere are two charts of Crude Oil on the 4-hour timeframe.
In the first chart, Crude Oil is sustaining near its lower point (LOP), with a support range of 5540-5580.
A-VWAP is also providing support to Crude Oil around the 5580 level.
The Pivot Point is also supporting Crude Oil around the 5580-5620 level.
If this level is sustain then we may see higher prices in Crude Oil.
Thank you !!
Commoditytrading
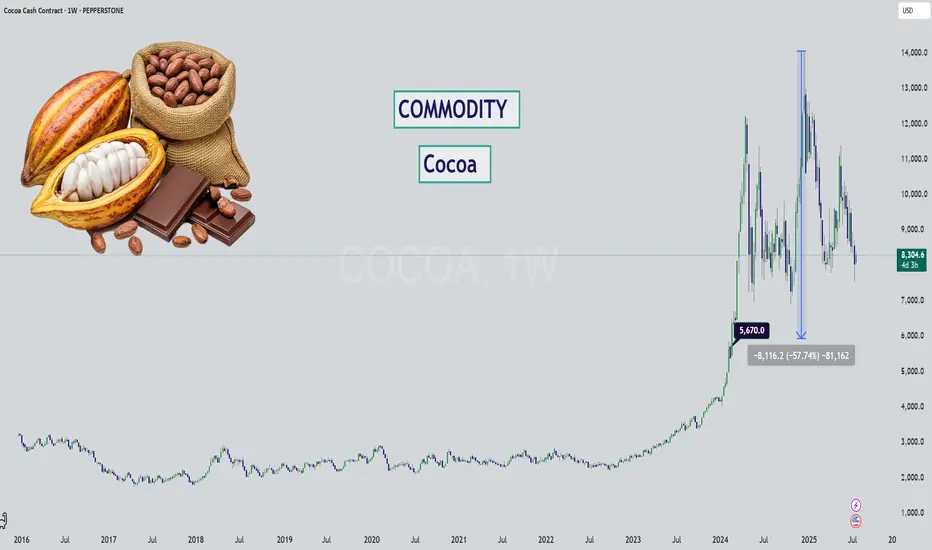
Cocoa - Chocolate is DIPPING (literally)Hello Market Watchers 👀
I bring today an update on your favorite commodity (mine actually)... 🍫
The weekly timeframe from a multi-year perspective is what's on the cover and one thing is clear - cocoa has never increased so much as it during May23' to Dec24'.
Sure inflation brought on by covid has a role to play. But even so, factoring in the amount of +509%? That is way out.
We could likely see this kind of stair step down movement on cocoa, since it has been following the logic of: " previous support = new resistance ".
Either way what this tells me is that cocoa has been running overly hot for too long... and it's time for a cooldown. Prices will likely never return to pre-covid levels, unless there is unfortunate weather or other supply chain issues.
Ultimately, a return back to the $5,600 zone would be a reasonable market correction for such a large increase.
XAGUSD Weekly Analysis (MMC) : Bullish Channel Toward Target🧠 1. Trend Shift Confirmed – Silver in Full Bullish Momentum
Silver has officially broken free from its multi-year sideways range and has entered a well-defined ascending channel, pushing toward higher highs week after week. The momentum is strong and supported by a combination of technical elements, structure shifts, and clean retests.
The trend is now clear: bullish, with the price aiming for the Next Reversal Zone between $46 and $48 — a level not seen since mid-2020.
🔷 2. Blue Ray Break – Start of the Rally
The breakout began with a clean move above the Blue Ray trendline, a key structure that had suppressed Silver’s growth for several years.
As the chart notes:
“Blue Ray Always Continue Trend” — until broken.
Once Silver broke above this resistance, it not only confirmed the trend reversal but also triggered the formation of a new bullish market structure, supported by aggressive buying.
🔁 3. SR – Interchange Zone Holding Strong
The SR Interchange zone (around $27 – $30) has played a critical role in this breakout. It acted as:
Resistance during the multi-year range.
Then Support after the breakout, confirming a classic Support-Resistance Flip (SRF).
This zone now serves as a solid demand base, giving the rally a stable foundation to push higher.
🪙 4. QFL Formation – Momentum Confirmation
The breakout also aligns with a QFL (Quick Flip Level) structure — a powerful bullish continuation pattern.
QFL setups form when price breaks above a former base, pulls back slightly, and then quickly resumes the upward trend.
This indicates that buyers are aggressive and unwilling to let price fall too far, fueling a rally.
Combined with the ascending channel, the QFL structure gives extra confidence that Silver is on track to reach the $46–$48 Reversal Zone.
📏 5. Trendline & Channel – Price Structure in Control
Silver is currently moving cleanly within an ascending parallel channel, respecting both upper resistance and lower support trendlines. The inner trendline has been tested multiple times, and price is now riding its upper half.
This shows:
Buyers are in control.
Each correction is shallow.
Market confidence is growing week after week.
Expect volatility to increase as Silver approaches the next target area.
🎯 6. Next Reversal Zone: $46 – $48
The green box at the top marks the Next Reversal Zone, where Silver might:
Stall temporarily and consolidate.
Or face a pullback back toward the mid-channel line or lower support.
This zone corresponds to:
Historical supply area (2020 highs)
Strong psychological resistance
Potential profit-taking by institutions or swing traders
🔭 Trade Scenarios to Watch
✅ Bullish Continuation:
If Silver maintains support above $36 and remains inside the ascending channel, we may see a smooth ride into the reversal zone. Look for:
Break-and-retest of the midline
Bullish candles with long wicks on dips
⚠️ Short-Term Rejection:
If price reaches $46–$48 and shows signs of exhaustion (like long upper wicks, evening star, or bearish engulfing), expect a healthy pullback toward $35–$36 or even $32.
As long as the ascending structure holds, bulls remain in control.
🧩 Key Technical Levels
Element Zone / Level Action
SR Interchange Support $27 – $30 Strong demand zone
Blue Ray Breakout Confirmed Trend reversal signal
QFL Zone Around $36 Retest and rally confirmation
Reversal Zone $46 – $48 High-probability reaction area
Trendline Support Dynamic ($35–$36) Bullish channel continuation
📌 Final Thoughts:
Silver is now playing in the big leagues again. With the Blue Ray broken, QFL confirmed, and price following a disciplined trendline channel, this rally looks both technically sound and fundamentally strong.
Watch the $46–$48 zone carefully. Whether price rejects or breaks through, there will be high-probability setups for both breakout traders and dip buyers.
Stay disciplined, don’t chase, and let price give you confirmation.

GOLD1! Best Key Level !!This is the 1 hour Chart of Gold!.
Gold is forming a bearish structure and is consistently respecting the resistance zone, leading to a downward move. The key resistance area is between 97,800 and 97,400..
Gold is finding support in the 96,250 – 96,330 zone on the short time frame.
A breakdown below this level may trigger aggressive selling pressure.
Thank you !!

CRUDEOIL1! at Best Support Zone !!This is the Daily Chart of CRUDEOIL1!.
CRUDEOIL1! having a good law of polarity at 5500-5600 level .
CRUDEOIL1! is currently trading between its quarterly pivot 5603 level and monthly pivot 5805 levels , indicating a range-bound movement."
Once the Crudeoil1! sustains above the monthly pivot, it may trigger a potential upside rally."
If this lop is sustain , then we may see higher prices in CRUDEOIL1!
Thank You !!

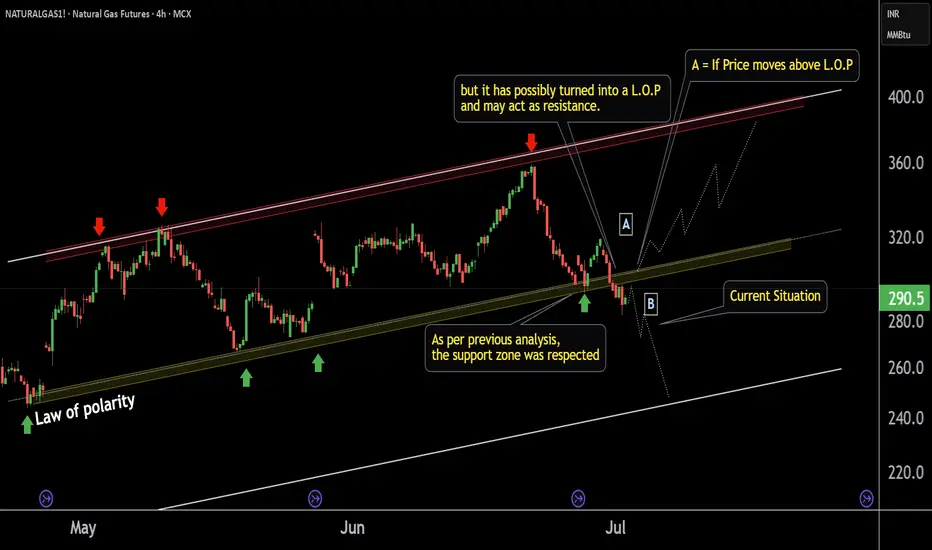
NATURALGAS1! 's key Level |This is the 4 hour chart of NATURALGAS1!
NATURALGAS1! has once again started sustaining above
its LOP (Law of Polarity) zone near at 290-295
If This level is sustain then ,we may see higher prices again in NATURALGAS1!.
Thank You !!

NATURALGAS1! Short time Breadkdown Alert !!This is the 4 hour chart of Natural Gas Futures.
NATURALGAS1 has given a short-term channel breakdown; the previous support may now possibly act as resistance at 300 level.
The breakdown target is the lower boundary of the broader channel, which may now act as support near at 240 level.
If lop is sustain then we may see lower prices in NATURALGAS1.
Thank You !!
NATURALGAS at Best Support Zone This is the 4 hour chart of Natural Gas.
Natural Gas having a good Support Zone at 290-295 range.
Natural Gas has shown a reversal from its support zone.
Natural Gas is trading within a parallel channel support at 293 level Natural Gas.
Thank You !!

BRENT CRUDE OIL Long Positionafter making a high of 76.45 brent has posted a potential HL t 71.3 and now forming a bullish flag if it breaks the pole then it can futher go high, we will make entry at 76.5 at pole breakout by making SL at 71.3 nd TP at 81.7

GOLD Long PositionGold is currently posting a HL, we will take a long position at previous HH breakout at 3447 with SL of 3403 TPs are mentioned 3491 and 3535

Gold Heist Blueprint: "XAU/USD" Short Setup!?Greetings, wealth snatchers and market bandits! 🤑💸
Welcome to the Thief Trading Style, where we combine slick technicals and crafty fundamentals to pull off the ultimate XAU/USD heist. This is our plan to raid the "Gold" market with a short entry, targeting the high-stakes GREEN MA Zone. Expect a risky, oversold setup with consolidation and a potential trend reversal—a trap where bullish robbers get outplayed. 💪🎯 Stick to the chart, execute with precision, and treat yourself to the spoils! 🍾
Why This Trade? 💰
XAU/USD is showing a neutral trend with a bearish tilt as of 18 May 2025, driven by:
📊Technicals: Price is testing a key support zone (~3120) after a breakout from a consolidation pattern on the 30-minute chart. Oversold RSI signals a potential reversal, with the Pink MA (50-period) acting as dynamic resistance.
📰Fundamentals: Recent COT reports indicate reduced speculative long positions, hinting at weakening bullish momentum. Quantitative analysis suggests gold’s correlation with USD strength is tightening, supporting a bearish outlook.
😇Sentiment: Intermarket analysis shows rising Treasury yields pressuring gold, while market sentiment leans cautious ahead of upcoming economic data releases.
💡Data Point: Gold’s average daily range (ADR) over the past 5 days is ~35 points, aligning with our target and stop-loss levels for a day/scalp trade.
Entry 📈: Set your trap at 3120 post-breakout.
Option 1: Place sell stop orders below the support breakout level (~3115) for confirmation.
Option 2: For pullback entries, set sell limit orders near the swing low/high on a 15/30-minute timeframe.
Pro Tip: Set an alert to catch the breakout in real-time. Don’t miss the heist! 🚨
Stop Loss 🛑: Protect your loot!
Place your stop loss above the nearest swing high (~3270) on the 30-minute chart for day/scalp trades.
Adjust based on your risk tolerance, lot size, and number of orders.
Note: If using sell stop orders, wait for breakout confirmation before setting your stop. Risk is yours—play it sharp! 🔥
Target 🎯: 3000 (120-point move, aligning with ADR and support zones).
Trading Alert 🚨:
News Risk: Upcoming economic releases (e.g., CPI, FOMC minutes) could spike volatility. Avoid new trades during high-impact news and use trailing stops to lock in profits.
Position Management: Scale out at key levels (e.g., 50% at 3060) to secure gains.
Join the Heist! 💥
Hit the Boost Button to power up our robbery squad. With the Thief Trading Style, we make markets bleed profits daily. 🏆 Stay sharp, follow the plan, and let’s stack those wins! Another heist is coming soon—keep your eyes peeled. 🐱👤💰
Check fundamentals, COT reports, and intermarket trends for deeper insights.
check linkkss..🔗
Happy thieving! 🤝🚀

Ready to Rob the Copper Market? XCU/USD Heist Plan Revealed!🌍 Hello Global Traders! 🌟
Money Makers, Risk Takers, and Market Shakers! 🤑💸✈️
Dive into our XCU/USD "Copper" Metals Market heist, crafted with the signature 🔥Thief Trading Style🔥, blending sharp technicals and deep fundamentals. Follow the strategy outlined in the TradingView chart, focusing on a long entry targeting the high-risk Yellow ATR Zone. Expect a wild ride with overbought conditions, consolidation, and potential trend reversals where bearish players lurk. 🏆💰 Celebrate your wins, traders—you’ve earned it! 💪🎉
📈 Entry: Storm the Vault!
The market’s ripe for a bullish grab! 💥 For Pullback trade place buy limit orders within the most recent 15 or 30-minute swing low/high levels. Set alerts on your chart to stay locked in. 🔔
🛑 Stop Loss: Guard Your Loot!
Set your Thief SL at the nearest swing low on the 3H timeframe for day/swing trades. Adjust based on your risk tolerance, lot size, and number of orders. Safety first! 🔒
🎯 Targets: Claim Your Prize!
🏴☠️ Short-Term Target: 5.10000
👀 Scalpers, Listen Up!
Stick to long-side scalps. Got deep pockets? Jump in now! Otherwise, join swing traders for the heist. Use trailing stop-loss to lock in gains and protect your stash. 💰
🐂 Why XCU/USD "Copper" is Hot!
The Fiber’s bullish surge is fueled by key fundamentals. Dive into Macro, COT Reports, Quantitative Analysis, Sentiment, Intermarket trends, and future targets via the linkss below for the full scoop. 👉🔗. Stay informed to stay ahead! 📰
⚠️ Trading Alert: News & Position Management
News releases can shake the market like a heist gone wrong! 🗞️ To protect your profits:
🚫 Avoid new trades during news events.
🛡️ Use trailing stops to secure running positions.
💥 Boost the Heist!
Hit the Boost Button to supercharge our Thief Trading Strategy! 💪 Every click strengthens our crew, making it easier to swipe profits daily. Join the squad, trade smart, and let’s make money rain! 🌧️💵

$UNG starting to accumulate a position. Swing TradeBuilding a position in unleveraged natural gas AMEX:UNG in $13-14's
Divergence on price/RSI.
Falling Wedge
Would like to see price get over and hold above daily 50MA
Will likely update once that is achieved
After 50MA is achieved and held, breakout the wedge and target the 200MA daily for profit.
Add on down days and be very patient with this one

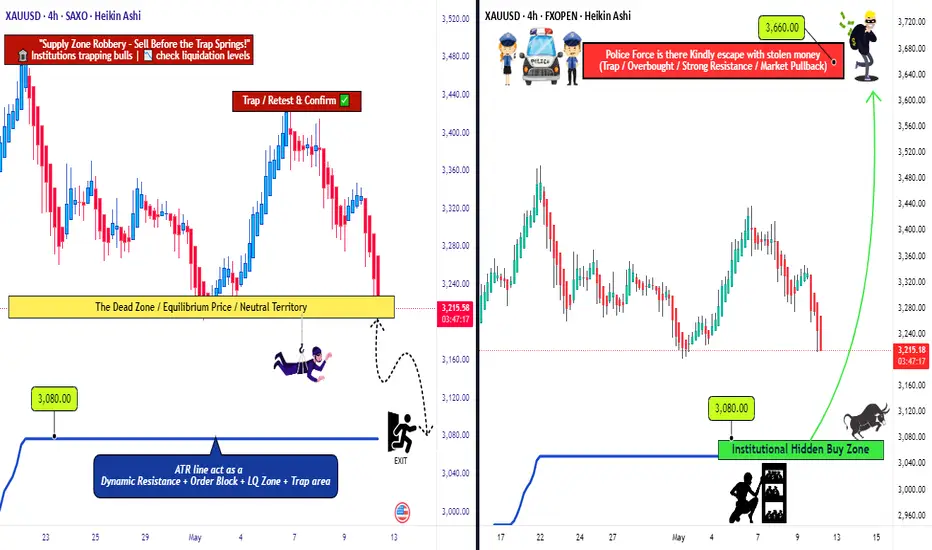
Golden Opportunity: XAU/USD’s Bull & Bear Heist Strategy!Hello Money Makers & Market Bandits! 🤑💰✈️
Get ready to raid the XAU/USD Gold Market with our cunning Thief Trading Style, blending sharp technicals and deep fundamental insights! 📊🔥 Our plan? Strike with precision on both bullish and bearish moves, grabbing profits before the market turns. Let’s outwit the charts and stack that gold! 🏆💸
📈 The Gold Heist Plan
Entry Points 🚪:
🏴☠️ Bullish Move: Wait for a pullback to the Institutional Hidden Buy Zone at 3080—your signal to jump in for bullish gains!
🏴☠️ Bearish Move: Watch for a breakout below the neutral level at 3200—time to ride the bearish wave!
Tip: Set alerts to catch these key levels! 🔔
Stop Loss (SL) 🛑:
Bullish Trade: Place SL at 2960 (4H swing low, Institutional Hidden Buy Zone).
Bearish Trade: Set SL at 3360 (4H swing high).
Adjust SL based on your risk, lot size, and number of orders. Stay sharp—this is your shield! ⚠️
Take Profit (TP) 🎯:
Bullish Robbers: Aim for 3660 or exit early if momentum fades.
Bearish Robbers: Target 3080 or slip out before the market flips.
Escape Plan: Watch for overbought/oversold signals to avoid traps! 🚨
📡 Why XAU/USD?
The Gold Market is in a bearish trend 🐻, driven by:
Fundamentals: USD strength from Fed policy, US growth, and tariffs.
Macroeconomics: US resilience vs. global economic weakness.
COT Data: Bearish speculative bets favor USD.
Intermarket: Rising US yields and equities boost USD, pressuring gold.
Quantitative: RSI and Fibonacci confirm bearish momentum.
🧠 Sentiment Outlook (May 12, 2025)
Retail Traders:
🟢 Bullish: 42% 😊 (Hoping for gold rebound on trade war fears)
🔴 Bearish: 45% 😟 (USD strength and improved US-China relations weigh)
⚪ Neutral: 13% 🤔
Source: Social sentiment & trading platform polls
Institutional Traders:
🟢 Bullish: 30% 💼 (Safe-haven demand amid geopolitical uncertainty)
🔴 Bearish: 60% ⚠️ (USD rally and higher concrete 5/12/2025)
🟢 Bullish: 30% 💼 (Safe-haven demand amid geopolitical uncertainty)
🔴 Bearish: 60% ⚠️ (USD rally and higher yields suppress gold)
⚪ Neutral: 10% 🧐
Source: COT reports & institutional flows
⚠️ Trading Alert: News & Risk Management 📰
News can shake the market like a storm! Protect your loot:
Skip new trades during major news releases.
Use trailing stop-loss to lock in profits and limit losses.
Stay vigilant—volatility is our playground, but only with a plan!
💪 Ride with the Thief Trading Team!
Hit the Boost Button to power up our Thief Trading Style and make this heist epic! 🚀 Each boost fuels our squad, helping us plunder profits daily. Let’s conquer the XAU/USD market together! 🤝
Stay tuned for the next heist! 🐱👤 Keep your charts ready, alerts on, and trading vibe high. Catch you in the profits, bandits! 🤑🎉
#ThiefTrading #XAUUSD #GoldHeist #TradingView #StackTheGold
WTI CRUDE OIL: Channel Down bottomed. Buy opportunity.WTI Crude Oil is heavily bearish on its 1D technical outlook (RSI = 38.039, MACD = -2.310, ADX = 38.046) as it is trading inside a Channel Down for more than 1 year. Last week's low has made a technical LL at the bottom of the pattern and the current consolidation indicates that this may be an attempt to initiate the new bullish wave. The 1D RSI recovered from being oversold previously and this potentially hints to a rebound over the 1D MA200. The last bullish wave crossed above the 0.618 Fibonacci marginally. Trade: long, TP = 71.00.
## If you like our free content follow our profile to get more daily ideas. ##
## Comments and likes are greatly appreciated. ##

Bullish continuation?XAU/USD is falling towards the support level which is a pullback support that is slightly above the 38.2% Fibonacci retracement and could bounce from this level to our take profit.
Entry: 3,156.20
Why we like it:
There is a pullback support level that is slightly above the 38.2% Fibonacci retracement.
Stop loss: 3,083.60
Why we like it:
There is a pullback support level that aligns with the 50% Fibonacci retracement.
Take profit: 3,242.52
Why we like it:
There is a pullback resistance level.
Enjoying your TradingView experience? Review us!
Please be advised that the information presented on TradingView is provided to Vantage (‘Vantage Global Limited’, ‘we’) by a third-party provider (‘Everest Fortune Group’). Please be reminded that you are solely responsible for the trading decisions on your account. There is a very high degree of risk involved in trading. Any information and/or content is intended entirely for research, educational and informational purposes only and does not constitute investment or consultation advice or investment strategy. The information is not tailored to the investment needs of any specific person and therefore does not involve a consideration of any of the investment objectives, financial situation or needs of any viewer that may receive it. Kindly also note that past performance is not a reliable indicator of future results. Actual results may differ materially from those anticipated in forward-looking or past performance statements. We assume no liability as to the accuracy or completeness of any of the information and/or content provided herein and the Company cannot be held responsible for any omission, mistake nor for any loss or damage including without limitation to any loss of profit which may arise from reliance on any information supplied by Everest Fortune Group.

Potential bullish rise?XAG/USD has bounce off the support level which is a pullback support that aligns with the 38.2% and the 23.6% Fibonacci retracement and could rise from this level to our take profit.
Entry: 30.52
Why we like it:
There is a pullback support level that lines up with the 38.2% and the 23.6% Fibonacci retracement.
Stop loss: 29.57
Why we like it:
There is a pullback support level which lines up with the 61.8% Fibonacci retracement.
Take profit: 31.93
Why we like it:
There is a pullback resistance level which aligns with the 61.8% Fibonacci retracement.
Enjoying your TradingView experience? Review us!
Please be advised that the information presented on TradingView is provided to Vantage (‘Vantage Global Limited’, ‘we’) by a third-party provider (‘Everest Fortune Group’). Please be reminded that you are solely responsible for the trading decisions on your account. There is a very high degree of risk involved in trading. Any information and/or content is intended entirely for research, educational and informational purposes only and does not constitute investment or consultation advice or investment strategy. The information is not tailored to the investment needs of any specific person and therefore does not involve a consideration of any of the investment objectives, financial situation or needs of any viewer that may receive it. Kindly also note that past performance is not a reliable indicator of future results. Actual results may differ materially from those anticipated in forward-looking or past performance statements. We assume no liability as to the accuracy or completeness of any of the information and/or content provided herein and the Company cannot be held responsible for any omission, mistake nor for any loss or damage including without limitation to any loss of profit which may arise from reliance on any information supplied by Everest Fortune Group.

Bullish bounce off pullback suport?The Gold (XAU/USD) is falling towards the pivot which has been identifed as a pullback support and could bounce to the 1st resistance.
Pivot; 2,954.94
1st Support: 2,790.01
1st Resistance: 3,132.12
Risk Warning:
Trading Forex and CFDs carries a high level of risk to your capital and you should only trade with money you can afford to lose. Trading Forex and CFDs may not be suitable for all investors, so please ensure that you fully understand the risks involved and seek independent advice if necessary.
Disclaimer:
The above opinions given constitute general market commentary, and do not constitute the opinion or advice of IC Markets or any form of personal or investment advice.
Any opinions, news, research, analyses, prices, other information, or links to third-party sites contained on this website are provided on an "as-is" basis, are intended only to be informative, is not an advice nor a recommendation, nor research, or a record of our trading prices, or an offer of, or solicitation for a transaction in any financial instrument and thus should not be treated as such. The information provided does not involve any specific investment objectives, financial situation and needs of any specific person who may receive it. Please be aware, that past performance is not a reliable indicator of future performance and/or results. Past Performance or Forward-looking scenarios based upon the reasonable beliefs of the third-party provider are not a guarantee of future performance. Actual results may differ materially from those anticipated in forward-looking or past performance statements. IC Markets makes no representation or warranty and assumes no liability as to the accuracy or completeness of the information provided, nor any loss arising from any investment based on a recommendation, forecast or any information supplied by any third-party.

Bearish drop?WTI Oil (XTI/USD) has reacted off the pivot which has been identified as a pullback resistance and could drop to the 127.2% Fibonacci support.
Pivot: 66.59
1st Support: 64.82
1st Resistance: 67.96
Risk Warning:
Trading Forex and CFDs carries a high level of risk to your capital and you should only trade with money you can afford to lose. Trading Forex and CFDs may not be suitable for all investors, so please ensure that you fully understand the risks involved and seek independent advice if necessary.
Disclaimer:
The above opinions given constitute general market commentary, and do not constitute the opinion or advice of IC Markets or any form of personal or investment advice.
Any opinions, news, research, analyses, prices, other information, or links to third-party sites contained on this website are provided on an "as-is" basis, are intended only to be informative, is not an advice nor a recommendation, nor research, or a record of our trading prices, or an offer of, or solicitation for a transaction in any financial instrument and thus should not be treated as such. The information provided does not involve any specific investment objectives, financial situation and needs of any specific person who may receive it. Please be aware, that past performance is not a reliable indicator of future performance and/or results. Past Performance or Forward-looking scenarios based upon the reasonable beliefs of the third-party provider are not a guarantee of future performance. Actual results may differ materially from those anticipated in forward-looking or past performance statements. IC Markets makes no representation or warranty and assumes no liability as to the accuracy or completeness of the information provided, nor any loss arising from any investment based on a recommendation, forecast or any information supplied by any third-party.

Could the Silver reverse from here?The price is rising towards the pivot which has been identified as a pullback resistance that lines up with the 138.2% Fibonacci extension and could reverse to the 1st support which is an overlap support.
Pivot: 34.86
1st Support: 32.94
1st Resistance: 36.08
S&P500 (US500) is falling towards the pivot which acts as a pullback support and could bounce to the 1st resistance which is an overlap resistance.
Pivot: 5,405.74
1st Support: 5,176.07
1st Resistance: 5,769.85
Risk Warning:
Trading Forex and CFDs carries a high level of risk to your capital and you should only trade with money you can afford to lose. Trading Forex and CFDs may not be suitable for all investors, so please ensure that you fully understand the risks involved and seek independent advice if necessary.
Disclaimer:
The above opinions given constitute general market commentary, and do not constitute the opinion or advice of IC Markets or any form of personal or investment advice.
Any opinions, news, research, analyses, prices, other information, or links to third-party sites contained on this website are provided on an "as-is" basis, are intended only to be informative, is not an advice nor a recommendation, nor research, or a record of our trading prices, or an offer of, or solicitation for a transaction in any financial instrument and thus should not be treated as such. The information provided does not involve any specific investment objectives, financial situation and needs of any specific person who may receive it. Please be aware, that past performance is not a reliable indicator of future performance and/or results. Past Performance or Forward-looking scenarios based upon the reasonable beliefs of the third-party provider are not a guarantee of future performance. Actual results may differ materially from those anticipated in forward-looking or past performance statements. IC Markets makes no representation or warranty and assumes no liability as to the accuracy or completeness of the information provided, nor any loss arising from any investment based on a recommendation, forecast or any information supplied by any third-party.

COCOA; Heikin Ashi Trade ideaPEPPERSTONE:COCOA
In this video, I’ll be sharing my analysis of COCOA, using my unique Heikin Ashi strategy. I’ll walk you through the reasoning behind my trade setup and highlight key areas where I’m anticipating potential opportunities. My goal is to help you enhance your trading skills and insights.
I’m always happy to receive any feedback.
Like, share and comment!

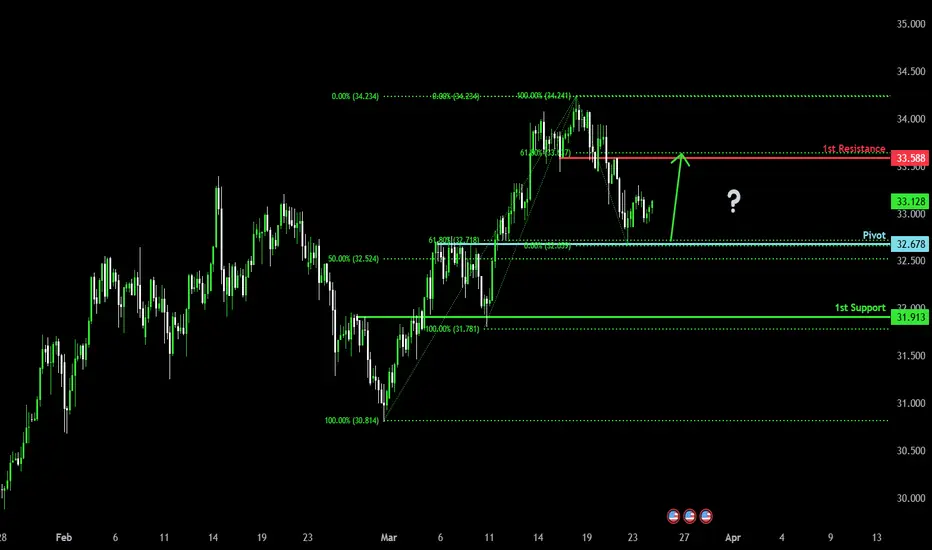
Potential bullish rise?The Silver (XAG/USD) has bounced off the pivot and could rise to the 1st resistance which aligns with the 61.8% Fibonacci retracement.
Pivot: 32.67
1st Support: 31.91
1st Resistance: 33.58
Risk Warning:
Trading Forex and CFDs carries a high level of risk to your capital and you should only trade with money you can afford to lose. Trading Forex and CFDs may not be suitable for all investors, so please ensure that you fully understand the risks involved and seek independent advice if necessary.
Disclaimer:
The above opinions given constitute general market commentary, and do not constitute the opinion or advice of IC Markets or any form of personal or investment advice.
Any opinions, news, research, analyses, prices, other information, or links to third-party sites contained on this website are provided on an "as-is" basis, are intended only to be informative, is not an advice nor a recommendation, nor research, or a record of our trading prices, or an offer of, or solicitation for a transaction in any financial instrument and thus should not be treated as such. The information provided does not involve any specific investment objectives, financial situation and needs of any specific person who may receive it. Please be aware, that past performance is not a reliable indicator of future performance and/or results. Past Performance or Forward-looking scenarios based upon the reasonable beliefs of the third-party provider are not a guarantee of future performance. Actual results may differ materially from those anticipated in forward-looking or past performance statements. IC Markets makes no representation or warranty and assumes no liability as to the accuracy or completeness of the information provided, nor any loss arising from any investment based on a recommendation, forecast or any information supplied by any third-party.
Heading into 38.2% Fibonacci resistance?WTI Oil (XTI/USD) is rising towards the pivot and could reverse to the pullback support.
Pivot: 71.33
1st Support: 65.73
1st Resistance: 73.43
Risk Warning:
Trading Forex and CFDs carries a high level of risk to your capital and you should only trade with money you can afford to lose. Trading Forex and CFDs may not be suitable for all investors, so please ensure that you fully understand the risks involved and seek independent advice if necessary.
Disclaimer:
The above opinions given constitute general market commentary, and do not constitute the opinion or advice of IC Markets or any form of personal or investment advice.
Any opinions, news, research, analyses, prices, other information, or links to third-party sites contained on this website are provided on an "as-is" basis, are intended only to be informative, is not an advice nor a recommendation, nor research, or a record of our trading prices, or an offer of, or solicitation for a transaction in any financial instrument and thus should not be treated as such. The information provided does not involve any specific investment objectives, financial situation and needs of any specific person who may receive it. Please be aware, that past performance is not a reliable indicator of future performance and/or results. Past Performance or Forward-looking scenarios based upon the reasonable beliefs of the third-party provider are not a guarantee of future performance. Actual results may differ materially from those anticipated in forward-looking or past performance statements. IC Markets makes no representation or warranty and assumes no liability as to the accuracy or completeness of the information provided, nor any loss arising from any investment based on a recommendation, forecast or any information supplied by any third-party.
