➡Ready for the following corn level? 💥I'm still invested with the rest of my original position long in corn, but I'm ready to scale out completely. But just now, I've noticed that the highs and lows from yesterday and today COULD form a beautiful symmetric triangle. So in this uptrend, this could be a chart pattern that indicates a continuation of the existing trend in corn.
Commoditytrading

GOLD (XAU/USD): detailed market outlook and MTF analysisAfter tapping into the zone of all-time high last week, the price of gold has been rapidly dropping ever since. From the DAILY timeframe chart, it can be witnessed that the previous DAILY candlestick has left a huge wick to the downside and closed in the favour of buyers. Yet, the current DAILY candle looks super bearish. It had been forecasted that the price is probably making a correctional move and visiting the area of $2000 before continuing its bullish movements. However, the price closed below that level of previous support and formed some sort of a Head&Shoulders pattern. At the moment, the price is sitting on the $1960 zone of support, and it can be inferred that quite a few nice bearish candles have been printed, which indicates a possible continuation to the downside. If the price manages to break below this area of demand, we can observe a further drop till the next zone of crucial support, which is $1915.

GOLD (XAU/USD): the beast will most likely keep growingAs it can be noticed from the chart, the price has been on a bullish run for quite some time. A nice uptrending curve illustrated on the graph serves as a powerful line of support. Moreover, the price is currently sitting on a zone of previous resistance now turned support. Therefore, we are waiting for a nice bottom to be formed before we can open long positions and aim for the zone of ATH. If the price manages to break below the zone of local support, the idea will become invalid.
Happy trading, family!

GOLD (XAU/USD): detailed outlook. Where are we headed next?Taking a look at the Weekly timeframe chart, it can be noticed that the price has been heavily rejecting the local crucial zone of resistance. The previous weekly candle has left a 700-pip wick and closed below the local structure.
Zooming into the H8 timeframe chart, it can be seen that the price has formed some sort of a Head&Shoulders pattern. We are patiently waiting for the price to break and retest the $1888 level of support, before further downside movements can take place. The $1845 zone of support will be eyed as the next possible target.
Happy trading, everyone!

UKOIL short position selling from the 80sAs the new year begins, the markets are a little quiet but in the oil , markets seem a little confusing, Based on OPEC-JMMC Meetings we made our view on the oil market.
"That's one way of looking at it OPEC plus seems confident that despite omicron spreading rapidly around the world and with cases rising it's not going to have that much of an impact on oil demand the group is expecting the oil market to be in a supply surplus in the first and second quarters"
While the U.S airlines have canceled and delayed thousands of flights since 23 December 2021, The energy sector will depend on storage more than consumption in the coming period.
OPEC plus is probably not almost certainly not going to actually add 400 000 barrels a day to the market because of supply problems incertain members in the oil club.
I see OPEC crude oil production increasing since Jul 2020 :
24.82M bbl /d on Jul 2020
to be 28.87M bbl /d in Aug 2021
Making the oil production increase +16.31% in one year.
The technical view
you will see 83.00 -82.00 area as a supply area on the chart,
also, 86.50 - 85.00 area is a strong historical supply area.
The Market tend to sell from these areas, we may see some increase in the price shortly
but in the volume indicator the average volume is in decline
For the position
I recommend a sell order from 83.00 -81.50 area
Sell limit on 84.5- 86.5 in case the market still growing before retrograding
Targets
1st target 77. 40 - 77.00 demand area
2nd target 68.40- 69.10 demand area
The period of the Positon is more than 1 month up to 5 months (estimated )
This is a swing trade so be patient we estimate +16% to +20% profit for 5 months
The news and numbers source coming from
theoilsellers.com/
news.cn/
ycharts.com/

GOLD approaching strong resistance area !!Razu Munikar,
Reconsidering my count here. A WXY corrective structure has ended for now and a lot of room to continue upside as i see. GOLD as per previous analysis has seen a pretty smooth upside move. But it's nearing a strong resistance area at 61.8% area. Will it break it or fake it? The breakout above it will create an all time high as per my analysis. (Do due diligence).

COPX LongAMEX:COPX
The Global X Copper Miners ETF (COPX) provides investors access to a broad range of copper mining companies. It seeks to provide investment results that correspond generally to the price and yield performance, before fees and expenses, of the Solactive Global Copper Miners Total Return Index.
www.globalxetfs.com

GOLD (XAU/USD): visiting $1784 again?As it can be inferred from the chart, the price is currently in the process of completing the correctional move of the strong impulsive move that took place last week. The price is currently forming a Head&Shoulders pattern at the area of a local resistance that lines up with 0.382 Fibonacci retracement level. We are expecting for the price to keep dropping all the way down after the formation of the right shoulder is completed.

XAUUSD, price towards 1812 crucial zone at starting of FebGold against Dollar price has a bearish final week on January , Nothing wrong to say a break out trade happened by breaking 1808 price zone last week, Expecting the price to go upwards on the first phase of the week towards 1812 zone ,
if it breaks again upwards it has a great chance to higher towards 1900 , if not price will come down towards 1770 zone
Analysis only for education purpose

GOLD (XAU/USD): break and re-test done, time to fly!As it can be inferred from the chart, after a massive bullish candle penetrated through the zone of resistance identified on the chart, a nice re-test has been completed as well. We are now expecting for the price to keep rising and reach the area of resistance illustrated on the graph. The sentiment of the market is bullish, so we believe that the probability of the price reaching the zone of supply is really high.

GOLD (XAU/USD): detailed breakdown and explanation In the previous analysis for GOLD, we had mentioned that the price is most likely to visit the area of the ascending trendline that aligns with 50% Fibonacci level once again, before continuing its moves to the upside. As it can be seen from the graphical illustration, a nice bullish hammer candlestick pattern was formed earlier, as the price nicely rejected the area of 0.5 Fibonacci retracement. We are now expecting for the price to keep rising all the way up and reach the zone of $1877.
Happy trading, everyone!

GOLD (XAU/USD): more upside movements en routeThe price is currently sitting at an important level of resistance. The last few DAILY timeframe candlesticks are indicating a massive bullish pressure. As or right now, it is a bit difficult to predict whether there is a possibility for the price to drop till the 50% Fibonacci level before continuing its powerful bullish movements. However, we will keep monitoring the price action and look for more confirmations before going long and aiming for the target level indicated on the graphical illustration.
Happy trading, everyone!

BITCOIN: buy/sell at a re-testAs it can be inferred from the chart, the price has broken out of a downtrending channel but has failed to continue rising to the upside. A mini-range has been formed and the price is stuck between the boundaries of it. We will be waiting for a successful break+retest of one of the boundaries before opening a SELL/BUY position and aiming for one of the areas identified on the chart

Oil Next BullRun ??
Hey Guys, This is a very similar setup to my Silver trade were they're showing signs of recovery and possible reversal to continue larger trends. Oil has now re-entered the channel it has been in since March and showing great strength busting past the 150 day MA with the trend line. on the on the smaller time frame it has broken out of its Bull Flag pattern so that means more upside to come. It has burnt off a lot of excess in the RSI giving it room to make a big push to my target at $83.75 target where it should take a breather on that resistance line. There is Still a downward trend line to beat for the move to confirm so possibly wait for that but I'm pretty convinced it will break.
3% risk to 15% reward
With the warrants I'm buying its a:
profit 30%
loss 6%

Coffee Can Become Cheaper - Reaching Reversal FCP ZoneTraders, Coffee like other commodities has been on a huge run this year. But now it has reached a point of pause, correction and possibly reversal too. So coffee futures can fall down from the FCP zone. Wait for a confirmation as the market has been trending hard upwards.
Rules:
1. Never trade too much
2. Never trade without a confirmation
3. Never rely on signals, do your own analysis and research too
✅ If you found this idea useful, hit the like button, subscribe and share it in other trading forums.
✅ Follow me for future ideas, trade set ups and the updates of this analysis
✅ Don't hesitate to share your ideas, comments, opinions and questions.
Take care and trade well
-Vik
____________________________________________________
📌 DISCLAIMER
The content on this analysis is subject to change at any time without notice, and is provided for the sole purpose of education only.
Not a financial advice or signal. Please make your own independent investment decisions.
____________________________________________________

BITCOIN (BTC), quick update. When are we launching to Mercury?Hey, family! Quick update on Bitcoin.
Nothing much has changed since our last analysis on Monday as the price is still consolidating around a possible entry zone. The chart analysis pretty much says it all about why our bias is bullish on this pair. Multiple technical confluences are being lined up perfectly: the formation of Higher Highs and Higher Lows, an ascending zone connecting the dips of the price and so forth.
We are pretty positive about the setup and we will be opening long positions once the time is right and our target will be set at the ATH.
Trade safe and with patience, dear community members!
All the best,
Investroy Team

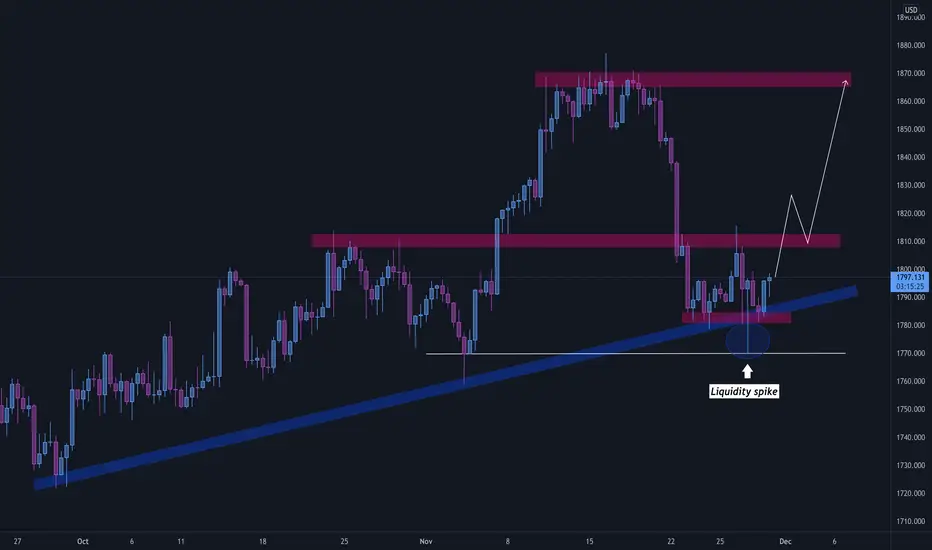
GOLD (XAU/USD), detailed breakdown and next stepsTO begin with, the sentiment of the market is pretty bullish. After a massive drop last week, the price has formed a valid bottom and is now charging up for further bullish movements. During the market opening this week, a massive candle spike broke the sideways moving range to the downside, grabbed some liquidity, and then returned back into the range.
We are patiently waiting for the market to give us some more confirmations before we open BUY positions and and aim for the target identified on the chart.
Substitution Spreads Can Identify ValueMarket structure is the various puzzle pieces that can reveal valuable clues about the path of least resistance of prices. Fundamental analysis involves pouring through supply and demand data to forecast price direction. However, market structure can simplify the process as each jigsaw puzzle piece will complete an emerging picture. Market structure reflects price relationships that develop over time. Each commodity has idiosyncratic supply and demand characteristics. Price differentials in intra or intercommodity spreads can assist market participants in arriving at high-odds directional forecasts.
Substitution spreads are another part of market structure
The platinum versus gold spread- Financial substitution leads to value assumptions
Oil, coal, and natural gas- Energy substitutes can reveal clues
Think outside the box when analyzing a commodity- It’s all about choices
Over the past weeks, we have looked at how processing spreads provide clues about the supply and demand side of a commodity’s fundamental equation. We looked at term structure, backwardation, and contango and how price differentials for one delivery date versus another are real-time indicators of deficit or glut conditions. Location spreads shed light on the price of a commodity in one region versus another, while quality spreads tell us how different compositions or sizes can influence prices compared to benchmarks and put upward or downward pressure on futures prices.
Those spreads are all intra-commodity spreads. This week, we will investigate how inter-commodity spreads play a role in price direction. Substitution spreads reflect the price of one commodity versus another when they can serve the same or similar purposes when prices dictate.
Substitution spreads are another part of market structure
Markets reflect the crowd’s wisdom. Crowds tend to be wise consumers; they search for value and the best deal. When the price of a commodity rises to a level where a substitute makes more economic sense, many consumers will alter their buying behavior. Think of a trip to the supermarket. When shoppers plan to make a juicy steak for dinner and find out that a pork chop is a far better economic choice, they often choose pork over beef.
I like to call the live cattle versus lean hog futures spread the what’s for dinner spread, and it is an inter-commodity, substitution spread.
The quarterly chart of the price of live cattle futures divided by lean hogs shows that while the spread has an upward bias, the long-term average or pivot point is around the 1.40:1 level or 1.4 pounds of pork value in each pound of beef value. When the spread is above 1.4:1, pork is a wiser economic choice for consumers; when below the mean, beef is the optimal choice. While the spread can diverge from the midpoint, it has tended to revert to the norm since the turn of this century.
The chart of the June 2022 live cattle lean hog spread shows the relationship is right around the long-term average, indicating that beef and hog prices are at a long-term “fair value” level.
The beef versus pork spread is an inter-commodity barometer for consumer behavior. Meanwhile, the corn-soybean inter-commodity spread can serve as a guide for producer behavior.
The chart of the price of nearby soybean futures divided by corn futures shows that the pivot point dating back to the late 1960s is around the 2.4 bushels of corn value for each bushel of soybean value. Farmers are business people who work each crop year to create the optimal return on their acreage. Many can plant either corn or beans on their land. They grow the crop that offers the best return. When the corn-bean ratio spread is above 2.4:1, soybeans tend to provide the best financial result; when below the pivot point, corn is the more profitable choice.
The corn-bean relationship is most useful when looking at new crop futures before and at the beginning of the annual planting season.
The chart of the price of new crop November 2022 soybean futures divided by new crop December 2022 corn futures illustrates at below 2.26:1, on November 12, 2021, farmers are more likely to plant corn than beans as the coarse grain is more expensive and offers a better historic return than the oilseed.
The meat and grain inter-commodity spreads are guides. Many other factors could influence the levels, which are additional variables in the calculus of analyzing commodity prices. For example, a pork shortage in China because of disease could lift pork prices, or an outbreak that impacts cattle could do the same to beef. Since corn is the primary input in producing US ethanol, the shift in US energy policy could shift the corn-bean spread for fundamental reasons. However, these types of spreads that measure current price relationships versus historical means can be a helpful tool that may validate other assumptions.
The platinum versus gold spread- Financial substitution leads to value assumptions
In the world of precious metals, platinum and gold have far different supply and demand characteristics, but the two precious metals share some similarities. Platinum and gold have industrial applications, while they also have financial properties as means of exchange and stores of wealth for investors.
It is a challenge to label the price of any commodity cheap or expensive because the current market price is always the correct price as it is the level where buyers and sellers meet in a transparent market, the exchange. However, comparing the price of gold to platinum allows us to use the terms cheap and expensive on a historical basis.
The chart of the nearby platinum futures price minus the nearby gold futures price dating back to the early 1970s shows that from 1974 through 2014, platinum mostly traded at a premium to gold. While the spread has been as high as over a $1,000 premium for platinum to as low as a $1,000 discount to gold over the period, over the past 47 years, platinum has traded at a premium to gold nearly 85% of the time. It has only been over the recent seven years, since 2014, that platinum has been lower than the yellow metal. Many factors can explain platinum’s weakness versus gold, but on a historical basis, platinum is historically inexpensive compared to its precious yellow cousin.
At a $780 discount for platinum compared to gold, some investors have been stockpiling platinum because the inter-commodity spreads reflect compelling historical value for the metal.
Oil, coal, and natural gas- Energy substitutes can reveal clues
Energy prices can be highly volatile. While the world moves to address climate change by reducing the production and consumption of fossil fuels in favor of alternative renewable energy sources, hydrocarbons continue to power the world. When it comes to electricity production, power generation can come from many different sources. The world may be moving towards solar, wind, hydroelectric, and nuclear generations, but oil, gas, and coal continue to be significant energy sources.
Coal has been a four-letter word for many years, and many mining companies abandoned coal mining. The recent surge in oil and gas prices caused an almost perfect bullish storm in the coal market. Low supply levels and rising demand pushed prices to record highs in October.
The chart of thermal coal for delivery in Rotterdam, the Netherlands, shows the rise to a high of $280 per ton in October 2021, surpassing the 2008 $224 previous high. The spike higher in coal was a function of rising oil and gas prices, which is the essence of the inter-commodity spread within the fossil fuel sector.
Crude oil and natural gas are highly volatile commodities. There is always the potential for substitution when prices diverge from historical means.
The quarterly chart of the price of nearby NYMEX crude oil futures divided by the price of nearby NYMEX natural gas futures shows that the average of the high and the low since 1990, when natural gas futures began trading, is around the 20-25:1 of the natural gas price measured against the crude oil price. Below that band, natural gas tends to be historically expensive, while above the average level, crude oil becomes historically expensive compared to gas.
The daily chart of the relationship in the December futures contracts shows below the 17:1 level; natural gas is cheaper than oil based on the historical relationship over more than three decades.
Think outside the box when analyzing a commodity- It’s all about choices
Inter-commodity or substitutions spreads create a basis for comparison. Many other factors can explain deviations from historical norms but understanding and comparing the current levels to history is a valuable tool that can lead to a more robust level of analysis.
On their own, substitution spreads are insufficient to make conclusive trading or investing decisions as deviations can last for years or even decades, moving pivot points higher or lower. However, used in conjunction with processing spreads, term structure, location, and quality spreads, they are another puzzle piece that can reveal and validate assumptions about the path of least resistance for a commodity’s price.
I will be off next week but will return on Monday, November 29, with the final piece in this series and the final piece of the puzzle, the power of the crowd.
---
Sign up for our Monday Night Call using the link below. You can also sign up to receive these articles early using the other link provided below.
Trading advice given in this communication, if any, is based on information taken from trades and statistical services and other sources that we believe are reliable. The author does not guarantee that such information is accurate or complete and it should not be relied upon as such. Trading advice reflects the author’s good faith judgment at a specific time and is subject to change without notice. There is no guarantee that the advice the author provides will result in profitable trades. There is risk of loss in all futures and options trading. Any investment involves substantial risks, including, but not limited to, pricing volatility, inadequate liquidity, and the potential complete loss of principal. This article does not in any way constitute an offer or solicitation of an offer to buy or sell any investment, security, or commodity discussed herein, or any security in any jurisdiction in which such an offer would be unlawful under the securities laws of such jurisdiction.

Are Commodity Prices Going Up? Lumber, Cash Crops, And Iron OreSome interesting factors are currently affecting commodity prices. Supply chain bottlenecks, unpredictable demand from economies reopening, geo-political tensions, climate change policies are just a few examples.
I find it helpful to review the state of the commodities market periodically. In this article, we will examine Lumber, Cash Crops, and Iron Ore.
Commodity prices: Lumber
Lumber Mills have done their best to increase timber supply in 2021, with production hitting a 13-year high to meet the unpredicted demand from new house builds and renovations. After reaching a peak of over US $1,600 per thousand board feet in May this year, Chicago Lumber Futures have retraced to US ~$640 per thousand board feet as of early November. It could be said that the psychological level of US $600 is very supportive of this commodity. November 2021, and January and March 2022 Future prices are also trading above this level.
Speculation is rife that Lumber is due for another price run-up, with Sawmills cutting production to counter the gluttonous output earlier in the year. One indicator supporting this theory is Chicago Lumber Futures increasing by just-under ~40% since plateauing in August, at one point hitting US $820 in mid-October.
Commodity prices: Cash Crops
Corn and many other grain Futures are currently trading at premiums or multi-year highs, including Wheat and Oats. As of writing, Corn, Wheat, and Oats are trading at 555 USd/Bu, 781 USd/Bu, 716 USd/Bu, respectively.
Several factors have led to inflation in grain prices. For one, we can thank (or curse) the high cost of crude oil. Due to WTI and Brent trading US ~$80 per barrel, demand for ethanol has been pushed to the extreme. It is important to note, that in the US, Ethanol is produced predominantly by fermenting Corn (25% of the Corn grown in the US is used for ethanol production).
Kluis Commodity Advisors does not believe the prices of grains is sustainable, even in the short term. The Advisors go so far as to suggest that farmers should be hitting the sell button right now to make the most of the grain rally. Butting up against this prediction are forecasts for a continuation of unfavourably dry weather, which have already put the supply of Cash Crops, including Wheat and Oats, in a precarious position.
Commodity prices: Iron Ore
From mid-September until the end of October, Iron Ore appeared to have found a safe space above US $100. Now, after a steep decline beginning October 27, 2021, Iron Ore has started to test May 2020 lows, close to US $90 per metric tonne. The commodity is grating against predictions by ANZ Bank (ASX: ANZ) for it to “find a floor around current levels”.
Demand (or lack thereof) from China is what has driven the price of Iron Ore sub-100 dollars. Chinese authorities have ordered its steel manufacturers (large consumers of Iron Ore) to cut production to meet targets to reduce energy consumption and pollution across its provinces. China’s production restrictions are scheduled to last until mid-March 2022.
According to S&P Global, Iron Ore outlook is unfavourable, with “pricing risk is to the downside” as supply tends to increase in the latter half of the year.

Commodity prices: Iron OreFrom mid-September until the end of October, Iron Ore appeared to have found a safe space above US $100. Now, after a steep decline beginning October 27, 2021, Iron Ore has started to test May 2020 lows, close to US $90 per metric tonne. The commodity is grating against predictions by ANZ Bank (ASX: ANZ) for it to “find a floor around current levels”.
Demand (or lack thereof) from China is what has driven the price of Iron Ore sub-100 dollars. Chinese authorities have ordered its steel manufacturers (large consumers of Iron Ore) to cut production to meet targets to reduce energy consumption and pollution across its provinces. China’s production restrictions are scheduled to last until mid-March 2022.
According to S&P Global, Iron Ore outlook is unfavourable, with “pricing risk is to the downside” as supply tends to increase in the latter half of the year.

USOIL -1hr Timeframe Fibonacci 1hr Timeframe Fibonacci
Awaiting confirmation from the 100% on the Fibonacci. Forecast for a movement short and hit 38.2%
SBCapital1 on Socials
This is not a signal - Just a personal forecast.

GOLD, detailed breakdown and next stepsThe price is currently located at the lower boundary of the uprising range. We will closely monitor the price action and open positions for GOLD after enough confirmations have been provided. If the price manages to break the lower boundary of the channel and re-test the broken structure, we will be looking forward to opening SELL positions and aiming for the area identified on the chart. On the other hand, if the price forms a nice bottom and prints powerful bullish candles, we will be opening long positions and aiming for the $1830 zone of crucial resistance.

Corn - reasons why it could be bullishETF Corn is in the middle of a pullback, but is it bullish and due for a trend reversal above 1.30?
