GOLD, detailed breakdown and next targetThe sentiment of the GOLD market is clearly bullish. As we can observe from the graph, after series of long and dull consolidations, a massive candle was able to break the upper boundary of the sideways moving range last week. The price dropped again right after, in order to correct the massive bull candle and re-test the area of the broken resistance.
Now, as we can see from the chart, the price is currently testing a zone of previous resistance turned support on lower timeframes, which also aligns with the golden fibonacci ratio. We are now waiting for the price to carefully retrace this zone and form a nice mini-bottom, before we open long positions and aim for the previous Higher High.
Happy trading, family!
Commoditytrading

When Might The Price Of Natural Gas Decompress?Traders that have taken a long position on Natural Gas will have been feeling lighter than air for the better part of 2021. Remarkably, the trading price of Natural Gas has rocketed up 115% since the beginning of the year, outperforming price increases in other commodities currently sitting close to record highs, Oats (up by 63.83% YTD), Copper (up by 19.65% YTD), and steel (up by 38.27% YTD). As of writing, Natural Gas is trading at $5.592 per million British thermal units, a thirteen year high for the commodity.
What Is The Reason For The Meteoric Rise In Natural Gas
An unusually scorching 2021 summer in the US drove demand for air conditioning and Natural Gas beyond normal levels, resulting in a lower stockpile of the commodity for an unusually cold winter. Following this, extreme weather conditions, such as Hurricane Ida, interrupted Natural Gas extraction in the Gulf of Mexico’s most productive zone.
Will The Price Of Natural Gas Recede?
Typically, when the price of a commodity rises, new investment will enter the market to scoop up the high prices. Regarding Natural Gas, the new investment could be from gas companies lifting output at existing gas wells or exploring new wells that will raise production. Counter-productively, the new investment and resulting lift in gas supply would help suppress the price rises in the commodity.
New investment in Natural Gas has stalled as of late. While fossil fuels will still be needed for a long time, so-called ‘Zero Carbon’ policies from governing bodies worldwide are disincentivising Natural Gas exploration. The long-term prospects of Natural Gas wells are less certain and less attractive when contending with the likes of the Biden Administration throwing its full support behind renewable energy sources as the US engages in a wide-scale upgrade to its infrastructure. One project for the Biden Administration is for the US electric grid to be powered by 50% solar within the next thirty years. Achieving this goal would severely squeeze demand for Natural Gas, which, according to the EPA, generated approximately 40% of the country’s electricity in 2020.

Descending Triangle in Natural Gas, Downside Target of 4.70Trend Analysis
The main view of this trade idea is on the 15-Min Chart. The commodity Natural Gas is currently in a descending triangle setup with lower highs around the 5.20 and 5.08 price levels and support observed around the 4.95 price level. If the commodity breaks through the 4.95 support it can head towards the 4.70 price level. Failure of this pattern will occur if Natural Gas were to rally above 5.10.
Technical Indicators
The commodity is currently trading below is short (50-MA), medium (100-MA) and long (200-MA) fractal moving averages. There has been negative crossovers on the short and medium as well as the medium and long term moving averages. These moves are bearish indications. To corroborate these signals of upcoming declines are the RSI being below the 50 level as well as a recent negative crossover in the KST.
Recommendation
The recommendation will be to go short at market, with a stop loss at 5.10 and a target of 4.70. This produces a risk/reward ratio of 2.31.
Disclaimer
The views expressed are mine and do not represent the views of my employers and business partners. Persons acting on these recommendations are doing so at their own risk. These recommendations are not a solicitation to buy or to sell but are for purely discussion purposes.

GOLD, time to launch the rocketThe price is currently sitting on a massive zone of support. We can see some signs of bullish movements from here to the upside. We are waiting for more confirmations before executing buy positions and aiming for the upside

Potential Break in Brent Crude Oil Towards 74.25Trend Analysis
The main view of this trade idea is on the 15-Min Chart. The consolidation in Brent Crude Oil over the last couple of days has produced 2 chart pattern setups, a Rectangle as well as a Reverse Head and Shoulders. Resistance for the Rectangle is around the 72.50 price level while support is seen at the 70.85 price level, which is also the Head of the Head and Shoulders pattern. The Left and Right Shoulders are around the 71.35 price level while the Neckline is around the 72.30 resistance. The completion of these chart patterns will take the commodity between 73.65 and 74.25.
Technical Indicators
Brent Crude Oil is trending higher as it is currently above its short (25-MA), medium (75-MA) and long (200-MA) fractal moving averages. Also the short MA is above both the medium and long term MA and the medium term MA is above the long term MA. This denotes an uptrend over the respective timeframe. The RSI is above 50 and there has been a positive crossover on the KST.
Recommendation
The recommendation will be to go long at market. Stop loss will be set around the 70.80 price level and a target of 74.25. This produces a risk-reward ratio of 1.12.
Disclaimer
The views expressed are mine and do not represent the views of my employers and business partners. Persons acting on these recommendations are doing so at their own risk. These recommendations are not a solicitation to buy or to sell but are for purely discussion purposes. At the time publishing, I have a position in Brent Crude Oil.

Crude Oil Correction - Another US Policy MisstepIn early July 2021, nearby NYMEX crude oil futures rose to the highest price since 2014 after rising to a high of $76.98 per barrel. The price eclipsed the October 2018 $76.90 high by only eight cents.
The crude oil futures market ran out of upside steam at the early July high and has made lower highs over the past seven weeks. At around the $62 per barrel level at the end of last week, the September futures contract was in a short-term bearish trend. Meanwhile, over the past year, the energy commodity made great strides on the upside.
Virus variants and China weigh on the energy commodity
US energy policy is bullish for crude oil
A bull market since April 20, 2020
The US administration and crude oil- Comedy or Tragedy?
Levels to watch in crude oil
The most recent selling reflects a long-overdue correction. The slowing Chinese economy, along with other factors, is likely weighing on crude oil. Crude oil futures take the stairs to the upside during rallies and an elevator lower when the price corrects. While we could see lower prices over the coming weeks and months, the underlying support issues facing the energy commodity suggest that it is not a time to become too bearish on petroleum as it continues to power the world.
Virus variants weigh on the energy commodity
As the delta variant of COVID-19 spreads throughout the unvaccinated population, with reports of some breakthrough cases in those who received vaccines, economic activity has begun the slow. Fears of a return of widespread cases have caused economic growth to slow. Meanwhile, China has cracked down on some sectors of its business sector that raise capital in the west, causing its economy to cool over the past weeks. The demand for energy has begun to decline, sending the crude oil price to its lowest level since late May over the past week.
The chart of the now active month October NYMEX crude oil futures highlights the decline from a high of $74.77 per barrel on July 6. In July and August, crude oil has made lower highs and lower lows, falling to $61.82 on August 20, the lowest price since May 21. The next level of technical support stands at the May 21 $60.68 low on October futures.
Open interest, the total number of open long and short positions in the NYMEX crude oil futures market, has declined from 2.414 million contracts on July 6. The decline reflects long liquidation. Falling price and declining open interest are not typically a technical validation of an emerging bearish trend. Price momentum and relative strength indicators have dropped to oversold territory. As crude oil has been correcting slowly and not taking an elevator shaft lower, daily historical volatility was just below 27% on August 20.
Over the past week, the prospects for higher US interest rates lifted the US dollar index to its highest level in 2021. The dollar index rose over the 93.47 March high. A stronger dollar tends to weigh on commodity prices, and crude oil is no exception. However, the Fed canceled its in-person Jackson Hole event, citing the rising number of delta variant cases. We will soon find out if the central bank decides to stall tapering quantitative easing because of the virus. A prolonged period of inflationary monetary policy could cause raw material prices to resume their ascent.
US energy policy is bullish for crude oil
President Biden pledged to address climate change during his 2020 campaign. Following that promise, he canceled the Keystone XL pipeline project on his first day in office by issuing an executive order. In May, the administration banned oil and gas drilling and fracking on federal lands in Alaska. While crude oil demand has been booming over the past months, US output stood at 11.4 million barrels per day as of August 13, 13% below the record high of 13.1 mbpd in March 2020.
Meanwhile, US crude oil and oil product inventories have declined in 2021.
According to the American Petroleum Institute, US crude oil stockpiles declined by 51.508 million barrels from January 1 through August 13, 2021. Gasoline stocks were 4.9509 million barrels lower, and distillate inventories dropped by 9.571 million barrels.
The Energy Information Administration data shows a 57.8 million barrel drop in crude oil stocks, with gasoline inventories 8.4 million barrels lower so far this year. Distillates have declined by 13.9 million barrels. US daily production has increased from 11.0 mbpd to 11.4 mbpd since early January, but it is insufficient to keep stockpiles from falling.
US energy policy is weighing on output as increased regulations, and a shift to a greener path for powering the US causes fossil fuel production to decline. Meanwhile, crude oil and oil product prices have moved substantially higher in 2021:
Nearby NYMEX crude oil futures closed 2020 at $48.42 per barrel. At $62.32 per barrel on August 20, the energy commodity was over 28.7% higher even after the recent correction.
Nearby NYMEX gasoline futures closed 2020 at $1.4238 per gallon. At $2.0236 on August 20, the fuel was 32.1% higher for the year.
Nearby NYMEX heating oil futures, a proxy for distillate prices, settled at $1.4832 per gallon at the end of December 2020. At $1.9082 on August 20, distillate prices rose by 28.7%.
While the US is on a greener path of energy production or consumption, the US and the world continue to rely on crude oil and oil products for power.
For decades, the US struggled to achieve energy independence from the Middle East, home to over half the world’s crude oil reserves. Over the past years, rising shale production and a drill-baby-drill and frack-baby-frack policy caused the US to take the leadership role in output, achieving its goal. The change in energy policy under the Biden administration has shifted crude oil’s pricing power back to OPEC and the cartel’s partner, Russia. As the Saudi oil minister said earlier this year, “Drill-baby-drill is gone forever.”
A bull market since April 20, 2020
At the height of the global pandemic, energy demand evaporated. Nearby Brent crude oil futures fell to the lowest price of this century at $16 per barrel. NYMEX futures fell below zero as the landlocked crude oil ran out of storage as inventories exploded.
As the monthly chart shows, at over the $62 level on August 20, 2021, crude oil futures remain over $100 per barrel higher than the April 20, 2020, negative $40.32 low. While the nearby futures have corrected by nearly $15 since the early July high, they remain in a bullish trend since the April 2020 low.
The US administration and crude oil- Comedy or Tragedy?
If the Biden administration should have learned anything from the current debacle in Afghanistan, timing is everything. The administration misjudged the Taliban’s ability to swoop across the country’s 34 provinces and capture its capital, Kabul, in short order. Transporting US citizens and Afghanis that assisted the US became a tragic chapter for the world’s wealthiest nation and leading military power.
Two weeks ago, before crude oil corrected, the Biden administration appealed to OPEC+ to produce more oil as gasoline prices had risen to multi-year highs. Opposition party Republicans and environmentalists noted that the President casts himself as a climate warrior moving the US towards cleaner energy to protect the planet. The request for OPEC to increase output only makes sense if their production comes from sources away from the earth.
After suffering under increasing shale production over the past years, OPEC+ does not have the US’s best interests at heart. The cartel is more likely to structure production policy to squeeze US consumers. After all, producing one barrel at $100 yields a better return than two at the $40 level.
The Biden administration has been in office for the past seven months. Immigration, Afghanistan, and energy policies have been far from successes over the period. One sector of the market could benefit from the events transpiring in Afghanistan. With banks closed, one of the few ways people can leave with life savings is to protect them in computer wallets in the cloud. Cryptos allow for transport on flash drives or access in other areas of the world via a secure password. Bitcoin, the leading cryptocurrency, posted gains over the past five consecutive weeks. The correction after the parabolic rally found a bottom. Flight capital is another reason supporting cryptos in a volatile world.
Levels to watch in crude oil
US energy policy remains bullish, despite the current correction in the crude oil futures market. OPEC and the Russians are not likely to cooperate with the Biden administration and heed the call for more output. They are more likely to cut production given the foreign policy tensions and signs of weakness in Afghanistan.
The NYMEX crude oil’s weekly chart shows support levels at $61.56, $57.25, and $33.64 per barrel. As crude oil is heading towards the end of the driving season, delta variant cases are rising, and the US and Chinese economies are slowing, a deeper correction is possible. Meanwhile, with OPEC+ back in control of the marginal oil barrel, the medium and long-term prospects for the energy commodity remain bullish. I expect higher highs in crude oil in 2022 and beyond.
US energy policy towards a greener path will change the oil market’s dynamics over the coming decades. Still, as petroleum continues to power the world in the medium term, the move to protecting the planet will lift oil’s price and fill OPEC+’s pockets over the coming years. I am short crude oil from a trend-following perspective, but US energy policy is likely to cause the fossil fuel to find a bottom at a higher level over the coming weeks. Follow those trends, they are your only friends.
-----
Use the link below to sign up for free early access to articles.
Trading advice given in this communication, if any, is based on information taken from trades and statistical services and other sources that we believe are reliable. The author does not guarantee that such information is accurate or complete and it should not be relied upon as such. Trading advice reflects the author’s good faith judgment at a specific time and is subject to change without notice. There is no guarantee that the advice the author provides will result in profitable trades. There is risk of loss in all futures and options trading. Any investment involves substantial risks, including, but not limited to, pricing volatility , inadequate liquidity, and the potential complete loss of principal. This article does not in any way constitute an offer or solicitation of an offer to buy or sell any investment, security, or commodity discussed herein, or any security in any jurisdiction in which such an offer would be unlawful under the securities laws of such jurisdiction.

Gold in a Double Top Setup with a Target of 1720Trend Analysis
The main view of this trade idea is on the 15-Min Chart. The precious metal Gold is currently exhibiting a double top pattern setup, with the resistance area around the 1795 price level. The metal is currently testing 1780 support. If support holds, it may be temporary and the metal will find resistance around the downward trend line highlighted in red. If support breaks, it is expected that the trend reversal will continue, taking Gold towards 1720. Failure of this pattern would be observed if the precious metal breaks above 1800.
Technical Indicators
Currently Gold is trading below its short (25-MA), medium (75-MA) and long (200-MA) fractal moving averages. The key identifier in the change in trend is the break below the 200-MA. The RSI is also trading below 50 as the metal tests support. The longer timeframed KST is also in a negative zone, which is bearish for Gold.
Recommendation
The recommendation will be to go short at market. Stop loss will be set around the 1800 price level and a target of 1720. This produces a risk-reward ratio of 3.69.
Disclaimer
The views expressed are mine and do not represent the views of my employers and business partners. Persons acting on these recommendations are doing so at their own risk. These recommendations are not a solicitation to buy or to sell but are for purely discussion purposes. At the time publishing, I have a position in Gold.

SILVER Buy Signals on D1 timeframe.Silver,D1: Support level + Bollinger bands + Hammer + Oversold + Correction

Gold - Analysis of 7/28/2021The Algotrading Multiday system is: short from July 16, 2021 from $ 1815
position performance: 1.11%
YTD performance: 10.04%
1 year performance: 12.13%
At the end of the day: maintain position
Number of transactions closed in the last year : 24
Average profit / loss per trade last year: 0.51%
Trade in gain percentage last year: 58.33%
Trade in loss percentage last year: 41.67%
Graphic Analysis
Sentiment remains bearish today as well.
I maintain the same objectives: first tp 1790 and second tp 1775
Supports:
$ 1790
$ 1750
Resistors:
$ 1802
EMA 200 ($ 1808)
I recommend observing, discussing, Like if you like, but as always, always use your head for operations !!

Corn Futures Expected to Move Lower Towards 563'4Disclaimer
The views expressed are mine and do not represent the views of my employers and business partners. Persons acting on these recommendations are doing so at their own risk. These recommendations are not a solicitation to buy or to sell but are for purely discussion purposes. At the time publishing, I have a position in Corn Futures ( ZC1!).
Trend Analysis
The main view of this trade idea is on the 2-Hour chart. ZC1! Hit some resistance around the 572’2 price level and is expected to move lower in the short term. This resistance is a lower high on the commodity and is expected to make another leg lower.
Technical Indicators
ZC1! is currently above its short (25-SMA), medium (75-SMA) and fractal moving averages. This price increase appears to be a counter trend move of an overall decline in the commodity. The RSI was overbought and is now trending lower towards the 50 level. Moreover, the KST is also displaying negative divergence as the indicator had a negative crossover.
Recommendation
The recommendation will be to go short at market. At the time of publishing ZC1! is trading around 563’4. The short- term target price is observed around the 548’6 price level, towards the medium term SMA. A stop loss is set at 572’2. This produces a risk reward ratio of 1.56.

Natural Gas Heading Towards 3.20Disclaimer
The views expressed are mine and do not represent the views of my employers and business partners. Persons acting on these recommendations are doing so at their own risk. These recommendations are not a solicitation to buy or to sell but are for purely discussion purposes. At the time publishing, I have a position in Natural Gas.
Trend Analysis
The main view of this trade idea is on the 2-Hour chart. Natural Gas has been in a rangebound or rectangular trading pattern since the end of June and is currently making another move lower towards 3.50 support. The key move will be a breakdown from support which will take the commodity towards 3.20.
Technical Indicators
Natural Gas is currently below its short (25-SMA), medium (75-SMA) and fractal moving averages and its RSI is trading below 50, heading towards oversold levels. Moreover, the KST is in a bearish move .
Recommendation
The recommendation will be to go short at market. At the time of publishing Natural Gas is trading around 3.61. The medium-term target price is observed around the 3.2 price level. A stop loss is set at 3.85. This produces a risk reward ratio of 1.77.

GOLD ANALYSIS!!! Hi Everyone, GOLD price reversed 1750.00 USD on 1D chart, level 1.618 of Harmonic XABCD pattern. On daily chart its bullish & can go 1885.00 USD which is weekly resistance & daily support 1750.00 USD if breaks can go 1675.00 USD.
WEEKLY SUPPORT & RESISTANCE.
On weekly chart GOLD price is downtrend, support 1675.00 USD & resistance 2080.00 USD. TVC:GOLD

XAUUSD : Correction Complete and bullish continuationHi... my bad this is my 1st video Analysis....
following are the things to look for on Gold....
Impulse 5 Wave is complete.
Correction 3 Wave @61.8 Fib
Wave 1 & 2 of the Higher Degree complete @61.8 if break below 61.8 expect 78.6 ten from there you can Buy Gold.
For our Bullish Bias wait for a break above 1791.62 to if you dont want to Buy @ the Current price as we are expecting the creation of Wave 3 to the top

Are we entering a commodity super-cycle?Definition of a commodity super-cycle:
Commodity super cycles are decade-long periods in which commodities trade above their long-term price trend.
Technical Analysis:
Using a weekly candlestick to see the bigger picture.
DBC is breaking out of a 10 year long downtrend.
On Balance Volume is supportive, as it is also breaking higher, reaching levels from a decade before.
We are breaking and testing $18.5, which is a very long-term resistance; now potentially turning into support.
This is a long-term setup.
R1, R2 and R3 are potential targets to take some profits.
Fundamental factors:
Weakening dollar
Supportive central banks
Fiscal stimulus geared for infrastructure spending
Pent-up demand once as global economies re-open.
Government and private companies increasingly pledging carbon reduction measures.
Inflation ticking higher, as the Fed is taking a new approach of waiting, rather than anticipating, as it has done in the past.

NatGas: What Goes Around Comes Around Although the NatGas price sharply dropped, we expect it to further rise until we are closer to $3.316. From there, we expect a longer corrective movement to dominate until around $2.187. After that, we should experience rising prices again that lead us over $3.800.
Stay trading!

Silver: Turning Point? 🔀🔀🔀We have reached the area around $28.935, where we expected the silver price to turn and move down South. If the price stays below that threshold there is no reason for us to change that expectation, though above that mark we would adjust the probability of the alternative scenario to 45%. In the longer run, we expect the silver price to fall below $24.04.
Want more? Follow us!

WTI - RANGE BOUND!WTI - RANGE BOUND!
Commodities overall since last yr are on a rise as seen on commodity index, I mean look at lumber and various others the % of return has been great and this has been increasing due to inflation, lower dollar etc.
For now WTI - We are still within the range technically.
Pattern: Pennant
Support: 62.62, 60.30, 59.15, 57.20, 55.40
Resistance: 67.15, 69.75, 72.65, 75.15
A break to either direction for further clarification, the key trendline up staying above the bulls are still in control if we break below trendline up bears may start coming in.
Trade Journal
(Just a trade idea, not a recommendation)

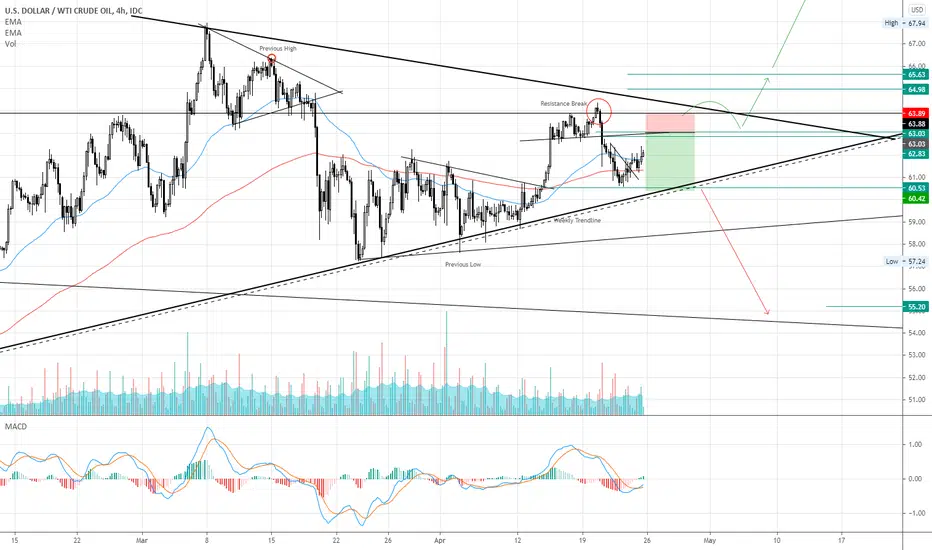
Long Oil Trade! After a false break above the trendline, still, I was anticipating a move lower and perhaps a retest of the bottom trendline for a short entry... that didn't happen and so, we missed out. However, as we inch closer to fill the Shaven Head Candle which is marked on the chart, that same level is also a strong support level - hence the long trade to.. as you might guess, to fill a Shaven Head Candle at 62.83.
Happy Trading folks!
Cheers!

WTI Crude Oil - The Bigger Picture 👀There's a great chance that we would see higher prices on Crude Oil and for two reasons only... technically!
1. $63.90 level was taken out which opens up room to go higher.
2. Crude Oil... yes we just discovered this recently, it had broken above the Monthly Down Trendline awaiting a possible retest before a move higher.
So yes, that's the bigger picture.. at least it's what I see anyway! 😊
Happy Trading folks!
Cheers!
GOLD Close To Breaking Key Resistance at 1765- Strong momentum play
- Double bottom higher high
- Confirmation can be found on the breakout
- Allow to pull back
- Enter at support level
PLEASE SEE ACCURATE RELATED ANALYSIS

Gold on Weekly - C&H on monthly - 50% FIbo test - BullishThe weekly chart show a nice descending wedge which can form the Handle For the Huge Cup and Handle since 2012.
last Friday, GOld touch 50% on Monthly to rebound there. This bullish wolf, seems valid for a rebund to 2100 or more

Gold: Hard Work 🛠🛠🛠It hasn’t been easy for the bulls in the gold market to defend the upward movement, as the bears were able to pull the price back down around the crucial mark at $1742. In order for our primary scenario to stay intact, we need the bulls to push for another run to reach $1782. From there, we should see a small correction before additional increases in the price.
What would you like to see us analyze next?

Brent Crude: Great Potential 💯💯💯Although it does not seem like there is much to see in this chart, we actually expect the British crude oil to perform very well over the next couple of months. In the imminent course of action, we believe that the price will slightly increase and then move on to complete the correction under $59.04. From there, we will be all set to experience a long bullish run in the direction of $80 and above!
Also, check out our other forecasts!
