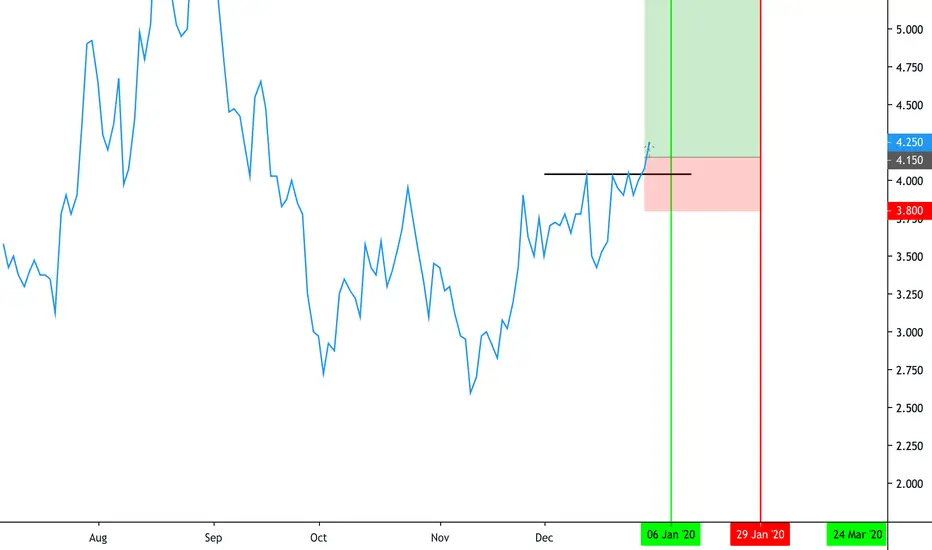
LEZ2020-LEQ2020 - Spread on Live CattleLEZ2020-LEQ2020
Breakout of the resistance level on this inversion pattern in the Spread between the two futures contracts on Live Cattle.
The parameters respect our strategy and we are approaching the seasonal window that statistically ends on January 29th with 93% of chances to get profit from it.
Commoditytrading
ORBEX: Gold Impulsive Upside Could Lead to Triple Combo!Gold's upside move could end shortly, forming an intervening wave x that could be followed by either an ending zig-zag or an ending triangle pattern.
The successful correction could turn the current structure into a triple combination!
Look for potential invalidation above 1519/oz.
Trade safe
Stavros Tousios
Head of Investment Research
Orbex
This analysis is provided as general market commentary and does not constitute investment advice

UUUU - A Levered Play on the Uranium MarketThe bear market of spot Uranium has dragged down the price of the subsequent uranium miner stocks, including UUUU . This stock in particular experienced a very steep mark down period during the time of the Fukushima reactor meltdown. This event left a bad taste in the mouth and as a result, many stepped away from using nuclear energy to the same extent to meet energy demand.
In 2016, we saw a 'base' establish for the stock right around $1.35. As the market structure stands, this is the bottom end of our accumulation range. The upper end of this range is at about $2.35.
Mid-2018, we saw a market expansion take place as price tested the upper end of our range, and surpass it. When price exceeded $2.35, a lot of attention and capital started to flow into the Uranium market, the market makers unloaded shares for about a year, then sent price back down into our accumulation range.
Today we are seeing a lot of choppiness, as bulls and bears battle it out.
Overall, I see a lot of room for growth in this sector, especially during a time of clean energy promotion. I believe nuclear energy will be the answer to the demand for clean energy.
I have a price target of $5.28 by 2022. An entry at $1.35 would give an incredible R/R of 3.94/0.0064. An upside of 400% and a downside of about 10% if market structure breaks.
Beware of the volatility, and search for a safe entry.

XAUUSD: Buy opportunity on an RSI signal.Gold is consolidating on the 4H chart (ADX = 22.401, CCI = -23.5777) following Wednesday's 1,484 High. This is directly linked with the Nonfarm Payrolls as the market is ranging in anticipation of what the report will show.
However even from a technical perspective this pattern has been previously formed within the very same Channel Up we've been trading in since the November 12 low. See the identical price ranges from lows to highs. Based on the bearish RSI we anticipate a pull back towards the 4H MA50, a level which should attract medium term buyers again. Our Targer Zone is 1,490.90 - 1,494.50.
** If you like our free content follow our profile (www.tradingview.com) to get more daily ideas. **
Comments and likes are greatly appreciated.

SOYBEANS (SOYBN/USD)A nice rising wedge pattern is forming on this chart. It would be wise to enter a short on the break of the counter trendline on the weekly chart. The market is largely in a bearish move that can be maintained if enough sellers creep in.

My Sentiments on XAU/USDThe Commodity has broken the 1494 - 1484 S/R zone, A highly volatile economic week being the main factor driving the commodity down and could continue down significantly..
Technical analysis :
1. Pin Bar formed on the D chart (25/10/19) signaling market rejection of the 1517 - 1513 price range, previous rejections making it a strong resistance zone
2. Price retraced to the 1517 - 1513 zone providing a good entry zone down.
Current price is at a strong support zone and were anticipating a pull back up to the 1493 - 1473 zone
This is a possible short buy opportunity as we look for the bear trend to continue.

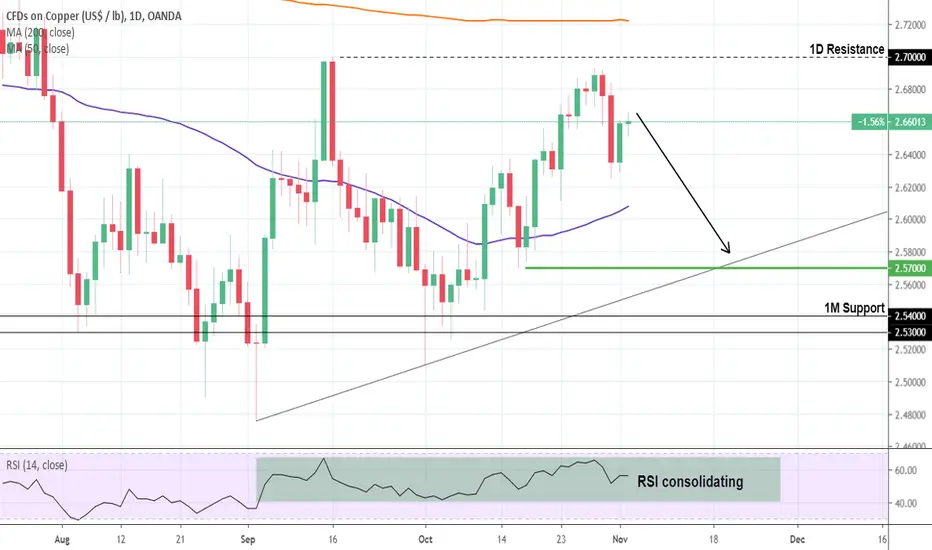
Copper: Short opportunity within an Ascending Triangle.Copper (XCUUSD) is trading within a 1D Ascending Triangle (RSI = 56.277, MACD = 0.016, Highs/Lows = 0.0000). Last week it was rejected on the 2.7000 1D Resistance and that should make it test at least the 1D MA50 (blue line). In our opinion since the RSI has been consolidating in the past 2 months, the potential pull back can make a Higher Low on the 1D Ascending Triangle so our Target is lower at 2.57000.
** If you like our free content follow our profile (www.tradingview.com) to get more daily ideas. **
Comments and likes are greatly appreciated.
Silver (XAGUSD): Bullish pattern spotted.Silver (XAGUSD) is trading within a newly emerged Channel Up on the 1D chart (RSI = 60.617, MACD = 0.050, Highs/Lows = 0.2338) following the October 1st bottom just above the 1D Support Zone.
Both the 1D candle action and the RSI sequence resembles and October/ November 2018 fractal which delivered a strong rise once the Channel Up broke. Our advice is to take a careful long approach towards 19.000 - 19.500 moving the stop loss on the Higher Low of the Channel each time to limit the potential loss while keeping a maximum gain perspective.
Check out also how we expect its relationship with Gold to trade:
** If you like our free content follow our profile (www.tradingview.com) to get more daily ideas. **
Comments and likes are greatly appreciated.

Platinum (XPTUSD): Bullish Megaphone towards a new Higher High.Platinum posted a strong rebound on the 871.00 October 2nd low and is currently rising on 1D (RSI = 62.934, MACD = 2.660, Highs/Lows = 16.6714) towards a new Higher High. The Higher High is designated by the 1M Megaphone pattern it has been trading within since August 2018. The 1D RSI patterns suggest that a new bullish leg may start without needing to make a Higher Low. Our Target Zone is 1,020 - 1,040.
Keep in mind that XPTUSD has just initiated its new multiyear Bull Cycle, and we consider it a top investment in the coming years, a matter we analyzed on our long term analysis below:
** If you like our free content follow our profile (www.tradingview.com) to get more daily ideas. **
Comments and likes are greatly appreciated.

Silver is gaining about 2% this week 25-10-2019Silver prices rose more than 2% in the European market on Friday, extending its gains for the second day in a row, its highest level in four weeks, to achieve the biggest weekly gain since last August, supported by the rise of most industrial metals after the strong manufacturing companies achieved strong profits during the quarter The third of this year, next to the rise of safe investment assets.

Gold Bulls are building as they stubbornly hold their groundGold has been holding a BidZone around 1480 on the spot price for a while and looks set to make a run to the highs. Safe haven buyers have been stubbornly holding the zone and not getting flustered by the moves in the stock market and buoyant Trump tweets on trade. The key level is now 1498 and a break of this level should signal to bulls that the move is on. Watching for a shoulder for the entry setup.

Gold tests upper range boundaryGold is testing the upper range boundary. Resistance above comes in for of 1500 handle and 4hr bollinger band. We are looking at short entries from around 1494.00.

KEN2020-KEK2020 - Commodity Spread on Coffee FuturesKEN2020-KEK2020
Rising triangle in formation on this spread between two wheat futures contracts.
Statistically, in the previous 15 years of our seasonal window we have come to profit in 100% of cases with an average risk reward of 3:1.
With this strategy we started trading years ago, bringing us considerable profits that made us understand that operating in the financial markets was an incredible potential source of income if done with professionalism and discipline.

US Oil Head and Shoulders/Bottoming PatternThis is a 2 hour chart of US Oil. I zoomed out a bit because I want you to see this support/flip zone we are at. Provides more confluence. Of course, you can easily see this on the daily and other longer term charts.
We bounced from this zone and it seems we have exhausted the downtrend made up of lower highs and lower lows.
Currently, we may have made our first higher low which requires a higher high to confirm. We appear to be in this process.
I am waiting for the break and close above 53.30 which is also a flip zone and is a neckline for the head and shoulders we have. 55.00 would be our first target zone.
Let's take a look at UK Oil too:
I would say the similar criteria is being met, but the flip zone we want to see break is the 59.30 zone.
Oil is interesting and I spoke about the geopolitics in a previous post. Oil is key for Russia and China in attacking US Dollar Demand and Iran is key for them. Linked below.
However, I believe we are going into a recession (or maybe already in one) and oil will be suffering. I outlined this in my Aramco oil post.
Everyone knows about repo. How the Fed is now once again expanding their balance sheet. Stimulus is coming. We are not in free markets anymore and banks require capital and need to be propped up. In the last oil downturn, governments forced banks to loan to suffering oil companies. These oil companies could not fall due to employment. This means that a lot of banks have loaned money to oil companies that they know will never pay back. Zombie companies.
Oil for this reason needs to be propped up. This is the world and environment we are in as we head into the confidence crisis and closer to big government. Everything needs to be managed because banks will fail, pensions and retirements will fail (make money when stocks go up only).

Platinum (XPTUSD): Lower Buy Opportunity.XPTUSD has been on a very strong rise in late August almost hitting the 1,020 - 1,045 1M Resistance Zone. Despite trading on bullish 1W technical values (RSI = 64.131, MACD = 26.660, Highs/Lows = 45.6178), the volatility itself is high enough (ATR = 41.0321) to justify a pull back to the 1D Support (890).
This is where we expect Platinum to seek buyers as long as the 1W MA50 (blue line) provides support. Once this pull back is completed we will aim again for the 1,020 - 1,045 Resistance Zone.
** If you like our free content follow our profile (www.tradingview.com) to get more daily ideas. **
Comments and likes are greatly appreciated.

Oil Technical AnalysisI have not viewed oil in ages so am fresh with this one,current chart trend indicates a further push to the top before finding some true resistance after which a breech of the support trendline is needed to confirm a sell off.

SILVER: New bull cycle or just a Lower High? See what to expect.A lot of discussion is going around on whether or not Silver has enter a new long term Bull Cycle. We are not against this possibility. But we thought it is useful to analyze also the scenario where XAGUSD is only on its way to a Lower High before diving even more on the long term and continue its multi year Bear Cycle.
On the three charts you see the current price action on the 1W time frame followed by Patter A which shows the price action mostly in the 1980s when Silver was still in the Bear Cycle, making only a Lower High and then Pattern B which shows the late 1990s - early 2000s when Silver broke into its last Bull Cycle.
All charts share some similar sequences: Peak (Lower High) on the Red Arrow Down, followed by a Channel Down (orange shape) and then accumulation after the bottom (eclipse shape). What followed in all charts is a very aggressive (non-stop) bullish 1W candle streak. What separates the patterns though and is the key in determining which phase Silver is currently at is the Golden Cross formation.
On Pattern A it took place after the aggressive rise made a peak (Lower High) and then Silver extended the Bear Cycle.
On Pattern B the Golden Cross took place before the aggressive rise made a peak. Then the price pulled back to the MA50, which held and supported Silver as it started its new Bull Cycle.
We have to say that on these terms, the current price action resembles Pattern A more, as the Golden Cross hasn't taken place yet. However it is not at all impossible to be replicating Pattern B as Silver may continue this parabolic rise so aggressively and make the Golden Cross on much higher levels.
We therefore would suggest investors to take a wait-and-see action and observe how the candle action will affect the MA periods.
* If the price currently pulls back and tests the MA200 then we are most likely still within the Bear Cycle and Silver will extend the downtrend.
* If it rises more and then pulls back to test the MA50 then we will most likely be starting a near Bull Cycle and investors can more safely enter into a long term trade.
We will be analyzing Silver on a more regular short/ medium term basis so stay tuned for more trading set-ups.
** If you like our free content follow our profile (www.tradingview.com) to get more daily ideas. **
Comments and likes are greatly appreciated.

XAUUSD: Long opportunity as the MA200 approaches.Gold is being aggressively sold this week with favorable news on the U.S. - China trade war negotiations acting as the catalyst. Technically it is a rejection on the 1,555 Double Top. The price action is identical with the June- July sequence, when Gold again looked for a final support on the 4H MA200 before starting the next strong rise (orange channel).
At the moment the price is getting close to that 4H MA200 test with very high probabilities of finding again a Support. With 1D neutral (RSI = 53.911, STOCH = 54.738, Highs/Lows = 0.0000), this is the most optimal short term buy level towards at least the 1,555 Top if not a Higher High (as it may again start a new strong rise).
** If you like our free content follow our profile (www.tradingview.com) to get more daily ideas. **
Comments and likes are greatly appreciated.

ZWZ2019-ZSX2019 - Commodity Spread TradingZWZ2019-ZSX2019
Wheat December 2019 - Soya November 2019
Interesting spread between the December futures contract of Wheat and the November contract of Soya.
As it is statistically deduced from our software, in this case the Moore Research, we have a percentage equal to 87% in which this difference is reduced, and therefore, a normal convergence of the two values of the contracts that bring their distance closer to 0 rather than move it away.
The very nice thing about this type of operation is the reduction of the volatility that can cause sometimes big problems. For example if on the soya there should be some important news its value could vary suddenly and the grain, being a correlated of it, would follow it consequently and it is for this reason that through the Spread Trading these potential unexpected problems are avoided.
www.mrci.com

spread wheat vs corn 07:49 29-Aug-19. ADDING SOME MORE..LOG
spread wheat vs corn 07:49 29-Aug-19
I spread trade WHEAT versus CORN.
I follow more or less -
Keith Schap – The Complete Guide to Spread Trading
The guy who spreads and makes a little every day is the one who walks away with
the big money.
–A veteran trader, quoted in Futures
Every time i enter a trade in WHEAT i enter a trade in CORN with the same amount of units.
Trade accordingly your account size.
The trades can last hours, days or weeks.
Patience and discipline and money management. I will not lose more than 5% of the equity.
I can trade every hour or other.
Intercommodity Spread
The Intercommodity Spread is a spread between two different commodities, but in the same delivery month. Often this spread will set-up according to seasonality or occasionally a harvest supply/demand picture.
The Corn-Wheat Spread
The Intercommodity Spread is our focus for today! Specifically, we will analyze
the merits of the Corn-Wheat Spread going into the 1st and 2nd quarter of 2011.
This is a trade that I have monitored since the 80’s. I believe that it was first
notable in the mid 60’s. The beauty of taking a classic trade and reviewing the trends
and history of the trade saves time in research and previous observations may even save
money on potential variances to watch for. In this particular spread, we note that July
may be a strong month for corn as the weather conditions, plantings acreage, export numbers may still be unknown. The crop is still vulnerable until toward harvest which is in the fall. On the other hand, the harvest for the soft red winter wheat may be in July, allowing the market to regard the saturation of a harvested crop. One may look at the months; March, July and September contracts for this particular spread trade and select another, but this is the anatomy of the spread, not to be confused with a trade recommendation. As a matter of fact, this spread may be reversed at another time of the year. June may be a time frame to review the Wheat-Corn Spread. These grains are both feed product and may also be affected by livestock production trends, global supply-demand figures, weather conditions and basis for the farmer. The wheat is typically a heavier protein cereal, while corn does not vary to the extreme. In modern times patents on the seeds of varied grains has become big business. The USDA regulates the delivery, grades and contract size regular for delivery. The seeds and
fertilizers must also endure disease and pests. There are Government Subsidy programs
as well in some cases to control the crops being planted. In recent times, Africa has
been know to lease land for crops to fulfill some of their required grain inventories
in countries such as China.
Technically, it is good to pull up a spread chart to monitor the merit of the potential
move. One may select their Indicators to best confirm an entry.
There is no audio in my videos.
This is a demo ac. I have a real ac with oanda.

spread wheat vs corn 12:51 21-Aug-19.LOG
spread wheat vs corn 12:51 21-Aug-19
There is no audio in my videos.
This is a demo ac.
I have a real ac with oanda.
I spread trade WHEAT versus CORN.
I follow more or less -
Keith Schap – The Complete Guide to Spread Trading
The guy who spreads and makes a little every day is the one who walks away with
the big money.
–A veteran trader, quoted in Futures
Every time i enter a trade in WHEAT i enter a trade in CORN with the same amount of units.
Trade accordingly your account size.
The trades can last hours, days or weeks.
Patience and discipline and money management. I will not lose more than 5% of the equity.
I can trade every hour or other.

Gold need more correction to go upside.Since the last FOMC meeting, Gold FOREXCOM:XAUUSD is in 53$ long range. Currently trading between the technical blue resistance and support lines. As long as the Fed keeps the tone of cutting the interest rate, it is quite obvious for gold to spike up. But, from the technical point of view, the price needs correction to start the long run.
My buy orders will be in the green area.

Palladium sell signalsPalladium (PA), Weekly chart: Resistance zone + Pin bar/Shooting Star candle pattern + Extended divergence on RSI(14) + On Daily chart: Overbought + Divergence on RSI(14)
