Buy GoldGold finished its correction phase and is bullish after breaking last month's high 2387, retesting the channel's lower line at 2290, and breaking out of the small correction downtrend channel.
Gold is currently in an uptrend on the daily timeframe with the next target to a new all-time high and the upper channel at 2550-2600.
Commondities

⚡️Strifor || USDCAD-07/02/2024Preferred direction: SELL
Comment: In addition to the euro and pound , the priority for selling the US dollar also applies to other majors . In this case, we will analyze USDCAD . In the medium and short term, the instrument is looking down quite confidently; we do not rule out a potential small rollback upward, but the main mood is, of course, bearish. In this regard, we highlight two main scenarios. Level 1.34000 acts as a target here for both scenarios. Scenario №1 is more about a short-term login attempt, and scenario №2 is more medium-term. Of course, scenario №2 will be more conservative than scenario №1 . One may also consider two scenarios simultaneously using the method of gradually gaining a position.
Thank you for like and share your views!

USOIL : BUY WITH BREAKOUT AND RETEST STRATEGYHello Traders,
📈 Daily chart review :
- Affter a long moving in downtrend, in the present, price is near with strong support and has got many times want to pull up.
- Now, it is prepairing for a breakout of the downtrend
🎯In my trading opinion:
You can buy around 73-74 price zone and target is 80-81 zone.
📚 Remember that: Always follow your trading plan regarding entry, risk management, and trade management.
Good luck!

WEAT UpdateSlowly crushing all levels put out previously
There is absolutely nothing going against this trade:
1. Inflation is positive for the price
2. Logistics and all of the shipping BS is positive
3. Winter is coming...can harvest more supply until next year
4. What am I missing?
5. You know what happens after you put a claw like looking rounding bottom like this?
It is just getting started. Plenty of notice given.

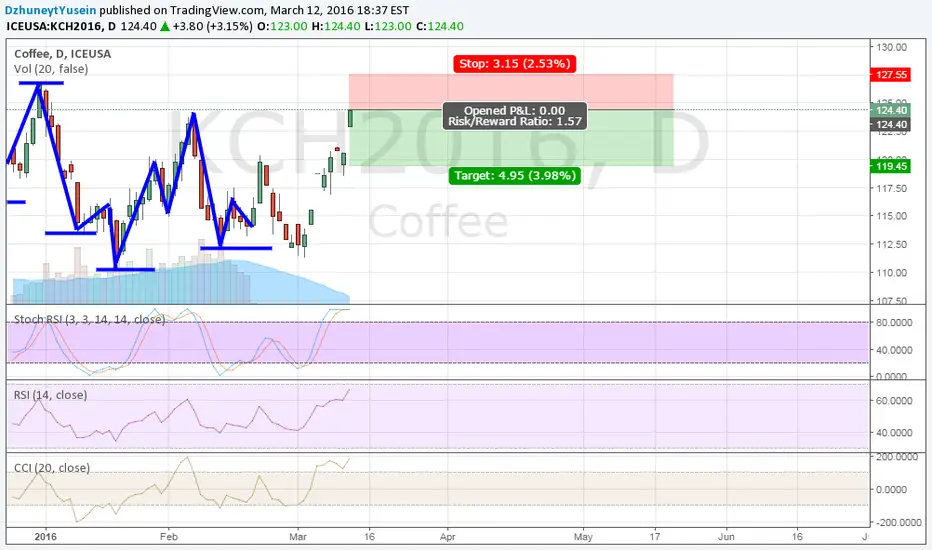
COFFEE - CUP AND HANDLE FORMING Interesting pattern forming in Coffee. After a long "Rounded Bottom" a Handle has emerged that looks to be consolidating. Will be interesting to watch in the coming days to see if this pattern can be sustained - macro support from weakening USD and supply side constraints will support continued momentum.

EURUSD FOREX MONEY MARKET TRADE SETUPS & SIGNALS For 9th Dec 219www.youtube.com
I Publish Daily chart updates on over 49 Assets including Forex pairs, Indices, Commodities, Metals, Cryptos and more. Watch them via the above link

Cotton Summer BUY ! 1.2 RRLooks like it has reached its bottom and reversal has just started. lets aim for Fibo retracement as target number 1

#Gold Report by MacroView Research 2.5.17Why gold is really moving higher....
Gold had another strong week following a more dovish stance from the Federal Reserve last Wednesday, leaving the the Fed funds rate <75 bps.
Moreover, gold futures were able to close above the key resistance level of $1,200 – a level last seen in November. The growing uncertainty of President Trump’s rhetoric and policy is surely adding to the speculation. In response to Trump and a dovish Fed, gold traders are adding up on $1,250 call options which volume increased 53 percent.
With that aside, an often overlooked indicator for gold trajectory is signaling further potential gains: real yields. Real yields surged following President Trump’s election win, catapulting from -32 bps to 31 bps on increasing inflation and growth prospects.
However, as MacroView predicted, gold would gain ground as the velocity of climbing interest rates and U.S. dollar slow following the anticipated 25 bps hike from the Federal Reserve.
Since hiking, real yields fell almost 50 percent of the post-election surge, declining to 2 bps from 31. In the same time, gold increased 8.9 percent v. 1.9 percent for the SPX.
We’re inclined to believe gold has further upside. According to Commitment of Traders report, on a 5-year percentile, institutional investors continue to unwind dollar positioning, while hedge funds are increasing.
Historically, the exiting of institutional investors has been a key indicator that the trend is ending. The move could be further exacerbated if hedge fund begin to unwind.
In regards to gold, money managers continue to increase their net-long positioning.
Key Weekly S/R Levels
S1: $1,209
S2: $1,189
R1: $1,226
R2: $1,248

#TrendFlex Platinum Alert [Free]Bull Signal on Platinum - XPTUSD
MacroView Research forecasts platinum prices to extend gains near-term vis-a-vis weaker U.S. dollar; a view we've had in mid-December.
Alert: $990
Thresholds: 959.47
Opportunity: 1053.29
Trade Mgmt: TP on 50% of position at $1,015; move threshold to breakeven
This is a free version of MacroView Research's TrendFlex alerts, a proprietary alert system for FICC and select ETFs. We will be opening up registration for new subscribers March 1. If interested contact us anytime.
We believe performance matters. If TrendFlex is red for two back-to-back quarters, we'll refund 50% of fees - an offer not found anywhere else.
Follow @Lemieux_26, @EconomicHedge and @Macro_View on TWTR


Silver: Weekly Long OpportunitySimple technical analysis, when applied correctly and over long time frames can be incredibly effective at generating returns. Here we have a Gann Fan with three simple levels 1/2, 1/1, and 2/1. The market has reacted well with the fan thus far. This could be an indication that the market will also react will with the 2/1 trendline. In addition Silver is sitting on a Support/ Resistance level that has been tested numerous times over the past year or so. First take profit will be at around the 18.50 area, which is the next significant support/resistance level.
Please leave your thoughts, comments and a like if you enjoyed this post.
Happy trading and may the market move in your favor!

Platinum at key levelPlatinum "broke" its down trend recently, but it had a dramatic 2 day pullback to the base of the breakout. It is unclear whether the recent upswing was just a mildly longer pullback (see figure for pullback amounts) which will result in another drop in price or whether this is profit taking from the recent upswing.
A break below 930 indicates a continuation of the downtrend. A bounce off the 943 level indicates a new uptrend. These are confirmation signals, but what if you want to enter the trade sooner? See below.
What type of trader are you?
1. The 976 level could be a "loose" neckline (it could be drawn lower of course) to a head and shoulders pattern that had an absurdly abbreviated right shoulder (excellent short signal!)
2. Since the breakout coincided with both the 200 day EMA and the previous low of the downtrend, there is expected to be hard resistance and a pullback before a solid breakout (go long!).

XAG/USD 15in: 15min. AGGRESSIVE supply zone shortit is solely based on 15min original supply zone..
non-support from higer time frames.
tp1: look just for 1:1

XAUUSD (This is the End my only friend - The End) Look what we've got based on Monthly descending bullish channel
1M: Bullish channel (not wedge) resistance sustained
1D-4h: Reverse price bar on 1D with DIAMOND TOP and H&S, SHS or Head & Shoulder figures formed on top for reverse and move the gold to new low
Some details and multiple timeframes charts would post later

Long term Copper Buying Opportunity High Grade Copper Futures have just met with a long term uptrend spanning back to 2003. Copper is oversold and a bounce off of this trendline indicates large potential long term future growth. Entering the market around 2.40 with take profits at 3.00, 4.00 and 5.00. Please don't hesitate to leave your thoughts and comments. Good luck to all and happy trading.

Wait for a Signal Recent downtrend in crude oil probably will countinue following months. It could not break the R1 level (0.63 level) and with the high chance it will get down to S2 level (lowest level in 2009) (strong support level in 0.76). Which will end up seeing perfect Gartley in R2.
You can trade with the structure levels or you can wait for R2
Good luck


Oil to break the channelThe last count failed, so i adjusted the count for a bigger corrective wave. Not the most beautiful count but looking at the price action, a top could be forming.

Short Coffee FuturesMarket is clearly over-bought! 1D, 4H, 1H and 30MIN graphs all show clear signs of short opportunity.
Coffee futures experience head and shoulders patterns and the next move is clearly downward. RSI and CCI have values of 66.8725 and 184.6364 which clearly indicates SHORT pattern.
Stoch RSI is 98.6 way over 80% mark which means over-bought market with no other way of going up.
CLEAR SHORT
CRUDE LONGThe reason why we feel CRUDE may Rise.
* On weekly basis it has just started moving up
* To Rise and come near 39.57 levels
* Stoch RSI (3,3,14,Close) is Rising.
* RSI (14,CLOSE) is Rising.
* CCI (20,CLOSE) is Sinking..
Keeping all the above indicators in view along with the chart pattern we expect it to Rise. Our Buy call shall be from Buy above :38.48 ,SL:38.20, Tgt 01: 39.25, Tgt 02: 39.57, Tgt 03: 40.54
The view expressed here is on weekly basis. [b ]Caution: The above is our personal view. Neither a recommendation nor a tip nor an advice for trade. Please consult your personal financial advisor before investing.

Heating your house with propane? Price to drop soon. Welp, Hank Hill would love this. Propane is no longer suffering through the warehousing problems that it did last year and much of the country has been experiencing a more milder winter than is usually experienced.
Proprane is seeing a decline, as it is a byproduct of both crude oil and natural gas production, and prices of both of these commodities are low at this time, and will be for the foreseeable future. Natural gas, being the more stable of the two as it is abundant in the United States and less prone to swings in price due to some of the more unpleasant geopolitical discourse.
After some quick technical analysis we see some Fibonacci ratio confluence that just happens to align with the 1.10 price point. (A 1.618 fib extension of the current bullish move and a 3.82 retracement of the preceding bearish impulse leg) Looking left, we see SOME congestion around the 1.10 handle but none that really serves as major structure out on the daily. Still, I am looking for a shorting opportunity once price rises to about 1.10, frontrunning orders slightly below to ensure a fill. Price at this time will succumb to selling pressure and will drop. We also see our RSI approaching an overbought condition if you use that oscillator. I think the current bullish move can only be a relief rally at this time.
Happy trading and stay warm my friends.

