COMP loading for new leg up!!!Cup and handle pattern forms on daily chart and 4hr chart . Could there be a $450 COMP loading?... like and comment let me know what you think
King Alaluna
COMP

COMP/USDT TRADE SETUP!Hello everyone, if you like the idea, do not forget to support with a like and follow.
Welcome to this COMP trade setup. COMP is a Defi coin and soon every single Defi token pumps hard. It broke out from the parallel channel. Buy now and add more in the dip.
Entry range:- $355-$368
Target1:- $388
Target2:- $414
Target3:- $426
Target4:- $452
SL:- $342
Leverage:- 3x-5x
If you like this idea then do support it with like and follow.
Also, share your views in the comment section.
This isn't financial advice. DYOR before investing.
Thank You!

COMP - new rocket 🚀🚀COMP is out of the accumulation zone. Additionally, the price tested this zone as support. These are good signals for growth. The price has now approached the trend line and in case of a breakdown could reach the first and second target quite quickly.
Write in the comments all your questions and instruments analysis of which you want to see.
Friends, push the like button, write a comment, and share with your mates - that would be the best THANK YOU.
P.S. I personally will open entry if the price will show it according to my strategy.
Always make your analysis before a trade.

COMP ready for launch. Been in since $340 at the 0.618 fib level
saw great resistance here and a perfect pullback for a slingshot to green box at $500.


$comp A correction to around $330 before breaking above the down trend line should take $comp to the next S/R levels as indicated


Compusdt long Compusdt is looking good about to break out and move above in ascending channel.
Targets 399 - 420 - 480
COMP - new rocket 🚀🚀Comp is a coin with good potential. A strong project on the fundamental analysis side. On the chart, the coin is in a trading range on the higher timeframes.
On the chart you can see that there is a large volume at the bottom when the lower boundary is tested, it is a bullish signal. A good buying opportunity. The first target is the upper limit of the trading range. The second target is the ATH.
Write in the comments all your questions and instruments analysis of which you want to see.
Friends, push the like button, write a comment, and share with your mates - that would be the best THANK YOU.
P.S. I personally will open entry if the price will show it according to my strategy.
Always make your analysis before a trade.

comp analysisComp has a strong support of 281$ and it ranging in a box of 281-230$ (so you can do future with tight stoploss ).
I am bullish in this coin—-
Compound (COMP) is an ERC-20 asset that empowers community governance of the Compound protocol; COMP token-holders and their delegates debate, propose, and vote on all changes to the protocol.
Its performance is best in past so we can see COMP soon to 520$
Quick scalpel area
Short term target
Long term target
All given in the chart👨🏻💻👨🏻💻

COMP - JUST BUY THIS COIN FOR X10 ✅🚀COMP is the leader in our crypto portfolio. A very promising coin from a fundamental analysis point of view. In a nutshell, Compound is a DeFi lending protocol that allows users to earn interest on their cryptocurrencies.
🔋If we analyze from technical analysis side, this coin has been in accumulation for two months already, and soon we expect exit from accumulation zone and strong impulse growth. But don't discard correction option, the price can go down to support zone, which is marked below.
We bought this coin on the 26th of October at 318$ in the long accumulation zone for 5% of our total equity. This is one of our medium-term positions. We expect a potential of 500% to 1000%.
And of course don't forget to subscribe to our tradingview and other platforms, leave the name of the coin you want us to analyse in the comments. 💚

COMP|USDTHey hey my friends👋
We are adding more comp to our bags here, only a matter of time before she goes!

$COMP, Something to watch$COMP
Something to watch as its trying to break from a long descending trendline
#COMP

Long Comp! Get 300% return!Hi, everybody
We think comp has great potential. Comp will rise at any time, and buying and holding will have huge benefits.
But now I don't think comp will rise too much.
buy zone:330-300
SL:280
target1:374
target2:430

COMPOUND CAN BECOME A TOP COIN IN NOVEMBER! THE EXPLODE START!✅Coin view shines the light on Compound Mars the Rank #70 on cryptomarket.
Expecting depending on trend study that Compound can show a 100% increase at long term, even into short possible where it will become the TOP NOVEMBER COIN-OR EVEN THE YEAR COIN
💎With this coin view update we expect a price action target with this coin that is listed on kucoin exchange and more exchanges.
☕️and of course, you never invest all in. I mean when you invest a coin with small price action as this for the long term, do it only with what you can lose.
📈You will see coming time more updates about this coin, this is the start from coin view expecting.
# ALSO THE COIN VIEW have choice this coin as one of the best coins.
Have a great day!

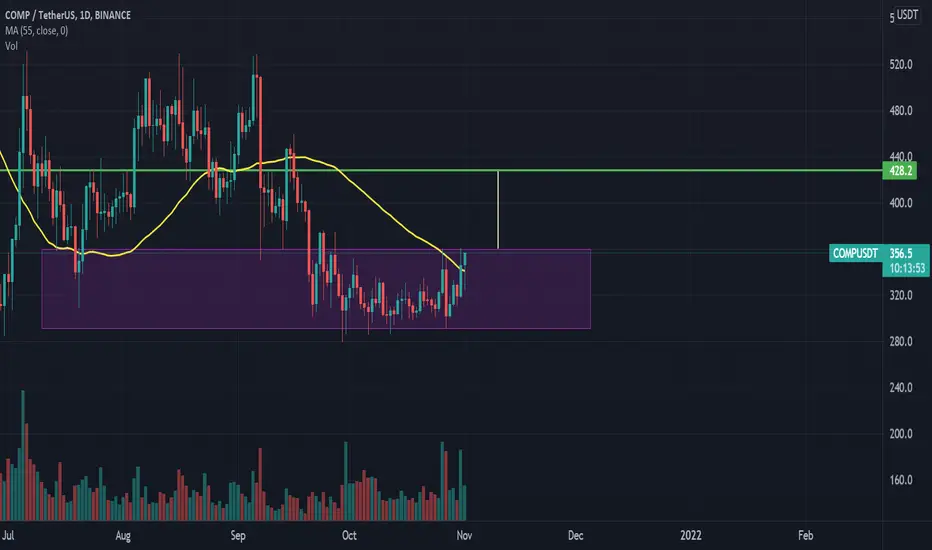
COMP pushing out of consolidation zone.COMP has broken out of a month-long consolidation period and major demand zone between 323 and 300. On the daily chart we can see MACD about to crossover to the bullish side as well as a +50 RSI pointing upwards. Volume Accumulation Percentage Indicator has now moved to positive signalling that market participants are buying into this breakout. I expect a move towards the 0.5 fib ($400). Further than this could see us hit the 0.718 fib which coincides with a strong supply zone at $480 dollars. Comp is a slow mover so I expect this to take several days unless there is sufficient volume.

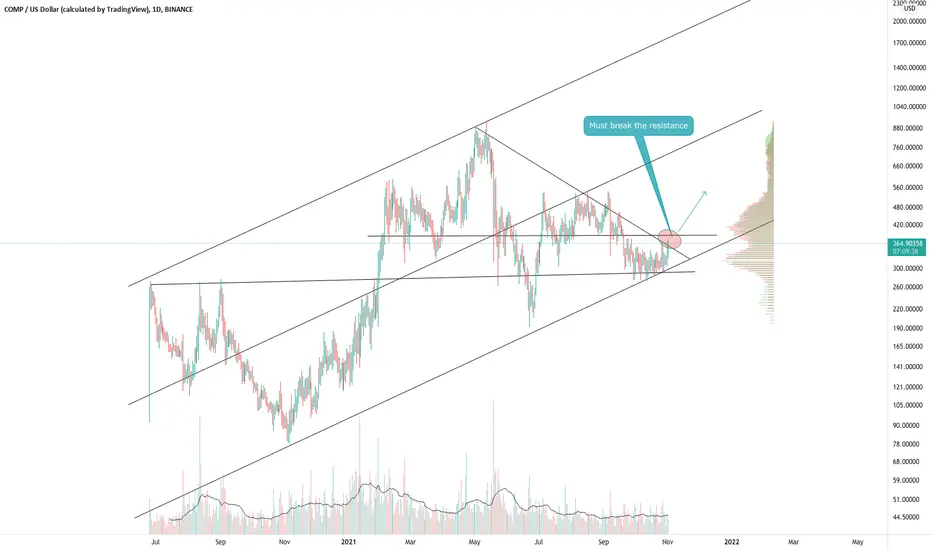
COMP - must break the resistanceCOMP - must break the resistance and after if make a pullback it s more better
COMP target $600Gorgeous setup on COMP, DEFI as a sector is still lagging BTC (has room for outperformance), and COMP in particular looks ridiculously coiled. Check out that RSI :). LONG AF

According to the weekly chart,there may be a sale from 360or370After breaking the 340 resistance, a sale can be made , rise and fall again every two or three days

CompUSDT respected major channelCompusdt is working nicely through the support, stay consilidet for long time ready to fly after breaking the trendline,,

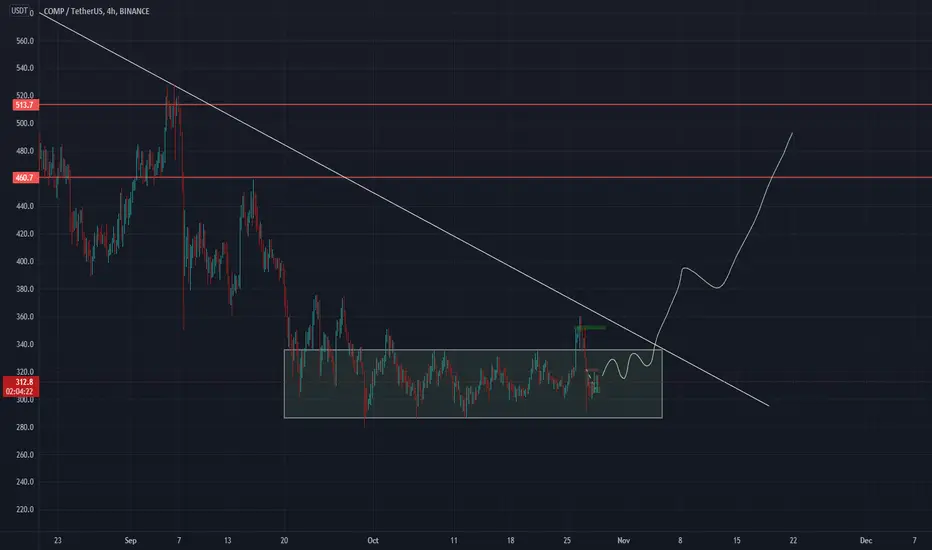
COMP USDT 4Hcomp usdt is back in range and gave us a second chance to buy low best time to buy on spot to be safe!!
no financial advice just a idea ;)
COMP USDT new entrycomp usdt touched the support really fast and im still in the trade there is still time to join
no financial advice use risk management!!

COMP - new rocket 🚀🚀If you look at the technical analysis side, COMP looks very good.
The price has been in accumulation for a long time while getting closer and closer to the trend line. After yesterday's fall, the price has recovered very quickly, also we should note the appearance of more volume at the bottom. This is a good signal for growth. A breakdown of the trend line might be a good buying opportunity.
Write in the comments all your questions and instruments analysis of which you want to see.
Friends, push the like button, write a comment, and share with your mates - that would be the best THANK YOU.
P.S. I personally will open entry if the price will show it according to my strategy.
Always make your analysis before a trade.
