COMPUSDTRetest is done ! let pump it !!!
comp is retesting and will follow alt coins hopefully to reach high target .
buy between 332-340 .
note ! not a financial Advice !
COMP

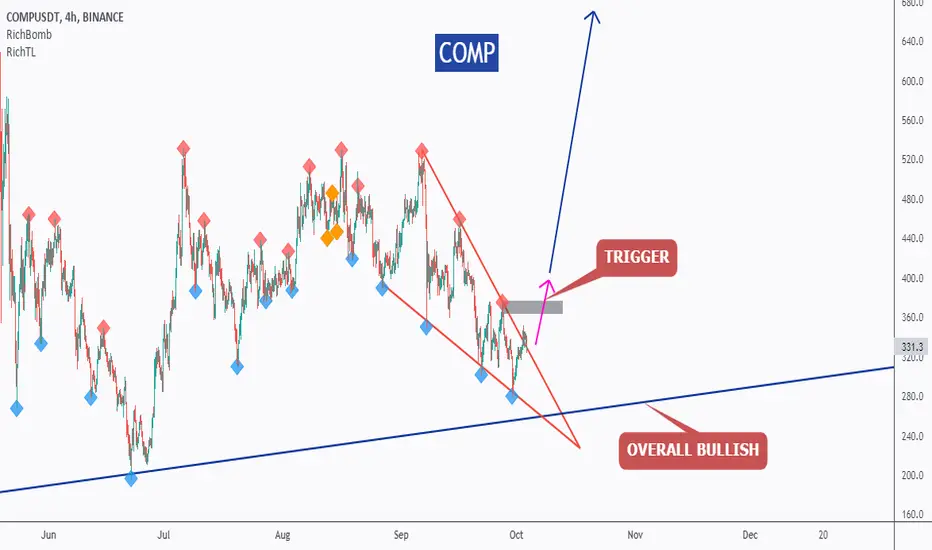
COMP - Wait For The Trigger!Hello everyone, if you like the idea, do not forget to support with a like and follow.
COMP is overall bullish and now approaching the blue trendline from Daily acting as a non-horizontal support, so we will be looking for buy setups.
on H4: COMP is formed a wedge pattern in red but it is not ready to go yet.
Before we buy, we want the bulls to take control.
Trigger => Waiting for a momentum candle close above the last swing high to buy (gray area)
Meanwhile, until the buy is activated, COMP would be overall bearish can still trade lower.
Good luck!
All Strategies Are Good; If Managed Properly!
~Rich
Comp Long SetupIt's pure price action and easy to understand.
Disclaimer: It's not a signal it's an idea, open positions by your own responsibility

Q4 is here! Lets trade some ALTs! Here's a quick Look at COMP 8 hr chart. As we can see, the price has been forming a bigger falling wedge and we could see a break to the upside soon! Definitely one to keep an eye on. October is believed to be bullish according to S2F model and historically!
The best entry would be, when the price breaks above the falling wedge with good amount of volume .
-------------------------------------------
The idea is: Buy the breakout from the falling wedge and take profits at the levels shown in the chart.
Targets:
- Profits can be taken in the resistance zone .
1. 359$
2. 427$
3. 452$
-------------------------------------------
If you like the content, then make sure to comment and like the post :D
Follow me for daily profitable trading setups
BTC dictates the market. If BTC falls, then Alts will fall as well. Trade safe!

🆓Compound (COMP) Sep-28 #COMP $COMPThe selling force on COMP is dominated so in next days, it could fall down sharply to 260$ from this 340$ zone. The 260$ zone is quite reliable to start a new rally up to 340$, 420$ and 520$ zone or even higher in October.
📈RED PLAN
♻️Condition : If 1-Day NOT closes ABOVE 2.2$ zone
🔴Sell : 340$
🔴Buy : 260$
🔴Sell : 340$ - 420$ - 520$
📉BLUE PLAN
♻️Condition : If 1-Day closes ABOVE 2.2$ zone
🔵Buy : 340$
🔵Sell : 420$ - 520$
❓Details
🚫Stoploss for Long : 10%
🚫Stoploss for Short : 5%
📈Red Arrow : Main Direction as RED PLAN
📉Blue Arrow : Back-Up Direction as BLUE PLAN
🟩Green zone : Support zone as BUY section
🟥Red zone : Resistance zone as SELL section
🅰️A : The Close price of 1-day candlestick is Above the zone
🅱️B : The Close price of 1-day candlestick is Below the zone

COMP MASSIVE GAINS comingthis is for entertainment purpose only
DYOR
this one dropped OVER 31% and bouncing back nicely

COMP to $720?Compound seems to be ready to break up this triangle📐 and if successful I think there is chance for run to 720 and even higher.
ENTRY: triangle high @ 532
SL: local low @ 474
TARGET: height of the triangle projected from midpoint of the local range @ 720
RRR: 3.3
INVALIDATION: when SL level hit
Please like👍, comment🗣️, follow me✒️, enjoy📺!
Check also the previous COMP trade down below (also triangle breakout).

comp will breakout now !!!mostly all hour chart is just perfect but 1 day chart is superperfect . support and resistance are based on 1 day chart . if it break out next
target are 635 / 712
support 404 / 346
if it breakout then 521 zone will be a strong support .
a green line will act as support if it didnt breakout and pull backward .
2 posible breakout .
1 ) blue color line
2 ) green color line
fully focused on 1D candle . you can see some downtread in 4h or 1 h . but we are looking for big

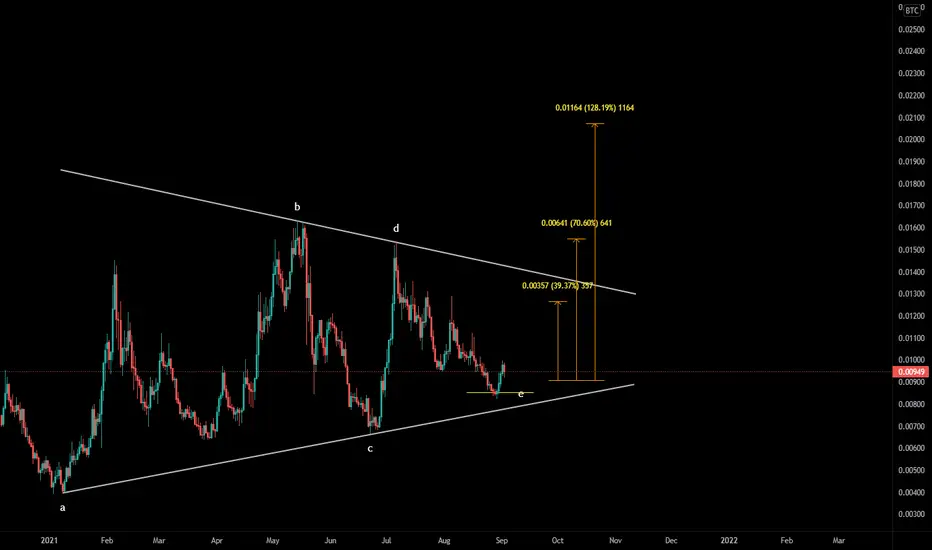
COMP/USDT bullish scenario531 breakpoint, PTs as shown, could potentially drop down to triangle support and complete A-E triangle wave, either way play the break

COMP/USDT : Broke above the trendline BINANCE:COMPUSDT
Hello everyone 😃
COMP just broke above the trendline and take hold there.
Now we'll wait for a retest on broken level to enter; Also now, We make sure that this breakout isn't fake anymore..
- EMA200 is controlling the movement and acting as a support now !
- Also there's a breaker line, Which has become a support now.
📚 Volatility is on buy limit zone so retest on lower supports is expected...
🔰 Any breakdown below trendline will give use this chance to load our bags on lower bullish trendline ;D
📌 Targets are mentioned on and the current master candle line is really critical for bulls ( any engulf above will confirm the further continuation on bull's favor ).
Hope you enjoyed our analysis about COMP's possible directions🙌
You can support us with your likes.
Also you can share your opinion with us in comments 😉🙋🏼♂️
Attention: this isn't financial advice we are just trying to help people on their own vision.
Have a good day!
@Helical_Trades

COMP seasonDefi has underperformance most of 2021 - I think it outperforms EOY and finishes parabolic

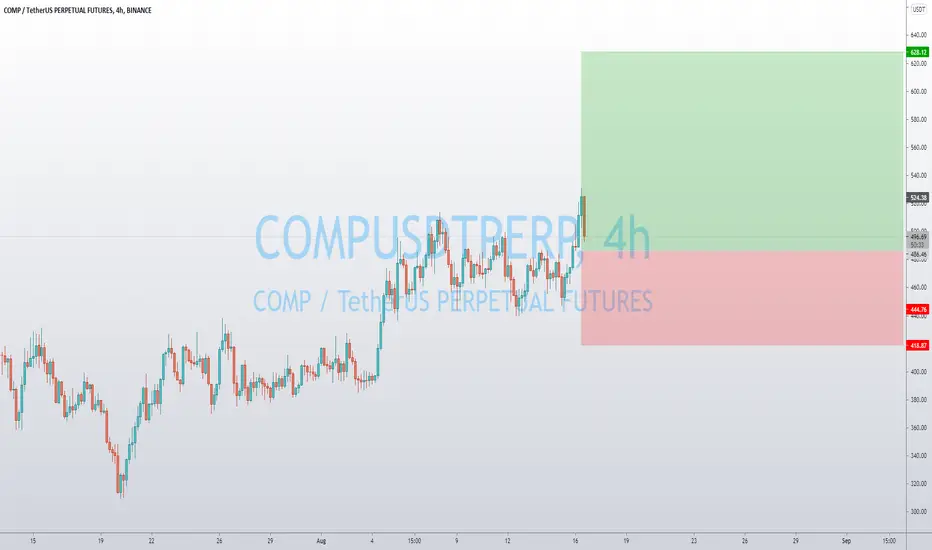
COMP Long (USDT Perps) - Swing PlayBig Ascending Triangle in play, Higher Lows forming, Squeezing into the Key Level Resistance, Move up will be pretty big on this one and targetting two areas. Good Luck and use your own Analysis on top.
Thanks,


COMP Ascending Triangle 01/09/2021There is reason to believe we may be in super-millennium wave 5, and are prepping for millennium wave 3. Price is currently holding this high volume profile area and bouncing off the channel median. Volatility indicator at the lows while price is making higher lows and is now slowly growing. Hidden bullish divergence is visible on 1D RSI.
Measured price target of triangle breakout: ~$678 (28.9%)
On the H4 timeframe we can see the most recent breakout, with volume, RSI and volatility increasing:


COMP/USDT LIMIT BUY SIGNALThis is a medium probability setup, where we expect the crypto market to continue rising. COMP price action does look very attractive.
COMPUSDT are two potential cup and handle patterns ?On the left side 4h chart
There is a big potential cup and handle pattern and it broke-out the handle .
We can setup a long-term trading plan
TP1 : Fib 1 (531.0)
TP2 : Fib 1.272~1.382(622.0~658.8)
SL : 399.2
On the right side 1h chart
There is a tiny cup and handle pattern
and it broke-out the downtrend line and retest the line .
We can setup a short-term trading plan
TP1 : Fib 1.272~1.382(510.9~521.4)
TP2 : Fib 1.618(543.9)
TP3 : Fib 2(580.3)
SL : 462.7
Or you can hold until touch the long-term target .

COMPUSD Impressive symmetryImpressive symmetry between right and left sides of the possible head and shoulders formation
I am long this coin

$COMP/USDT (Binance Futures) Falling wedge breakoutCompound is looking good for bullish continuation here after regaining 100EMA and breaking out.
Current Price= 455.95
Buy Entry = 455.63 - 442.81
Take Profit= 496.82 | 548.43 | 601.95
Stop Loss= 1039.8
Risk/Reward= 1:1.25 | 1:2.6 | 1:4
Expected Profit= +21.20% | +44.16% | +68.00%
Possible Loss= -17.02%
Fib. Retracement= 0.786| 1.117 | 1.414
Margin Leverage= 2x
Estimated Gain-time= 5 weeks

COMP triangle breakoutCompound seems to be ready to break up this triangle 📐 and if successful I think there is chance for run to 481 and even higher.
ENTRY : local high @ 445
SL : local low @ 432
TARGET : height of the triangle projected from midpoint of the local range (BUY STOP-LIMIT - SL) @ 481
RRR : 2.7
INVALIDATION : when SL level hit
Like👍, follow✒️, enjoy📺!

COMP thoughtsYOUR LIKE OR COMMENT IS MY FUEL FOR NEXT ANALYSIS :) IF U HAVE ANY QUESTION REACH ME HERE
This is not a financial advice. Always do your own research and always put stoploss in your trade (SL) :) If you want more detailed info how to study and read charts or just need help with some coin, just write to me here a comment, i will try to answer to everybody... i can help you :) all for free, don't worry, BE HAPPY!

COMP - new rocket 🚀🚀COMP is a promising new project. Compound is a DeFi lending protocol that allows users to earn interest on their cryptocurrencies by contributing them to one of several pools supported by the platform.
Globally, the price is near a strong support line. Locally, the price has broken the sloping trend line. If the price tests the trend line as support, it would be a good point to buy. Potential targets are marked above.
Be careful, if Bitcoin goes down, all altcoins will go down as well.
Write in the comments all your questions and instruments analysis of which you want to see.
Friends, push the like button, write a comment, and share with your mates - that would be the best THANK YOU.
P.S. I personally will open entry if the price will show it according to my strategy.
Always make your analysis before a trade
