Correlation EURUSD / GBP/USDJust an comparison! :-)
Enjoy and use it wisely! :-)
Peace and good trades
Irasor
Trding2ez
Wanna see more? Fon`t forget to follow me.
Any questions? Don`t hesitate to PM. ;-)
Comparison

Where we are now in the 2014/15 comparison So far, this bearmarket is remarkably similar to the 2014/15 one. So much so, that I often think: This can't be, this is too predictable.
Ok, sure, the exact behavior is different, spikes and dumps occur not exactly at the same times and the fractal looks a bit different. But the general behaviour is the same:
1. Slow grind down along an exponential falling resistance line (linear falling in log chart, the red line)
2. Unable to push through daily MA200 => dumps when failing to push through
3. Short pump spikes followed by long grinds down
This makes me think that we'll continue to see new lows like in 2014/15 until mid 2019, when the people will start talking about the good old halving again, which will
take place in mid 2020. Surely this will again generate hype, leading to a slow rise, leading to the start of the next bull cycle when the halving really kicks in, and good news will start taking effect,
like potential ETF, lightning network, positive regulations etc.
Short term short, longterm always long on BTC :)

A Comparison of Crash Patterns, BTC Price Prediction! Bitcoin's price distribution is still compressing. It will take roughly a week for bullish (or bearish ) moves to truly be supported by price mass on the shorter timeframes. This is actually the tightest we've seen the distribution all year on the four hour chart, once it starts expanding again we'll see a brief return of price volatility . Do note that the 50 MA subset distribution is heavily weighted to the negative on the daily chart and any break below the relevant mean period volatility could cause significant, medium term net negative selling. If the price mass is still decreasing, why would upward moves be supported without the people who are capable of covering the shorts being on board for long term sustainable growth? (And they're not, due to the continued, long term compression of the distribution.) Show me net positive short term volume , and then I can jump on the meme reverse head and shoulders patterns we see on tradingview right now.
The left side is Bitcoin.
The right side is the dot com bubble.
Really the fact that they're different asset classes doesn't matter, charts are just visual representations of market expectations and both charts reflect the fear and uncertainty that comes from a crash.
Yes, these are different time frames but we should all know bitcoin is extraordinarily volatile.
Bitcoin was a bubble, the bubble popped. As you can imagine, the Nasdaq composite has shot up in value far above the highs set during the dot com bubble.
Just wait for the distribution to compress before taking any bullish positions.
My expected trading range for bitcoin over the next year is 4,000 to 9,500.

Growth rate comparison FDEV, PDX, TTWOJust a basic comparison of growth rates between gaming developers Frontier Developments (green and red line), Paradox Interactive (light orange), and Take Two (darker orange). Frontier has by far out performed both other companies since 2013 in terms of growth. Interesting to notice the similarities between growth patterns of FDEV and PDX for the current year. Both had a rapid up turn after the quarterly reports, Paradox increased slightly more than FDEV during this period due to their profits growing by 120%. A good factor to bear in mind when speculating where the SP of FDEV might go after revenue from Jurassic World Evolution is announced.
Even considering FDEV's staggering growth to date, they are currently experiencing their most transformative year to date. Jurassic World Evolution is set to double units sales of previous games, Elite Dangerous has been released on PS4 growing sales to 2.5 million at the last update, with Planet Coaster cruising past the 1.5 million mark. Updates to all games are still incoming so expect future growth to continue.
With very few UK based tech companies on the market FDEV is increasingly looking like one of the best investment opportunities.

NASDAQ suggests BTC at 50K by 2020Have for some time found it likely that bitcoin would bottom out (flat) like in 2014-16 however possibly faster. The problem I have with this though is that with all the attention bitcoin has now (compared to 2014-2016) it feels a bit wrong in a way to have a long flat price period (however still possible of course). Many people has compared the Dotcom bubble with bitcoins run up to 20k so maybe a NASDAQ style bottom is actually more likely than a flat 2014-16 style bottom?
The graphs tries to illustrate some rough possible similarities between NASDAQ Y2K crash and BTC’s latest crash from 20k. BTC’s crash up until today has lasted about halt a year. In the comparison I am making NASDAQ used about 2.5 year to reach the point I am suggesting bitcoin might be at. NASDAQ graph is 5M EMA and BTC graph (below) is 25D EMA.
Apart from the exponential rally of both assets there are also some similarity in rallies on the way down illustrated with the three white arrows. Furthermore a long term support line (green trend line) can be drawn for both assets. The point in time I am suggesting we might be at is where this support line has been broken to the downside. I have moved the potential next bull run of BTC a bit forward compared to the NASDAQ as I have taken a way the 2008 crisis.
Please share your opinions below. Would really like hear your comments on this comparison.

OH NOO! My 2014 Comparison is Alive - Reversal at 4,888.7 USD? Hey Friends :)
I will try to be consistent again, guys, and make daily updates now like in the good old day! ;) As I told you last time, I've spent so much time on my company and have hired a lot of people. But everything seems finally to be all good now, and I have time to keep you guys updated again - really looking forward to doing that :)
You probably remember my Bitcoin comparison chart from 2014. It has some crazy similarities with 2018:
- Crazy bull run
- The lows
- The double tops
- Double bottoms
- Sick spike out of down trending channel
Back then, when I first made my chart, I believed this was a likely scenario. I since changed my opinion due to a lot of fundamental stuff, which were pointing upwards. I before mentioned R.S.K and iExec and Intel, which eventually will revolutionize Bitcoin, but the R.S.K I.C.O is still not out there. Also the whales seem to play a bigger role.
The low volatility also confused me a bit lately - Bitcoin has not been super easy to read lately - let's be honest.
I really want to be an optimist, and once again I'm totally convinced that Bitcoin will do super good in the long run - but for now it seems that we need to go under 5,000 USD if we look at the TA in isolation, and IF the whales don't have a plan to push us before.
4,888.7 is not just a random number I chose back then. Obviously it was kinda joke, when I came up with such a specific number - no one has a chance to be so accurate. BUT there is definitely reasons to argue that the area could be a turning point due to the following:
- 78,6 % retrace is around there
- It's just below 5,000 USD where we will have a lot of buyers
- And if we look at the Volume Profile we tend to jump from a H.V.N. to a L.V.N., which 4,888,7 is.
Anyway.. Let's see, my friends! No matter what - I'm super happy to be back, and even though we fall lower or not - Bitcoin and crypto are not dead - Bitcoin will recover and you will also see a NEW ALL TIME HIGH AGAIN :)
D4 Loves You <3
Please leave a like if you are happy to see me back - and I promise you I will keep you updated and be consistent now I again have the time. Thanks in advance, my friends :)

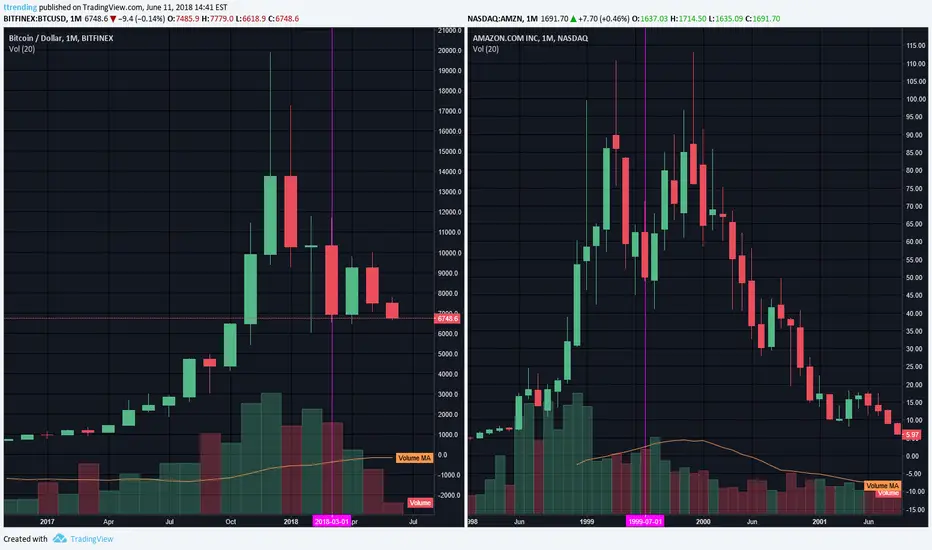
Bitcoin vs Amazon: Bubble SimilaritiesFor those of you who do not remember the history of Amazon, Amazon started out before the Dot Com bubble burst and was the darling of all the Dot Com stocks. As you can see, when that bubble burst, Amazon went from $118 to $5 (99.2% drop). Today Amazon is at $1,600 a share, but I personally believe this is irrelevant to Bitcoin as it took 20 years for Amazon to get there.
Currently, you'll see how Bitcoin's pattern is diverging from Amazon's at this stage. From the purple vertical line, Amazon went ahead and made a perfect double top @ $118 before falling to $5. Bitcoin appears to be continuing to go down. If Bitcoin happened to drop the same amount as Amazon (99.2%), the price of Bitcoin would reach a low of $160.
I'm not providing this comparison to say Bitcoin will go one way or another, but I merely wanted to show you that low can always become lower so please invest responsibly and only what you can afford to lose.
Is Bitcoin paving the way for the MJ/Hemp industry?I have compared Bitcoin with 3 major Marijuana/Hemp stocks. Bitcoin seems to be paving the way for the MJ industry by about a week to 2 weeks. Will this pattern hold up and will this be a good indicator in the future?
(Bitcoin is the black line)

Marijuana Growth compared to HEMPI have compared the growth of Hemp Inc. with 14 other marijuana companies and they are spot on. It will be interesting to see what this year has to offer for the MJ industry.

Here Is The SECRET PATH - WHY BITCOIN will MOON very soon!! Dear Friends! :)
Who would have thought, that D4rkEnergY could get sick? I flew back to Seoul 4 days ago. Got 5 hours of sleep on the plane. Installed in my apartment. When I arrived at our office I was quickly briefed that we had a big event for clients, sponsors, ICO's in a big venue. I was told to prepare a speech and make a Live TA-show on Bitcoin for +500 people - aaand the event was about to start - I had 2 hours!
After the event we went out and had some dinner with our customers - Korean BBQ of course. For those of you who don't know how to do business in Korea, I'll reveal it here:
1. Eat
2. Drink Soju mixed with beer!
3. Drink more Soju
4. Talk, negotiate
Repeat...
I'm from Denmark - and in Scandinavia we know how to drink... But D4rkEnergY had to surrender in the end... But now I'm finally back - and this time I'm going to tell you WHY Bitcoin soon will moon!
As you can see I have made a comparison between S.P.Y: S&P 500 and Bitcoin. The S.P.Y aims to track the Standard & Poor's 500 Index, which is comprised of 500 large- and mid-cap U.S. stocks
Here is what I have realized:
- Bitcoin is following S.P.Y
- But with a delay - it seems like S.P.Y is in average 2-3 weeks ahead of Bitcoin
As you can see we have very similar patterns:
- Bull run
- Double bottoms
- Double Top
- Bear flag etc.
Now what?
S.P.Y started its new uptrend May 2nd. 12 days ago. As you can see on the RSI it started after a double bottom on RSI Level 43, where we also now on the BTC-chart has made our first bottom.
We are at 8,400 USD now (while I'm writing this post we are having a sick spike to 8,8k USD). But if we will follow S.P.Y we can expect to go down again, and make a double bottom before we will moon!
D4 Loves You <3
Nice to be back again - Please leave a LIKE and follow for more. Thanks in advance, my friends :)

APHQF Profit/Loss BTC comparisonUsing BTC to swing trade APHQF with a 7.63 Buy in.
Target prices are listed with major resistance points.

BTC Bearish mirror to silverI overlaid the silver weekly chart ontop of the btc weekly in photoshop, and the set up is practically identical. I drew the support lines on the btc chart, and silver moved into the SAME regions. Nobody will like this chart, but this is what i see happening. you can see how long it will take. good news is, once that consolidation is hit, we can all buy a lot more bitcoin than we can today! ill see if i can figure out how to post the overlay chart on here as well, maybe in the comments. its pretty spooky how similar they are...

Love or hate?How much love these two have?. I have to accept that I expected to see 17.20, It was a crazy dream... (ok, my DXY chart I was using as reference was wrong).
This time I will keep them together and see what kind of relationship there is even on days as important as right now for Mexico. (NAFTA and Presidential Elections).
Best wishes!!

Comparing BTC with the 2013 and 2014 cyclesI keep seeing the 2014 bear fractal charts everywhere. There seems to be a trend going on or something. However, many people forget that before 2014, there was another rally, in early 2013.
Both rallies ended in a large correction, with a subsequent logarithmic downtrend line.
In both cases the trendline was broken. In 2014 it was a failed breakout, meaning that after breaking through the log res, it failed to go above the previous fibonacci resistance (mostly the 0.5 and 0.38 fib levels from the entire rise of the bull move).
It then continued to decline.
In 2013 however, we see a successful breakout from the downtrend line, leading to the second rally of 2013.
The question is now: Which path will BTC take now?
I think that BTC will continue to climb to the 0.38 fibo level, around 11500. Then, the usual oscillations, and afterwards it shall be decided if BTC does another rally like in 2013, or fails and continues to decline like in 2014.
People who pretend to know are liars, no one knows what will happen. However, one can position himself or herself accordingly after we hit 11500.
I will be prepared for both scenarios. Luckily, after the first pumps or dumps, it should be clear which direction BTC will take :)

ETHUSD AND LTCUSD : OPPORTUNITY THIS WEEKHi guys,
Here we are for a new analysis on LTCUSD and today we also take a loot at ETHUSD because I think it can give us some interesting pieces of information.
Cup and handle
The cup and handle pattern has been completely formed for LTCUSD and the break is confirmed today with that great green candle. According to that pattern, we would see a huge bullish move within the next days.
Comparison with ETHUSD
I chose that other chart because I noticed an obvious similarities but also a delay for the formation of the pattern.
As you can see, for the ETH cup and handle, we have broken with a 20%-bullish move. Compared with LTC, ETH shows 5 candles out of the cup and handle pattern.
In that case, we would see $187-$192 at the end of the week.
Support and resistance
The supports on that chart are given by the Fibonacci levels. Today, the red line is broken, this is a strong support, so we would not be under that support again within the next days.
Thank you for reading, react, agree, comment and follow. Have a great week ahead !

Scary BITCOIN-Comparison - 2014 and 2018! You Won't Believe it!!Dear Friends <3
D4rkEnergY is back. He will ONCE AGAIN spread love and wisdom to you guys, AND blow your minds!
- Duuhh how stupid you are! We are obviously in an uptrend. How can you believe we ever will go below 5,000 USD?
- You fuxxxxx moron, Bitcoin will MOON right now!
- Idiot, If I'll find you I'm gonna kill you!
- Seriously your TA sucks - and so do your mom!
That is just some of the few comments I have received lately - That is the price you apparently have to pay, when you become Top Author on TradingView, and trying to help people to become better at TA!
But don't worry, guys! It's all good - 99 % of the comments I get are positive, and I seriously just find it funny, how people can react to me making a prediction :)
ANYWAY!
These charts are exact (nothing is edited) comparisons from what happened in 2014, and the situation we are in right now in 2018. It really has some crazy similarities, huh?
The bull run, the lows, double top, double bottom, the sick break out spike and then (maybe a crash back in the downtrend channel)!! With this I want to say 2 things:
1. I'm NOT saying that this will necessarily play out the exact same way, but it's just to tell the disbelievers, that it CAN and MIGHT happen.
2. Even though I'm still bearish so far when it comes to Bitcoin, I'm SUPER bullish LONG TERM - and that is, the most important thing!
D4 Loves you <3
As always - Thanks for all the love and support! And please give this chart a BIG LIKE if you ALSO believe in BITCOIN :)

Comparing the current BTC cycle with 2014 - v1This is just a quick comparison. Version 1 out of 2. This is the option showing a short bear market.
Related image with both side by side.
i.imgur.com
Version 2:

Comparing the current BTC cycle with 2014 - v2This is just a quick comparison. Version 2 out of 2. This is the option showing a long bear market.
Related image with both side by side.
i.imgur.com
Version 1:

BTCUSD : 2014 crash pattern comparison replay... Yes... again...Hope this idea will inspire some of you !
If you want to see my chart more closely, click the share button below that video.. You will be able to have access to the chart used in that video.
Don't forget to hit the like/follow button if you feel like this post deserves it ;)
Indicators used in this forecast are PRO Sinewave BETA & PRO Momentum .
You can check my indicators via my TradingView's Profile : @PRO_Indicators
Kindly,
Phil
If you want to learn more about the basic rules to trade with my indicators here's the educational video link :

2014 vs 2018 bitcoin pathtake a close look at the 2014 and 2018 charts.
see the top, then immediate dip,
the charge up followed by the big drop.
the bull run followed by another dip (the one we just experienced).
mid way in 2014 there is a green candle (this could be where we are - just below the 0.5 fib line, same on both charts).
im thinking £4000 is on the cards ahead with some more dips and climbs ahead.

Bitcoin. 2 EW possibilites and oct2017 fractal comparisonAll info on chart. Let me know what you think.

Comparison of Bitcoin Major CorrectionsThe Bitcoin has been showing a substantial growth over the past years, although huge growth was followed by huge corrections. Let's try to compare the past two correctional moves down with the current one.
The past two strong corrections occurred in 2013 and 2014 were price retraced for over 75% from the peak values. All smaller corrections occurred in between resulted in a correctional move down of not more than 40%.
First Correction
The corrective wave back in 2013 resulted in a 76% decline while price moved from $260 high, down to the $60 support and has lasted for 87 days .
Second Correction
The next strong correction was not too far away and happened during 2014 - 2015. This time Bitcoin has corrected from the $1165 all-time high, down to $200 support level, which resulted in an 82% loss against the USD. The correction, including the consolidation period, has lasted for 637 days !
Third (Current) Correction
With the latest move down, Bitcoin has corrected down by almost 70% , during a relatively very short period of time, only 51 days .
The Conclusion
All major corrections have a tendency of a 70-80% drop, while the timeframe of the correctional move and consolidation period can vary. Bitcoin has already corrected nearly 70% from the all-time high and it could be a good buying opportunity for the long-term investors. At the same time, if 80% correctional move will be applied to the chart, the price could drop as low as $4000. Therefore, statistically speaking big players could start or could have started buying Bitcoin Bitcoin anywhere between $6000 and $4000.

Top 5 Coins With Strongest Recovery RecentlyOn the 6th of February, the Bitcoin has tested the lowest price since correction from USD 20k resistance started. Price dropped to USD 5.9k and corrected upwards, while during the past few days it reached USD 8K, re-gaining 40% against the USD. Is it a quite strong recovery and perhaps the end of correction?
Nevertheless, some coins corrected up much stronger than the bitcoin and below is the chart presenting the winners.
INTERNET OF PEOPLE (50% Recovery against the Bitcoin)
FUNFAIR (43% Recovery against the Bitcoin)
DECENTRALAND (37% Recovery against the Bitcoin)
POWER LEDGER (34% Recovery against the Bitcoin)
GLOBAL CURRENCY RESERVE (32% Recovery against the Bitcoin)
