COMPUSDT in a Strong Demand Zone! Reversal Potential / Breakdown🔍 In-Depth Analysis (Timeframe: Weekly / 1W)
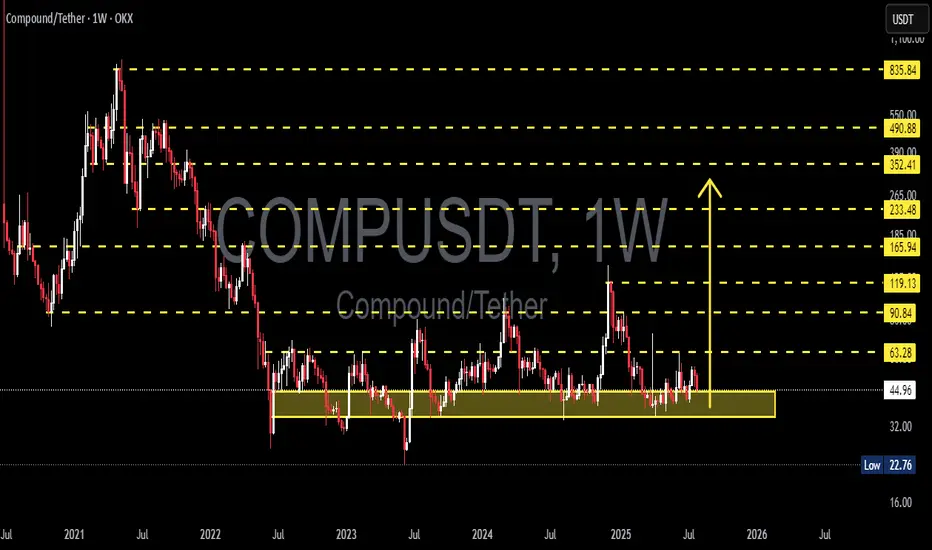
The COMP/USDT pair is currently hovering above a long-term demand zone that has held strong since mid-2022. Price is sitting around $44.90, just above the key support area of $32 – $45 (highlighted in yellow), which has acted as a major accumulation zone for over 2 years.
🧱 Critical Zone: Smart Money Accumulation or Exhaustion?
The $32–$45 demand zone has been tested multiple times, indicating smart money interest and hidden buying pressure.
Price action in this range forms a clear base structure or horizontal accumulation pattern, a classic setup before a large directional move.
However, the prolonged sideways consolidation hints at an imminent breakout or breakdown — momentum is building.
---
📊 Key Technical Pattern:
🟨 Rectangle Range (Accumulation Structure)
Price has been ranging between $32 and $63.28 with no clear breakout.
Strong rejections every time price dips below $35 indicate consistent buyer defense.
🔃 Mean Reversion Behavior
Repeated moves back to the mid-range reflect an indecisive market (equilibrium phase), often seen before expansion.
---
📈 Bullish Scenario (Potential Reversal):
If price breaks above major resistance at $63.28:
1. Upside Targets:
🎯 $90.84 (key resistance zone)
🎯 $119.13 (prior distribution zone)
🎯 $165.94 (macro target if sentiment turns highly bullish)
2. Confirmation needed via weekly close above $63 with strong volume.
3. A bullish breakout may form a new Higher Low and Higher High structure on both daily and weekly timeframes.
🟢 Bullish confirmation: Weekly bullish engulfing + volume breakout above $63.
---
📉 Bearish Scenario (Potential Breakdown):
If price closes below the $32 support:
1. Possible downside targets:
⚠️ $22.76 (next logical support)
🚨 $16 (last consolidation base pre-2021 rally)
2. A break below this long-term support could trigger a final capitulation flush before a potential macro reversal.
🔴 Bearish confirmation: Weekly close below $32 with increased volume and sustained selling.
---
⚖️ Strategic Takeaway:
COMP/USDT is currently at a pivotal decision zone — a crossroads between massive upside potential and deeper downside risk.
This is not just another support area, it’s a macro-level demand zone that will likely dictate trend direction in the coming months.
⏳ A major move is brewing — whether breakout or breakdown, be ready.
#COMPUSDT #CryptoOutlook #TechnicalAnalysis #AltcoinSeason #DeFi #CryptoTrading #AccumulationZone #BreakoutSetup #BearishScenario #BullishSetup #CryptoAnalysis
Compound
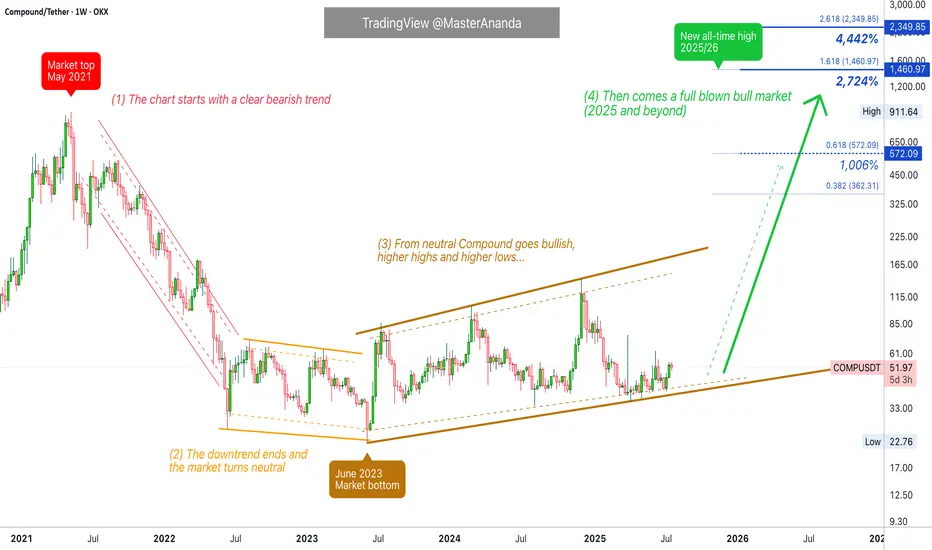
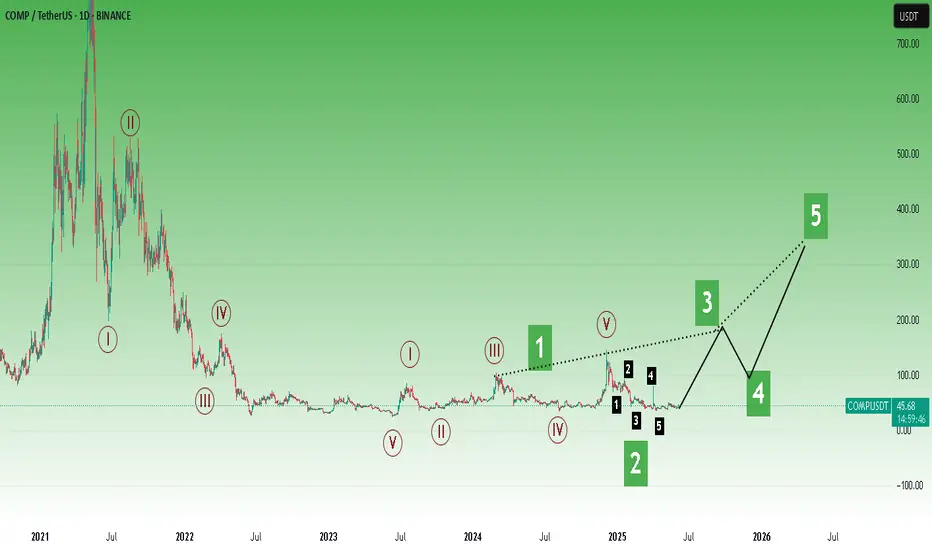
Compound Full Market Cycle · 1, 2, 3 & 4 (PP: 2,700% - 4,442%)This is the full long-term Compound (COMPUSDT) chart.
1) The market top happened May 2021. Notice how the bull market in 2021 ended early compared to 2025. While May signaled the start of a bear market, in 2025 we are already in July while trading at bottom prices.
High prices, a new all-time high, signals the start of a descent and bear market. COMPUSDT dropped from May 2021 until June 2022, more than a year. A shy lower low happened next around June 2023, a technical double-bottom.
2) Between June 2022 and June 2023 we have a neutral period, sideways. This is a "lost year."
3) Market dynamics change after June 2023. COMPUSDT stops producing lower lows and instead starts a bullish consolidation phase. Higher highs but still sideways. No major uptrend. This period lasts from June 2023 until present day, July 2025.
The pattern will break with a strong close above $150 followed by a sustained uptrend.
4) This is the 2025 bull market which can extend beyond this year into 2026, hopefully. Here instead of neutral or sideways, we should see a major uptrend as the mirror image of the 2021 downtrend. Also, a new all-time high is needed and expected to end this cycle. When the new all-time high hits, bearish conditions develop and the next bear market starts.
Potential for growth is huge, between 28 and 45X.
Thank you for reading.
Namaste.
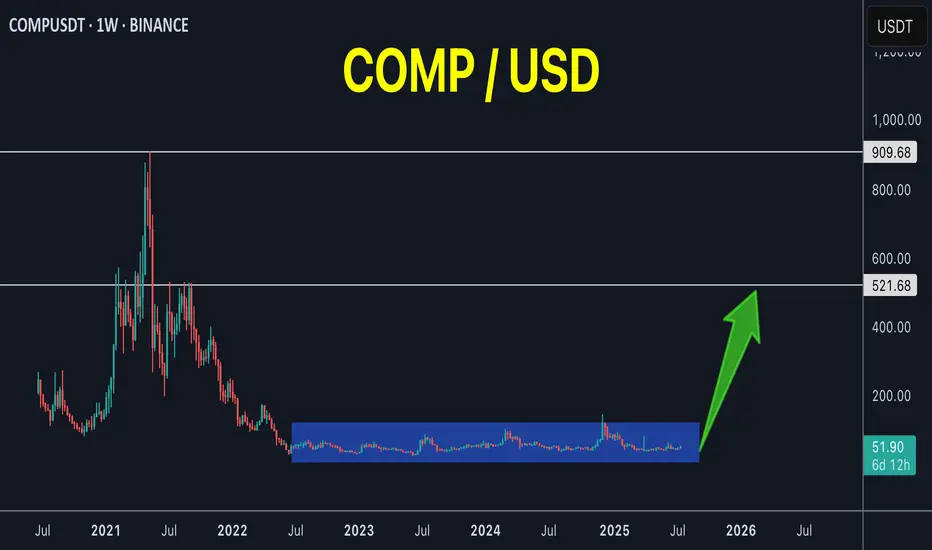
COMP 3 years of accumulation!COMP / USDT
3 years of accumulation and volume start to enter again
Just imagine if it breaks out from this long accumulation, the target will be very high but first we must breakout this accumulation box
Best of wishes
COMPUSDT Accumulation Ending? Massive Bullish Reversal Ahead!
🧠 Weekly Analysis
After peaking near $911 in 2021, COMPUSDT experienced a prolonged downtrend, followed by a wide sideways accumulation phase around the $33–$41 range.
📉 This consolidation has formed a classic Wyckoff Accumulation structure, often seen before strong bullish reversals.
🟨 Key Support & Demand Zone:
🔻 Accumulation Zone: $33–$41
This range has acted as a strong floor since mid-2022.
Multiple rejections from this zone hint at smart money accumulation.
Recent long wicks and bullish rejections from this zone signal a potential reversal brewing.
🔮 Bullish Scenario:
If the price holds above the accumulation zone and breaks key resistance, the bullish case unfolds as follows:
📈 Bullish Price Targets:
1. ✅ $62.64 — First breakout confirmation.
2. ✅ $89.03 — Minor resistance and psychological level.
3. ✅ $117.27 — Major historical resistance.
4. ✅ $173.11 — Medium-term target.
5. ✅ $246.03 — Potential full target from pattern projection.
6. 🚀 Extension Targets: $363–$516 in case of a strong altcoin rally.
🔥 Breakout Confirmation: Weekly candle close above $62.64 with volume surge.
🧨 Bearish Scenario:
If the $33 support zone breaks and closes below:
⚠️ Possible downside:
Drop toward $23.27 (2022 low)
Extreme scenario: retest of $17 zone
This invalidates the current bullish structure and resumes macro downtrend
📊 Patterns Observed:
🔹 Extended Accumulation Range
🔹 Potential Inverse Head & Shoulders (in development)
🔹 Double Bottom Structure (awaiting neckline breakout)
These patterns suggest a market gearing up for a major shift — but volume and breakout confirmation remain crucial.
📅 Summary & Strategy:
🟢 Entry Zone: $35–$42 (low-risk accumulation)
🟡 Breakout Zone: Above $62.64
🔴 Stop Loss: Weekly close below $33
➡️ Favorable risk-to-reward setup for mid- to long-term swing traders and investors.
💡 Watch for breakout volume and BTC’s direction for confluence.
#COMPUSDT #CryptoBreakout #AltcoinSeason #WyckoffAccumulation #SwingTrading #CryptoTechnicalAnalysis #COMP #BreakoutSetup #CryptoAnalysis #BullishStructure

Compound 4X Lev. Full PREMIUM Trade-Numbers (PP: 2428%)This is a very, very easy set of targets that I am setting up here for Compound (COMPUSDT). And this trade setup with 4X leverage is low risk, very low risk. High potential for reward (more than 2,000%).
After June 2023, the dynamics changed from lower highs and lower lows, to higher highs and higher lows.
Late March produced the highest (buy)volume ever for this pair on this exchange. Someone in the background knows what is about to happen. Someone big. Now you know too thanks to this chart and trade-numbers.
The stop-loss is not meant for your liquidation nor for any trading, it is meant to indicate when the chart setup goes bad. Leveraged trading is for advanced traders.
If the stop-loss conditions are met, maybe monthly rather than weekly, the chart setup and market conditions are lost. Obviously, the stop-loss conditions can be activated and yet, growth still happens within weeks or months. Stop-losses should be ignored. Only advanced traders should use those.
This is a high probability trade setup. High risk vs a high potential for reward.
The numbers are meant for illustration only. Some people can use them to make predictions, others to decide where to buy as simply Cryptocurrency investors, while still others can use them to trade.
How you use these numbers is to you. I am not responsible for any loses, for how the market behaves nor any of your mistakes. Trading is a game for adults. A game, truly. This game can produce money as well as losses.
Trade at your own risk. I am wishing you success and great profits. You can do this. Just keep trying, work hard, study... Focus.
Full trade-numbers below:
_____
LONG COMPUSDT
Leverage: 4X
Entry levels:
1) $46
2) $43
3) $41
4) $36
Targets:
1) $50
2) $55
3) $60
4) $75
5) $88
6) $100
7) $122
8) $140
9) $165
10) $180
11) $205
12) $245
13) $274
14) $311
Stop-loss:
Close weekly below $35
Potential profits: 2428%
Capital allocation: 3%
_____
Don't mind my disclaimer on these trades. Some people can't face the fact of a losing trade. It is for those.
Responsible people like you and me know how the game works. We are happy to accept our winnings as well as any loss. We do not blame others for our mistakes. Life is full of challenges, we use these challenges as learning experiences. Trying circumstances are what made us into who we are today.
When you are going through something hard, it can be tough to face this reality with a smile in your face. When you look back to the past, in retrospect after all is great, you might even laugh and wear a badge of honor for the hard times you were able to overcome.
Think about it, a challenge that was once a nightmare, is now only a story that you can share and enjoy while you continue to grow.
Trading can help you improve your life, if you are honest with yourself and accept the fact that the market cannot be controlled. Yes, there is some manipulation, but nothing can control how nature works.
Nature works in cycles... After going down, everything grows.
Cryptocurrency is going up. Get used to it, because we are about to be showered with tons of profits, lots of money for all those who take the risk to buy and hold. Buy and hold now that prices are low.
Namaste.

Compound Gets Even Better —Bull Market ConfirmedThe trading pair COMPUSDT seems to be struggling short-term, daily timeframe, but what is actually happening? Why all the daily candles continue to close so small even while volume is high? Let me explain.
Resistance was present on the form of EMAs. Recently, COMPUSDT managed to break above EMA21 and EMA34, then EMA55. But one major level still needed to be taken out, EMA89. This is the blue line on the chart.
Two days ago COMPUSDT moved and close above this level. Yesterday, there was a Doji but no retrace. And today the action is green above $45.27 (EMA89). This is bullish confirmed.
See what happened back in November 2024, it is all the same. When COMPUSDT managed to close daily above EMA89, we have a massive bullish wave. It will be the same but different. The difference is that this time around the bullish wave will be many times bigger, prices will go much more higher.
Thank you for reading.
Namaste.

Warren Buffett's Approach to Long-Term Wealth BuildingUnderstanding Value Investing: Warren Buffett's Educational Approach to Long-Term Wealth Building
Learn the educational principles behind value investing and dollar-cost averaging strategies, based on historical market data and Warren Buffett's documented investment philosophy.
---
Introduction: The Million-Dollar Question Every Investor Asks
Warren Buffett—the Oracle of Omaha—has consistently advocated that index fund investing provides a simple, educational approach to long-term wealth building for most investors.
His famous 2007 bet against hedge funds proved this principle in dramatic fashion: Buffett wagered $1 million that a basic S&P 500 index fund would outperform a collection of hedge funds over 10 years. He crushed them. The S&P 500 returned 7.1% annually while the hedge funds averaged just 2.2%.
Today, we'll explore the educational principles behind this approach—examining historical data, mathematical concepts, and implementation strategies for learning purposes.
---
Part 1: Understanding Value Investing for Modern Markets
Value investing isn't about finding the next GameStop or Tesla. It's about buying quality assets at attractive prices and holding them for compound growth .
For beginners, this translates to:
Broad Market Exposure: Own a cross-section of businesses through low-cost index funds
Long-term Perspective: Think decades, not months
Disciplined Approach: Systematic investing regardless of market noise
"Time is the friend of the wonderful business, the enemy of the mediocre." - Warren Buffett
Real-World Application:
Instead of trying to pick between NASDAQ:AAPL , NASDAQ:MSFT , or NASDAQ:GOOGL , you simply buy AMEX:SPY (SPDR S&P 500 ETF) and own pieces of all 500 companies automatically.
---
Part 2: Dollar-Cost Averaging - Your Secret Weapon Against Market Timing
The Problem: Everyone tries to time the market. Studies show that even professional investors get this wrong 70% of the time.
The Solution: Dollar-Cost Averaging (DCA) eliminates timing risk entirely.
How DCA Works:
Decide on your total investment amount (e.g., $24,000)
Split it into equal parts (e.g., 12 months = $2,000/month)
Invest the same amount on the same day each month
Ignore market fluctuations completely
DCA in Action - Real Example:
Let's say you started DCA into AMEX:SPY in January 2022 (right before the bear market):
January 2022: AMEX:SPY at $450 → You buy $1,000 worth (2.22 shares)
June 2022: AMEX:SPY at $380 → You buy $1,000 worth (2.63 shares)
December 2022: AMEX:SPY at $385 → You buy $1,000 worth (2.60 shares)
Result: Your average cost per share was $405, significantly better than the $450 you would have paid with a lump sum in January.
---
Part 3: The Mathematics of Wealth Creation
Here's where value investing gets exciting. Let's run the actual numbers using historical S&P 500 returns:
Historical Performance:
- Average Annual Return: 10.3% (1957-2023)
- Inflation-Adjusted: ~6-7% real returns
- Conservative Estimate: 8% for planning purposes
Scenario 1: The $24K Start
Initial Investment: $24,000 | Annual Addition: $2,400 | Return: 8%
Calculation Summary:
- Initial Investment: $24,000
- Annual Contribution: $2,400 ($200/month)
- Expected Return: 8%
- Time Period: 20 years
Results:
- Year 10 Balance: $86,581
- Year 20 Balance: $221,692
- Total Contributed: $72,000
- Investment Gains: $149,692
Scenario 2: The Aggressive Investor
Initial Investment: $60,000 | Annual Addition: $6,000 | Return: 10%
Historical example after 20 years: $747,300
- Total Contributed: $180,000
- Calculated Investment Gains: $567,300
Educational Insight on Compound Returns:
This historical example illustrates how 2% higher returns (10% vs 8%) could dramatically impact long-term outcomes. This is why even small differences in return rates can create life-changing wealth over decades. The mathematics of compound growth are both simple and incredibly powerful.
---
Part 4: Investing vs. Savings - The Shocking Truth
Let's compare the same contributions invested in stocks vs. a high-yield savings account:
20-Year Comparison:
- Stock Investment (8% return): $221,692
- High-Yield Savings (5% return): $143,037
- Difference: $78,655 (55% more wealth!)
"Compound interest is the eighth wonder of the world. He who understands it, earns it... he who doesn't, pays it." - Often attributed to Einstein
Key Insight: That extra 3% annual return created an additional $78,655 over 20 years. Over 30-40 years, this difference becomes truly life-changing.
📍 Global Savings Reality - The Investment Advantage Worldwide:
The power of index fund investing becomes even more dramatic when we examine savings rates around the world. Here's how the same $24K initial + $2,400 annual investment compares globally:
🇯🇵 Japan (0.5% savings):
- Stock Investment: $221,692
- Savings Account: $76,868
- Advantage: $144,824 (188% more wealth)
🇪🇺 Western Europe Average (3% savings):
- Stock Investment: $221,692
- Savings Account: $107,834
- Advantage: $113,858 (106% more wealth)
🇬🇷 Greece/Southern Europe (2% savings):
- Stock Investment: $221,692
- Savings Account: $93,975
- Advantage: $127,717 (136% more wealth)
🇰🇷 South Korea (2.5% savings):
- Stock Investment: $221,692
- Savings Account: $100,634
- Advantage: $121,058 (120% more wealth)
💡 The Global Lesson:
The lower your country's savings rates, the MORE dramatic the advantage of global index fund investing becomes. For investors in countries with minimal savings returns, staying in cash is essentially guaranteed wealth destruction when compared to broad market investing.
This is exactly why Warren Buffett's advice transcends borders - mathematical principles of compound growth work the same whether you're in New York, London, or Athens.
Note: Savings rates shown are approximate regional averages and may vary by institution and current market conditions. Always check current rates in your specific market for precise calculations.
---
Part 5: Building Your Value Investing Portfolio
Core Holdings (80% of portfolio):
AMEX:SPY - S&P 500 ETF (Large-cap US stocks)
AMEX:VTI - Total Stock Market ETF (Broader US exposure)
LSE:VUAA - S&P 500 UCITS Accumulating (Tax-efficient for international investors)
Satellite Holdings (20% of portfolio):
NASDAQ:QQQ - Technology-focused (Higher growth potential)
AMEX:VYM - Dividend-focused (Income generation)
NYSE:BRK.B - Berkshire Hathaway (Value investing & diversification)
---
Part 6: Implementation Strategy - Your Action Plan
Month 1: Foundation
Open a brokerage account (research low-cost brokers available in your region)
Set up automatic transfers from your bank
Buy your first AMEX:SPY shares
💡 Broker Selection Considerations:
Traditional Brokers: Interactive Brokers, Fidelity, Vanguard, Schwab
Digital Platforms: Revolut, Trading 212, eToro (check availability in your country)
Key Factors: Low fees, ETF access, automatic investing features, regulatory protection
Research: Compare costs and features for your specific location/needs
Month 2-12: Execution
Invest the same amount on the same day each month
Ignore market news and volatility
Track your progress in a simple spreadsheet
Year 2+: Optimization
Increase contributions with salary increases
Consider additional core holdings like LSE:VUAA for tax efficiency
Consider tax-loss harvesting opportunities
Visualizing Your DCA Strategy
Understanding DCA concepts is easier when you can visualize the results. TradingView offers various tools to help you understand investment strategies, including DCA tracking indicators like the DCA Investment Tracker Pro which help visualize long-term investment concepts.
🎯 Key Visualization Features:
These types of tools typically help visualize:
Historical Analysis: How your strategy would have performed using real market data
Growth Projections: Educational scenarios showing potential long-term outcomes
Performance Comparison: Comparing actual vs theoretical DCA performance
Volatility Understanding: How different stocks behave with DCA over time
📊 Real-World Examples from Live Users:
Stable Index Investing Success:
AMEX:SPY (S&P 500) Example: $60K initial + $500/month starting 2020. The indicator shows SPY's historical 10%+ returns, demonstrating how consistent broad market investing builds wealth over time. Notice the smooth theoretical growth line vs actual performance tracking.
Value Investing Approach:
NYSE:BRK.B (Berkshire Hathaway): Warren Buffett's legendary performance through DCA lens. The indicator demonstrates how quality value companies compound wealth over decades. Lower volatility = standard CAGR calculations used.
High-Volatility Stock Management:
NASDAQ:NVDA (NVIDIA): Shows smart volatility detection in action. NVIDIA's explosive AI boom creates extreme years that trigger automatic switch to "Median (High Vol): 50%" calculations for conservative projections, protecting against unrealistic future estimates.
Tech Stock Long-Term Analysis:
NASDAQ:META (Meta Platforms): Despite being a tech stock and experiencing the 2022 crash, META's 10-year history shows consistent enough performance (23.98% CAGR) that volatility detection doesn't trigger. Standard CAGR calculations demonstrate stable long-term growth.
⚡ Educational Application:
When using visualization tools on TradingView:
Select Your Asset: Choose the stock/ETF you want to analyze (like AMEX:SPY )
Input Parameters: Enter your investment amounts and time periods
Study Historical Data: See how your strategy would have performed in real markets
Understand Projections: Learn from educational growth scenarios
🎓 Educational Benefits:
This tool helps you understand:
- How compound growth actually works in real markets
- The difference between volatile and stable investment returns
- Why consistent DCA often outperforms timing strategies
- How your current performance compares to historical market patterns
- The visual power of long-term wealth building
As Warren Buffett said: "Someone's sitting in the shade today because someone planted a tree a long time ago." This tool helps you visualize your financial tree growing over time through actual market data and educational projections.
---
Part 7: Common Mistakes to Avoid
The "Perfect Timing" Trap
Waiting for the "perfect" entry point often means missing years of compound growth. Time in the market beats timing the market.
The "Hot Stock" Temptation
Chasing individual stocks like NASDAQ:NVDA or NASDAQ:TSLA might seem exciting, but it introduces unnecessary risk for beginners.
The "Market Crash" Panic
Every bear market feels like "this time is different." Historical data shows that patient investors who continued their DCA through 2008, 2020, and other crashes were handsomely rewarded.
---
Conclusion: Your Path to Financial Freedom
Value investing through broad index funds and dollar-cost averaging isn't glamorous. You won't get rich overnight, and you won't have exciting stories about your latest trade.
But here's what you will have:
Proven strategy backed by decades of data
Peace of mind during market volatility
Compound growth working in your favor 24/7
A realistic path to serious wealth creation
The Bottom Line: Warren Buffett's approach works because it's simple, sustainable, and based on fundamental economic principles. Start today, stay consistent, and let compound growth do the heavy lifting.
"Someone's sitting in the shade today because someone planted a tree a long time ago." - Warren Buffett
Educational Summary:
Understanding these principles provides a foundation for informed decision-making. As Warren Buffett noted: "The best time to plant a tree was 20 years ago. The second-best time is now" - emphasizing the educational value of understanding long-term investment principles early.
---
🙏 Personal Note & Acknowledgment
This article was not entirely my own work, but the result of artificial intelligence in-depth research and information gathering. I fine-tuned and brought it to my own vision and ideas. While working with AI, I found this research so valuable for myself that I could not avoid sharing it with all of you.
I hope this perspective gives you a different approach to long-term investing. It completely changed my style of thinking and my approach to the markets. As a father of 3 kids, I'm always seeking the best investment strategies for our future. While I was aware of the power of compound interest, I could never truly visualize its actual power.
That's exactly why I also created the open-source DCA Investment Tracker Pro indicator - so everyone can see and visualize the benefits of choosing a long, steady investment approach. Being able to see compound growth in action makes all the difference in staying committed to a strategy.
As someone truly said: compound interest is the 8th wonder of the world.
---
Disclaimer: This article is for educational purposes only and does not constitute financial advice. Past performance does not guarantee future results. Always consult with a qualified financial advisor before making investment decisions.

Compound Turns Bullish: Buy & Hold, Trade & WinCOMPUSDT challenged EMA89 June-4 but was rejected. June-5 ended as a red day. Today, the action is green again and back above EMA89. A close above this level and a wave above $100 is confirmed.
Good evening my fellow Cryptocurrency trader—it is still early for Compound—I hope you are having a wonderful day.
April-1 again, COMPUSDT tried to move above EMA55 and EMA89 but was rejected. The difference today is that the action is happening slowly, after several failed attempts, with high volume and two months of higher lows. In short, there won't be a rejection this time. And once the action moves above this level, blue on the chart, bullish confirmed.
This is just a friendly reminder, I posted about this one recently; this is one that you can't miss.
Whatever you do » Buy and hold, trade and win.
Namaste.
COMP ROADMAPTo me the view is pretty clear.
* The purpose of my graphic drawings is purely educational.
* What i write here is not an investment advice. Please do your own research before investing in any asset.
* Never take my personal opinions as investment advice, you may lose your money.
Compound 3 Years Consolidation = Ultra-Bull Market (PP: 3,164%)Compound has been consolidating for three years now, similar to DigiByte in time but the chart situation is different, the price here is much better because it is trading lower near support.
I cannot stress it enough. You cannot fail with a pair like this one. Trading at bottom prices after years of consolidation. Once it starts going/growing you will be sitting on a very strong position. Long-term growth. Huge potential for profits vs a minimum risk potential.
Ok. I say "no leverage" but I share leveraged trades. Remember, many people so there is a little bit for everybody.
The trick is to go below 5X. If you do 3X, you are always safe basically, very little risk and you can maximize profits. 5X is also do-able. If you go beyond 5X, it is possible of course and we do it all the time but you run the risk of getting liquidated. So there are some trade-offs.
But of course, you need to do your own thing I am only sharing the charts.
Spot trading, 100% success guaranteed. Worst case scenario, a long wait.
To achieve these two you cannot use a stop-loss. If you do use a stop-loss then you can be shaken out of your position through a market flush. If you buy and hold, set it and forget it, you can win for sure long-term.
Compound has been consolidating for three years and is getting ready to move. Once it starts moving there is no going back. The longer the consolidation phase the stronger the bull market that follows.
Namaste.


OMG, Which One? Too Many Altcoins To Choose From —CompoundIt goes something like this, and this is easy: One of my friends ask me for a coin that is set to move now. High level of accuracy. Of course, the first thing I think about is all the trades in the past month that already went up, but, ok the show goes on and the market has lots to offer. This pair is the one that I showed him. This one is going up.
Compound here is easy and I will explain the chart for you right away. Quick and simple of course because simple is best.
We have the higher lows since June 2023.
We have higher highs as well. That's as simple as it gets cuz it reveals the bullish bias and bullish trend.
Now, how do we know if it will move right away?
Value. This is valuable... Notice the high volume candle 7-April. This reveals the bullish bias.
You can choose your own target of course, but my point is, this one is the ones that is going up.
There are many pairs to choose from, but some will move in three months, other in three weeks and other in three days. Some will not move at all... Choose wisely.
Thank you for reading.
Namaste.

COMPUSDT 1D AnalysisCOMP ~ 1D Analysis
#COMP Buy gradually from here if you still have a Conviction on this coin with a short -term target of at least 10%+ from here.

Compound 200% very soonHello dear readers!
Another quick one for you. Compound has been around for a while and has seen a massive retrace of around 73%.
There are now reasons to be bullish for the short term.
When we look at the charts we can see a bullflag breakout (fierce) and retest of the upper bound. Its on a hard support also. Any sellers have dried out, and the only way is up.
Target minimum: 132
Stoploss: you can pick
~Rustle

Comp Spot Buy✅ Trade Setup Plan
🟢 Bullish Scenario (Long Entry)
📥 Entry:
Aggressive Entry: Now (~$41) after breakout from the descending trendline
Safer Entry (Confirmation): Break and close above $44 with volume
🎯 Targets:
TP1: $47.90 – $48.50 (recent local high)
TP2: $50.80 – $51.50 (resistance zone)
TP3: $56 (major resistance)
🛑 Stop-Loss:
Below $38.50 or tighter at $39.80 if you entered at $41
Below $36.50 if you're targeting a wider swing trade
🔴 Bearish Scenario (Short Entry)
📥 Entry:
If price fails to hold $39.80 and breaks below $38.50 with volume
🎯 Targets:
TP1: $35 (support region)
TP2: $33.20 – last tested bottom
🛑 Stop-Loss:
Above $41.20 or $42 depending on entry
📊 Indicators to Monitor
RSI: A clean push above 60 = bullish strength; drop below 40 = bearish pressure
MACD: A strong bullish crossover + increasing histogram = momentum confirmation
Volume: Confirm breakouts with increasing volume

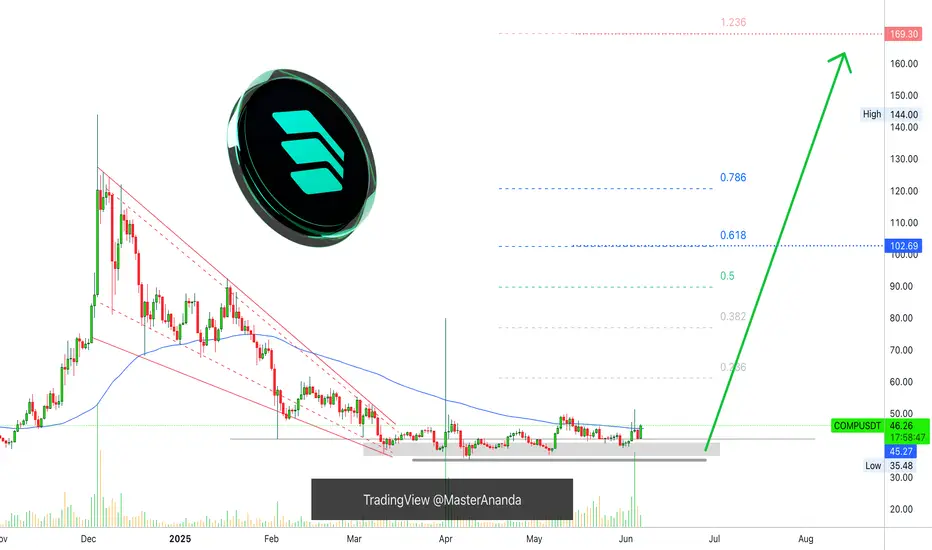
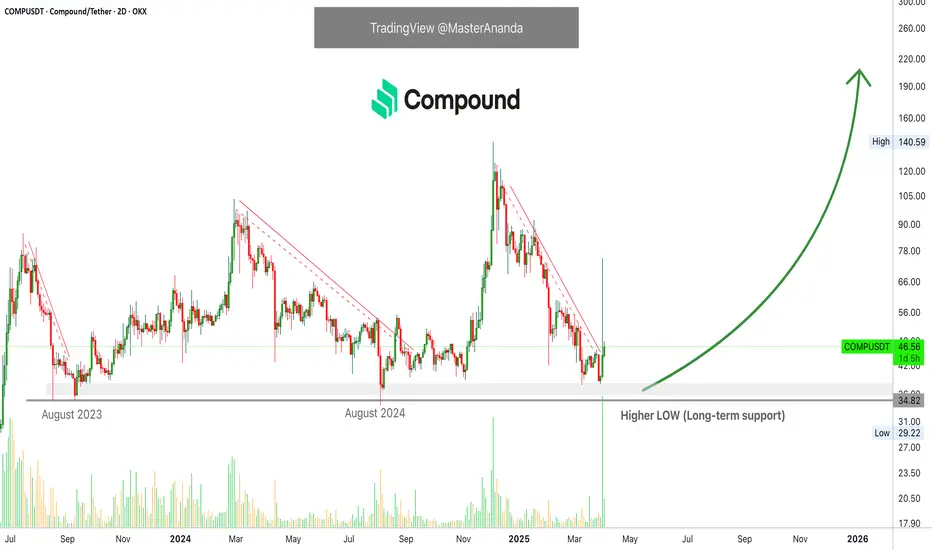
Compound: Ready, Bullish, LONG (More Than 30X Growth Potential)Compound is ready. COMPUSDT is now confirmed bullish. Time to go LONG.
How are you doing my friend in this beautiful day?
I hope you are doing great. Another interesting pair with a great entry price, a great project as well.
Compound produced the highest volume in several years as we entered April 2025. This is huge. This signal alone reveals that the next bullish wave is already here.
A long-term support holds —fails to be tested, which is bullish; we have a higher low. A yearly double-bottom is present on the chart, August 2023 and August 2024. March 2025 produced the higher low.
The previous session produced the highest buy (bullish) volume since March 2022, three years ago. There is also a long upper wick on the candle. This means that resistance has been removed. The rise can now happen smoothly as all the sell orders all the way to $75 have been fulfilled. We are LONG on this pair.
Compound has been producing higher highs since mid-2023. These higher highs are part of a long-term, wide, consolidation phase. This consolidation is the preparation for the 2025 bull-market. We are looking at a potential of... I don't know, maybe $1,444 as the next All-Time High. Let's do the maths. Some 30X.
This is a timing based chart. "Seek you first great entry prices and timing, and all these profits shall be added unto you."
If you want to know more about the numbers and signals, search for COMPUSDT when you visit my profile, you will find all the numbers for the 2025 All-Time High and beyond.
This pair is good now to buy and hold.
Leveraged traders can also approach this pair with low risk and a high potential for reward.
Thank you for reading.
Your support is appreciated.
Namaste.
Compound COMP price analysisWhat is happening today?) Some coins are falling -50% per hour, and #COMP has grown +85% from $40 to $75 per hour
Does anyone know what kind of "breakthrough" happened in #Compound ?
Is this what we get, can we start dreaming about the growth of OKX:COMPUSDT to $175, and if we are lucky, to $215?)
_____________________
Did you like our analysis? Leave a comment, like, and follow to get more

#COMP #COMPUSDT #Compound #Update #Analysis #Eddy#COMP #COMPUSDT #Compound #Update #Analysis #Eddy
COMPUSDT.P (( 3 Signals Analyzed on the chart ))
Update on the analysis of this currency for you, dear followers,
Everything is very clear on the chart and Important areas of the upper time frame for scalping are identified and named.
This is based on a combination of different styles, including the volume style with the ict style.
Based on your strategy and style, get the necessary confirmations for this scalping setup to enter the trade.
I have analyzed for you the 3 moves that this currency is going to make in its upcoming trends. For you, follow moves 1, 2 & 3 in order according to the comments left on the chart. First, take a long scalp from the first marked point to the red marked lines and then follow the second move. The best short point is to the low demand area, which is the green area. The red line with the entry of snipers is the text. Finally, follow and for the third move in the green marked demand area, look for confirmation for swing trading and also long-term spot investment.
It is never too late to buy and invest. Do not rush and do not be fooled by the positive movements and reactions of the market. Wait for the price to reach its valuable areas. In the analysis of the Compound currency, as you can see, there is a strong demand area that is intact. Be patient until the price falls from the decision or extreme flips to the green area of the important demand area. Be sure to check this currency in your Daily & Weekly time frame and draw the areas. Then refer to the weekly, daily and four-hour time frames and draw the lower time areas and look for confirmation for volatility.
Do not rush to invest and buy spot and let the price reach the support area.
Be successful and profitable.
"In the previous analysis of the Comp currency, we caught a beautiful pump. I hope you enjoyed and benefited from that analysis."
Review and view previous Comp currency analysis :

#COMP #COMPUSDT #Compound #Analysis #LONG #Eddy#COMP #COMPUSDT #Compound #Analysis #LONG #Eddy
COMPUSDT.P Ready For Long Entry
Important areas have been identified, the entry point has been touched in advance, and the pullback has been made on a lower timeframe, and it is ready to long entry upon receiving confirmation.
This is based on a combination of different styles, including the volume style with the ict style.
Based on your strategy and style, get the necessary confirmations for this scalping setup to enter the trade.
Don't forget risk and capital management.
The responsibility for the transaction is yours and I have no responsibility for not observing your risk and capital management.
Note: The price can go much higher than the second target, and there is a possibility of a 40% pump on this currency. By observing risk and capital management, obtaining the necessary approvals, and saving profits in the targets, you can keep it for the pump.
Be successful and profitable.

COMP - Shift in Momentum in Action!Hello TradingView Family / Fellow Traders. This is Richard, also known as theSignalyst.
🔹 COMP has been overall bearish trading within the falling channel in red.
However , it is currently rejecting a strong weekly support at $35 - $40.
Moreover, it is clear that the bears are exhausted as the bearish impulse phases are getting more flat.
📈 For the bulls to take over, and shift the momentum in their favor, a break above both trendlines and $50 round number is needed.
📚 Always follow your trading plan regarding entry, risk management, and trade management.
Good luck!
All Strategies Are Good; If Managed Properly!
~Rich

Compound 6X Trade-Numbers (1,788% Potential)Compound hit bottom. This is a trade setup that recently went badly for us, it failed but, I would like to try again.
There is a clear double-bottom signal, short-term, and a long-term higher low. This chart setup is perfect for a new bullish jump. Truly a great set up based on the chart structure and signals.
Notice the volume. Always the volume. There is no volume on the bearish wave.
Notice the strong volume within the bullish wave.
That is all I have to say. I am going LONG.
Full trade-numbers below:
_____
LONG COMPUSDT
Leverage: 6X
Entry levels:
1) $53
2) $49
3) $46
Targets:
1) $57
2) $66
3) $81
4) $93
5) $105
6) $122
7) $144
8) $168
9) $183
10) $207
Stop-loss:
Close weekly below $45
Potential profits: 1788%
Capital allocation: 4%
_____
Thank you for reading.
Remember, you can do whatever you want. It is your life, your money, your computer... Your responsibility.
Namaste.

Long-Term Investors, Pay Attention – Blue Boxes Are Critical! “Smart money doesn’t chase, it positions. And let me tell you, these blue boxes could be the golden zones for long-term investors looking to catch the next big move.”
Why This Matters:
Blue Boxes = Key Demand Zones – If CDV, lower time frame breakouts, and volume profile confirm, these areas could be massive for accumulation.
Patience is Everything – We don’t buy just anywhere. We wait for confirmation and then strike with confidence. That’s how big money plays the game.
Potential for Huge Gains – Long-term setups like this don’t come often. When they do, you want to be in early, not chasing later.
Final Thoughts:
“I’m watching volume profile, CDV, and liquidity heatmap closely. The setup is forming, and when the confirmations roll in, this could be a monster move!”
Long-term traders, this could be your golden ticket! 🚀🔥
Let me tell you, this is something special. These insights, these setups—they’re not just good; they’re game-changers. I've spent years refining my approach, and the results speak for themselves. People are always asking, "How do you spot these opportunities?" It’s simple: experience, clarity, and a focus on high-probability moves.
Want to know how I use heatmaps, cumulative volume delta, and volume footprint techniques to find demand zones with precision? I’m happy to share—just send me a message. No cost, no catch. I believe in helping people make smarter decisions.
Here are some of my recent analyses. Each one highlights key opportunities:
🚀 RENDERUSDT: Strategic Support Zones at the Blue Boxes +%45 Reaction
🎯 PUNDIXUSDT: Huge Opportunity | 250% Volume Spike - %60 Reaction Sniper Entry
🌐 CryptoMarkets TOTAL2: Support Zone
🚀 GMTUSDT: %35 FAST REJECTION FROM THE RED BOX
🎯 ZENUSDT.P: Patience & Profitability | %230 Reaction from the Sniper Entry
🎯 DEXEUSDT %180 Reaction with %9 Stop
🐶 DOGEUSDT.P: Next Move
🎨 RENDERUSDT.P: Opportunity of the Month
💎 ETHUSDT.P: Where to Retrace
🟢 BNBUSDT.P: Potential Surge
📊 BTC Dominance: Reaction Zone
🌊 WAVESUSDT.P: Demand Zone Potential
🟣 UNIUSDT.P: Long-Term Trade
🔵 XRPUSDT.P: Entry Zones
🔗 LINKUSDT.P: Follow The River
📈 BTCUSDT.P: Two Key Demand Zones
🟩 POLUSDT: Bullish Momentum
🌟 PENDLEUSDT.P: Where Opportunity Meets Precision
🔥 BTCUSDT.P: Liquidation of Highly Leveraged Longs
🌊 SOLUSDT.P: SOL's Dip - Your Opportunity
🐸 1000PEPEUSDT.P: Prime Bounce Zone Unlocked
🚀 ETHUSDT.P: Set to Explode - Don't Miss This Game Changer
🤖 IQUSDT: Smart Plan
⚡️ PONDUSDT: A Trade Not Taken Is Better Than a Losing One
💼 STMXUSDT: 2 Buying Areas
🐢 TURBOUSDT: Buy Zones and Buyer Presence
🌍 ICPUSDT.P: Massive Upside Potential | Check the Trade Update For Seeing Results
🟠 IDEXUSDT: Spot Buy Area | %26 Profit if You Trade with MSB
📌 USUALUSDT: Buyers Are Active + %70 Profit in Total
🌟 FORTHUSDT: Sniper Entry +%26 Reaction
🐳 QKCUSDT: Sniper Entry +%57 Reaction
📊 BTC.D: Retest of Key Area Highly Likely
This list? It’s just a small piece of what I’ve been working on. There’s so much more. Go check my profile, see the results for yourself. My goal is simple: provide value and help you win. If you’ve got questions, I’ve got answers. Let’s get to work!

Compound targets programmed
Possible Targets and explanation idea
➡️Cut all noise on chart. Open weekly chart
➡️Fib in play. Weekly retracement FIB. We came in -0.27 level (accumulation zone)
➡️White dashed line is main middle term stop losses. Play like magnet
➡️Trade under fundamental price (real value price) based on Take Profit indicator.
➡️Magnet Is take profit line of Take Profit indicator and Exit line (grab stop losses)
➡️You don't need make a lot of lines and drawings on chart to understand main trend and targets if you have a right tools
Hope you enjoyed the content I created, You can support with your likes and comments this idea so more people can watch!
✅Disclaimer: Please be aware of the risks involved in trading. This idea was made for educational purposes only not for financial Investment Purposes.
---
• Look at my ideas about interesting altcoins in the related section down below ↓
• For more ideas please hit "Like" and "Follow"!
