COMPBTC Breaks Descending Channel (Over 350% Mapped)Take a look at this descending channel... It has been broken and prices are now above the EMA21 line.
We are seeing bullish action develop since Nov. 5th.
The RSI is now looking good with bullish divergence and higher lows:
It is already moving higher, with lots of room left for additional growth.
Additional information and targets can be seen on the chart.
The red dashed-line works as the last low and can be used as a stop-loss as well. (We use manual stop).
Feel free to share your thoughts in the comments section.
Only hit LIKE if you enjoyed the content, it was useful to you in some way, or if you want to show some support.
If no, then don't hit like...
Namaste.
Compound

COMP $BTC - 200% Profit Potential!!BINANCE:COMPBTC
- Perfect Squeeze pattern in the works.
- Shorts will have to cover fast.
- A break of .008 Satoshi will indicate a bullish breakout.

long entry 1h COMPUSD resistance turns support. trend reversalbreakout of long time downwards trend. resistance turns support. entry for long

COMP/USDT 8h (Binance Fut.) Descending channel breakout & retest#Compound is pulling back to give us entry after that clear breakout of parallel channel.
I believe this is a new opportunity to long it before a possible bull run!
Current Price= 107.06
Buy Entry= 107.03 - 102.23
Take Profit= 116.77 | 123.26 | 133.20
Stop Loss= 96.51
Risk/Reward= 1:1.5 | 1:2.29 | 1:3.52
Expected Profit= +23.20% | +35.62% | +54.62%
Possible Loss= -15.52%
Fib. Retracement= 0.5 | 0.618 | 0.786
Margin Leverage= 2x
Estimated Gain-time= 480h

Possible trend reversal confirmation and next resistance levels*DISCLAIMER: I am not a financial advisor and this is not financial advice as these are purely my opinions and speculations. You should always do your own due diligence before trading or investing.
*Follow me for the latest cryptocurrency analyses on my watchlist
*Thank you to those who donated, I very much appreciate it.
*Let me know in the comment section if you agree or disagree, would love to hear your ideas too.

Can it hold above these KEY levels of support to go higher?*DISCLAIMER: I am not a financial advisor and this is not financial advice as these are purely my opinions and speculations. I do not guarantee any results nor am I responsible for your actions. You should always do your own due diligence before trading or investing in this market as it is extremely risky.
*Follow me for the latest cryptocurrency analyses on my watchlist
*Thank you to those who donated, I very much appreciate it.
*Let me know in the comment section if you agree or disagree, would love to hear your ideas too.

✳️Compound/USDT (27/10) #COMP $COMP #COMPUSDTCOMP is continuously breaking the lowest levels so we should not expect too much on this coin.
Currently, selling pressure has subsided and COMP is looking to rebound with Inverse Head & Shoulders. This pattern will be formed if the COMP fails to break the 92$ bottom and bounce back to break the 108$ zone. The target is the 120$ zone.
The main trend of COMP is currently moving sideways in the 90-120$ zone.
COMP will continue to bottom out if it breaks below 90$

COMPOUND Analysis .... Looking at the chart here COMP is likely to go on a strong uptrend IF it closes the daily candle above $110.
MACD and RSI are also providing lots of space to run.
I can only see it going upwards from here if it close above $110.
SL at 104.

COMP 1D. Next Potential Bottom Range is $72-80.Briefly about the protocol. The Compound Platform is a Defi lending project developed on the Ethereum blockchain. Basically, any cryptocurrency owner can deposit it into a smart contract, where it joins the liquidity pool and starts generating interest.
So far, the Compound protocol supports the following altcoins : ETH, DAI, SAI, USDC, USDT, WBTC, ZRX, BAT, REP.
We have seen a strong downtrend since September. However, there was a light at the end of the tunnel! After sellers tested the mark $94. The price exited the falling channel and attempted to break the level $107.5, which would open the way to $123.
However, it could not be done and the light went out at the moment.
In our opinion, the scenario of the COMP price returning to the falling channel is more realistic. Moreover, we think that the token will renew its historical low and stop in the range $72-80.
An alternative scenario is possible only after fixing above $107. If we see such a probability, we will immediately publish an idea about it!
________________________
Each " like under the idea" boosts the level of our happiness by 0.05% . If we help you to be calmer and richer - help us to be happier :)

Compound (COMP) - October 10Hello?
Hello, traders.
"Like" is a huge force for me.
By "following" you can always get new information quickly.
Thank you for always supporting me.
-------------------------------------------------- -----
At this time, the downtrend cannot be seen as overflowing.
You have to wait until you get the same flow as A.
You need to make sure it can move like the B flow shown on the Volume indicator.
I think we can say that we are out of the downtrend by going sideways by rising above 162.08 points on the current chart.
-------------------------------------------------- -------------------------------------------
** Check support, resistance, and abbreviation points.
** Support or resistance is based on the closing price of the 1D chart.
** All explanations are for reference only and do not guarantee profit or loss on investment.
Explanation of abbreviations displayed on the chart
R: A point or section of resistance that requires a response to preserve profits
S-L: Stop-Loss point or section
S: A point or segment that can be bought for generating profit as a support point or segment
(Short-term Stop Loss can be said to be a point where profits and losses can be preserved or additionally entered through installment trading. You must trade from a short-term investment perspective.)

COMP/USDT 8h (Binance Fut) Descending channel on midline support#Compound retracement is almost over, be ready for uptrend soon!
Current Price= 105.43
Buy Entry= 107.19 - 103.59
Take Profit= 116.79 | 127.66 | 135.99
Stop Loss= 93.99
Risk/Reward= 1:1 | 1:1.95 | 1:2.68
Expected Profit= +10.82% | +21.13% | +29.04%
Possible Loss= -10.82%
Fib. Retracement= 0.382 | 0.618 | 0.786
Margin Leverage= 1x
Estimated Gain-time= 360h

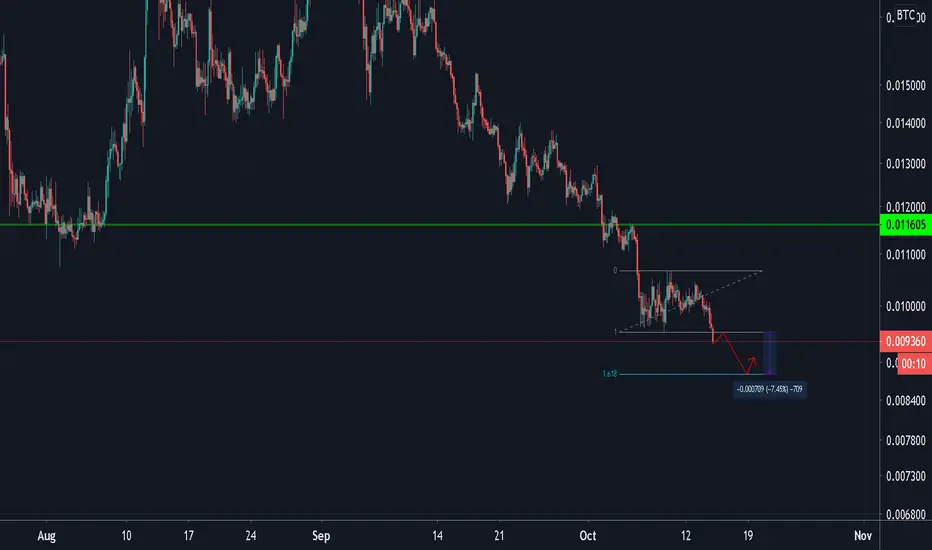
COMP/BTC (4H TF Bear Flag?)💎Technical Analysis Summary💎
BINANCE: COMPBTC
-After breaking the key level of support at 0.0116 sat
-The price keeps falling and now it is also breaking its local support
-This could be a small Bear flag that could fall the price down to 0.0088 sat
-If you are waiting for a trend reversal, it might take more days or even weeks
-But if you are playing on the Bearish side
-This might be a trigger event on your strategy
A big Thanks for donating 💰 via Tradingview coins this week to billstenzel 🙏🎉
``````````````````````````````````````````````
Trading Involves High Risk ⚠️
Not Financial Advice 💸
Please Exercise Risk Management 💱
``````````````````````````````````````````````
Thank You All!🙏😊💖For Supporting My Channel 📺
Through Leaving A Thumbs Up, Comment & Follow 💬
Happy Trading!😊💕💖
``````````````````````````````````````````````
Looking for THESE confirmations of a reversal*DISCLAIMER: These are purely my speculations and not financial advice. You should always do your own due diligence before trading or investing.
*Follow me for the latest cryptocurrency analyses on my watchlist
*Thank you to those who donated, I very much appreciate it.
*Let me know in the comment section if you agree or disagree, would love to hear your ideas too.

COMPUSDTCOMPUSDT
Daily:
-Bull Div in play
-Watch out for breakout in coming days
-Falling Wedge
Entry: 107-109
TP1: 124
TP2: 151
TP3: 180
SL: 97


Bullish signals invalidated - expecting more downsideThe current situation:
1. Price action previously formed a double bottom on the 4HR chart, but once it got to the neckline at about 124 USD, it was rejected and apparently does not have the strength to break out. Currently, it looks more like a double top with a measured move of 110 USD from the neckline at about 117 USD.
2. There was bullish divergence on the 4HR chart, but that did not seem to have played out strong enough to get above the double-bottom neckline.
The bullish case: price action retries and breaks the double-bottom neckline towards and goes towards the measured target of about 132 USD
The bearish case: price action breaks below the double-top neckline and goes toward the measured target of 110 USD
*Thank you to those who donated, I very much appreciate it.
*Let me know in the comment section if you agree or disagree, would love to hear your ideas too.
*These are purely my speculations and not financial advice. You should always do your own due diligence before trading or investing.

Future of learning and education with $CHGGTA
-120EMA Support. High volume at $62 level.
- Early May 2020 shows double the volume from the previous highest volume day= Institutional accumulation. Average volume 2.8M. May 5th volume : 38.5M
- Distribution volume slowing down
- RSI reversal
- MACD golden cross
- Strong relative strength
FA,
- Integrated platform = Chegg study+ Chegg Writing+ Chegg Math solver + Chegg tutors + High quality future proof skills based courses
- Structural tailwind with e-learning/self-learning.
- Yahoo finance Growth rate : 25%+. Simply wall street growth rate : 68%
- FY15 to FY20 CAGR revenue 39%
- Accelerating Earnings, revenues and margins in consecutive quarters(Almost Code 33)
- Growing subscriber base= Network effect with more tutors and students
- High growth and high margin. FCF positive
- Good management
Current subscribers of 3.9M with 29% YoY growth. Total opportunity at 102M subscribers
- Baillie Gifford ownership : 11%. High quality fund ownership + Growing institutional ownership. #smartmoney
Concerns,
-Increased competition : Amazon, Khan Academy, Open study, Linkedin
- Physical textbooks are a thing of the past.
- Debt of 900M and interest coverage of 1.09. However, Cash is at 700M with a healthy current ratio of 8+
Added at $72.


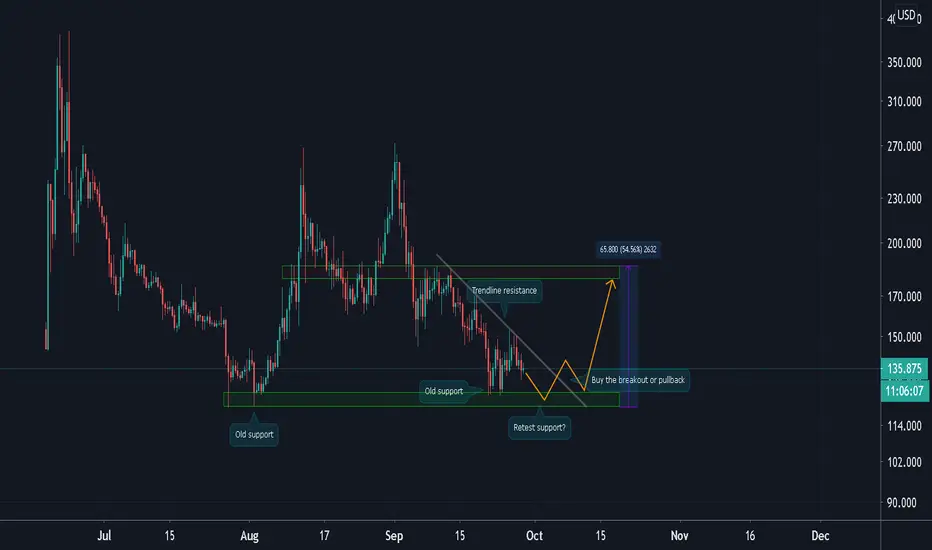
COMP/USD (Retest Key Area of Support?)💎Technical Analysis Summary💎
FTX: COMPUSD
-Compound Token is unable to break the trendline resistance
-It is facing rejection and might retest key level of support at 120s area
-My advice is to wait for the proper upside breakout before planing your entry
-You may look to enter with momentum breakout or wait for a pullback
-The upside potential is up to 180s area of higher
``````````````````````````````````````````````
Trading Involves High Risk
Not Financial Advice
Please Exercise Risk Management
``````````````````````````````````````````````
If You Like My Daily Published Ideas
A little Help By Supporting My Channel
Through Leaving A Thumbs Up, Comment & Follow
Happy Trading! --> Thank You! :)
``````````````````````````````````````````````
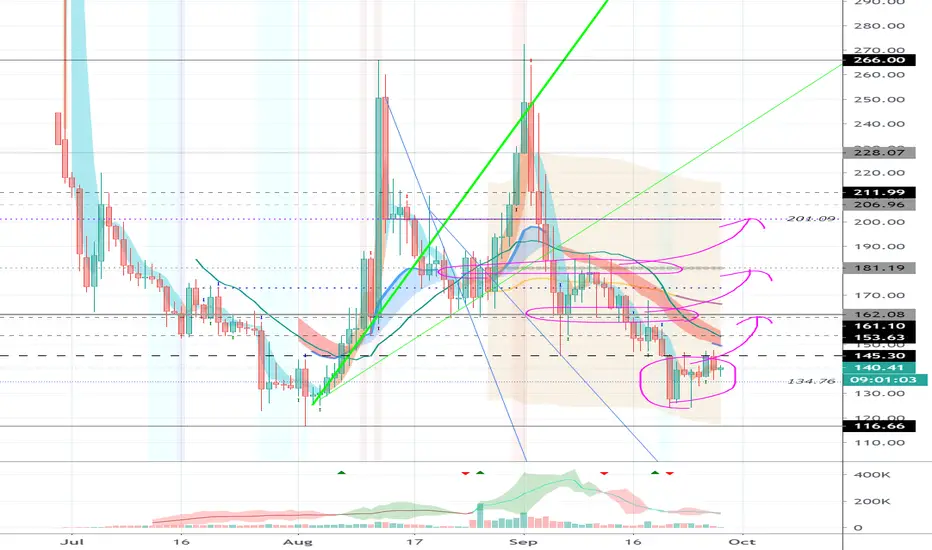
Compound (COMP) - September 28Hello?
Dear traders, nice to meet you.
"Like" is a huge force for me.
By "following" you can always get new information quickly.
Thank you for always supporting me.
-------------------------------------------------- -----
It remains to be seen if it can rise above the 145.30 point to form a double bottom.
We should also see if we get support at 145.30 and climb, allowing for a cascading climb as shown in the chart.
The important point in our current location is at 162.08.
If you climb above the 162.08 point and get support, I think it is possible that the bottom section has been formed.
-------------------------------------------------- -------------------------------------------
I think it is a period of volatility from September 21st to October 1st.
Therefore, I think careful trading is necessary.
About October 28, when maximum volatility is expected to occur, is about a month left.
The most important thing is to generate revenue, so I think it's time to trade to earn money.
** Check support, resistance, and abbreviation points.
** Support or resistance is based on the closing price of the 1D chart.
** All explanations are for reference only and do not guarantee profit or loss on investment.
Explanation of abbreviations displayed on the chart
R: A point or section of resistance that requires a response to preserve profits
S-L: Stop-Loss point or section
S: A point or segment that can be bought for profit generation as a support point or segment
(Short-term Stop Loss can be said to be a point where profits and losses can be preserved or additionally entered through installment trading. You should trade from a short-term investment perspective.)

comp/usdt compound double bottom #long #bullishcomp/usdt dumped hard recently from 270$ to 125$
now its trading around 143-144
double bottom is clear in chart
we will buy the break of resistance around 148$
entery now at 144 is higher risk
targets :
152.5
159
165
175
after you buy stop should be 4H candle close below 137.98
good luck
if you like my ideas hit like button and follow
show your opinion in comment section below
