COMPUSD Ranged trading and buy if this level breaks.Compound (COMPUSD) is rebounding after the initial rejection on the 71.500 Resistance that goes all the way back to the August 10 2022 High. As long as it holds, we will trade within that and a Higher Lows trend-line. The 1D RSI pattern is identical to the January 15 - 30 peak formation, which also traded in range before the 1D MA50 (blue trend-line) broke and completed a nearly -40% decline.
As a result, if the 1D MA50 breaks again, we will calculate a rough -40% decline from the last High, most likely that will be around 45.000.
A 1D candle close above the Resistance though, will be a bullish break-out for us and we will target a potential 1W MA100 (red trend-line) test at 100.000.
-------------------------------------------------------------------------------
** Please LIKE 👍, FOLLOW ✅, SHARE 🙌 and COMMENT ✍ if you enjoy this idea! Also share your ideas and charts in the comments section below! **
-------------------------------------------------------------------------------
💸💸💸💸💸💸
👇 👇 👇 👇 👇 👇
Compound

COMPUSDT.PIt`s almost time for another LONG entry .
We wait for the system to give us an entry signal.

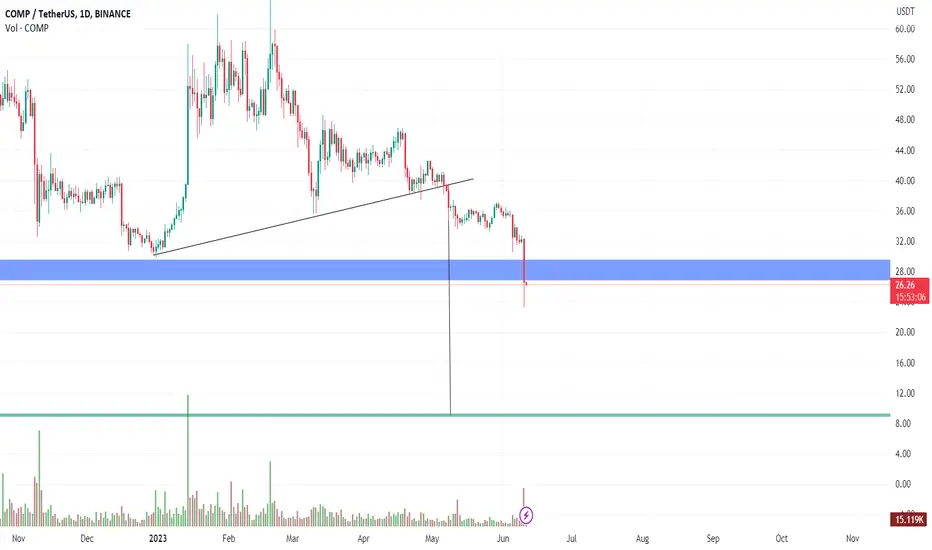
Double top.Assuming it’s a double top, if we don’t see a strong breakout with high volume above $71
We can expect a drop to at least $45
A bounce and possibly lower to around $35 but $42-$45 is a good entry point for a scalp
Keeping in mind Comp All time high was $915, we see strong rejection around $71 but is a drop in the bucket compared to what it could be in the next bull run.
With a 52% increase within the week and a 80% increase within the month
Anything above $71 could trigger another push
However on the daily we are currently overbought.
Good luck and have fun with it!

COMP, CELOHello?
Traders, welcome.
If you "Follow", you can always get new information quickly.
Please also click "Boost".
Have a good day.
-------------------------------------
(COMPUSDT chart)
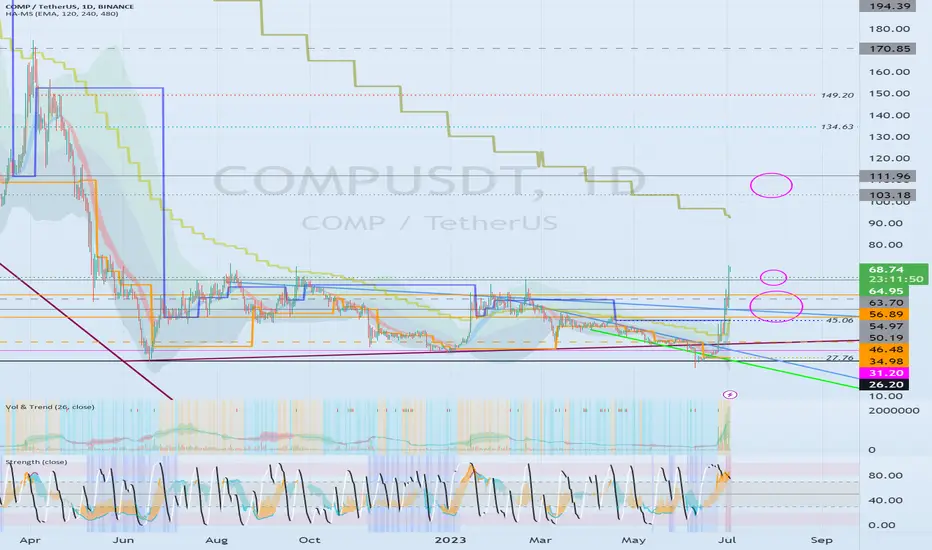
Looking at the 1M chart,
If the price holds above 63.70, a move up to the 111.96 point is likely.
Looking at the 1D chart,
We need to make sure that it is supported around 63.70-64.95.
If it declines, you should check for support near 46.48-56.89.
-------------------------------------
(CELOUSDT chart)
Looking at the 1M chart,
A volume profile section is formed at the 1.469 point.
Therefore, it is expected that the full-fledged uptrend will begin only when it rises above 1.469.
However, since the HA-Low indicator on the 1M chart is formed at the 0.774 point, buying is possible when it is confirmed that it is supported around 0.774.
Looking at the 1D chart,
The HA-Low indicator of the 1W chart is formed around 0.536.
Therefore, the key is whether it is supported and rises around 0.517-0.536.
Once supported and started to rise,
1st: 0.670-0.711
2nd: 0.774
Split selling is possible when resistance is received near the 1st and 2nd above.
However, since it is currently within the downtrend channel, there is a possibility that the upside may be limited, so it is necessary to be cautious in trading.
(CELOKRW chart)
Looking at the 1M chart,
Looking at the distribution of trading volume, it is expected that a full-fledged upward trend will begin when it rises above the 1035 point.
Looking at the 1D chart,
It is located at point 716 of the HA-Low indicator on the 1W chart.
Accordingly, the key is whether it can be supported around 716 and rise above 762.
If the price holds above 762, it is expected to break out of the downtrend channel.
However, since the volume profile section is formed up to the 1035 point, it is expected that the rise will be limited.
Accordingly,
1st: 847
2nd: 976-1035
Split selling is possible when resistance is received near the 1st and 2nd above.
Below 675 is not an easy area to trade, so we recommend waiting until it rises above 675.
-------------------------------------------------- -------------------------------------------
** All descriptions are for reference only and do not guarantee profit or loss in investment.
** Even if you know other people's know-how, it takes a considerable period of time to make it your own.
** This is a chart created with my know-how.
---------------------------------

COMPUSD: Closed over the 1D MA200 flashing a strong buy signalCOMPUSD closed the 1D candle yesterday over the 1D MA200 for the first time since April 18th, giving a strong buy signal despite turning overbought on the 1D time frame (RSI = 73.112, MACD = 1.660, ADX = 54.712).
We are taking a buy here, targeting the 0.786 Fibonacci level (TP = 55.000).
## If you like our free content follow our profile to get more daily ideas. ##
## Comments and likes are greatly appreciated. ##

COMPUSDTI put my last chart about COMP in down this chart.
It must touch green line for a great rise.
Nice risk/reward ratio for COMPCOMP is currently chilling at daily support level and right at the bottom side of the huge triangle, showing RSI divergence on 4h and 1d time frames. Giving possible upside move with more than 50% and small risk with stops below support & trend line could be a nice play.

thenexxtrade Alpha Strategythenexxtrade Alpha Strategy
Annualized Return : 17.9%
Sharpe Ratio : 1.27
Sortino Ratio : 2.67
Max DD : -11.4%
Volatility : 10.5%
I am not complaining!

COMP to MOON#COMP is preparing for breakout and rise to $173.
Take long position after breaking trend line.


COMPETH - Watch this Travel to Lower Edge of ConsolidationWe've some seriously strong trades from CTv2 with COMPETH over the last 12 months - and this 10% short could be another one!
With the price having recently been rejected creating a descending trend line and the price dropping below a historical level of support/resistance; it looks like we've once again entered the consolidation area which the price has ranged in numerous times before.
There'll inevitibly be some choppiness to this trade but we're pretty confident we'll very soon see the price hit the lower edge of this consolidation zone, offering a nice 10% profit in this short trade from CTv2 as it goes!
If you enjoyed or agree with this idea - drop us a comment, like & follow! :)

✅ THE ULTIMATE BEGINNER'S GUIDE TO INVESTING 👊There are a lot of myths surrounding investing. Some say that it is too complicated for a beginner, and you can't figure it out on your own. Others portray the image of a successful investor who travels all the time and does almost nothing. So, let's find out how things really are.
What Is Investing?
Investment is the long-term investment of funds, finances and other capitals in a variety of instruments in order to generate income in the future. Furthermore, there are two types of investments in relation to objects of investment. The first type is investment in the real sector (real investments). However, the subject of today's article is related to the second type of investment - financial investments, not investments in the real sector. Let's dot all the i's and and cross the t's to define with you what we mean by financial investments.
Financial investments are long-term investments of finances in securities, shares, bonds, mutual funds, precious metals and other derivative instruments of securities.
Financial investments are also called portfolio investments. Portfolio investing means that an investor can invest in several financial instruments at once, thus forming a specific "portfolio of investments. A portfolio helps an investor to diversify his risks, that is, even if there is a completely failed investment, the investor is able to offset his losses at the expense of more successful instruments from his portfolio.
Structure Of The Financial Investment Market
Before considering investing and financial instruments, it is necessary to understand how this market is structured. The structure of the financial market can be divided into three main segments:
-Stock market
-Debt market
-Foreign exchange market
The stock market is where shares of various issuers and other derivatives that give the right of ownership are traded. The debt market, also called credit market, is characterized by investments in debt instruments, such as government and corporate bonds. It is generally believed that the debt market is the most risk-free and conservative, but low-yielding way of investing, the yield on which will not exceed, and often coincide with the yield on a bank deposit. Here much depends on whose bonds you invest in and at what point. The third and extreme segment in this classification is the foreign exchange market, where it is possible to purchase contracts (both options and futures) for the purchase of currency in the forex market.
In addition, in recent years, a new market is beginning to take shape - the cryptocurrency market. Due to the popularity and rise in the value of Bitcoin, this market has expanded significantly in 2016-2017 and more and more types of cryptocurrencies are coming to the market.
Why Should You Invest Money?
The question of why to invest in various financial assets often arises in people who are just beginning to become interested in ways of making passive income. One could say that this skill belongs to the obligatory skills of a person who wants to come to success, just as one used to need to know how to speak French or ride a horse.
Another thing is that the vast majority of people spend almost all of their money on daily expenses - food, clothes, rent, and often credit as well. This is a kind of dependence on the bank, the state, and the place of work. And professionalism in one area or another is not yet a guarantee of good profits.
Everyone in the modern world just needs to learn how to manage their finances and how to multiply them. Almost everyone periodically thinks about saving and achieving financial freedom, providing a peaceful old age, and investing in the future of their children.
A certain role is played by the state, allocating pensions to elderly people from the pension fund, in which accumulated amounts of deductions from wages for a lifetime. However, the size of pensions is known to all - it is simply impossible to provide a decent old age for them. Many pensioners who have worked all their lives live on the brink of poverty.
Why is the situation different in developed countries? Older people travel around the world and live life to the fullest. And these are not celebrities or oligarchs - they are ordinary average people.
The answer lies in the fact that investments play a huge role in people's lives in developed countries. Up to 80% of Americans invest in shares of large companies and receive dividends on them.
The question of why they need to invest does not arise there - they start investing at a young age. It is enough to look at the figures:
In the US the volume of investments in investment funds is twice as much as the volume of bank deposits;
In Europe, the volume of investments in investment funds is five times less than the volume of bank deposits.
Moreover, do not forget that the investor gets an opportunity to receive dividends from shares - investment income, which in the long run may exceed salaries by several times.
Investing For Beginners: The Power Of Compound Returns
In simple terms, compound return is the re-investment of profits earned during previous successful investments. The process can be represented as the use of dividends, interest paid, and other income distribution options.
Depending on the share of reinvested funds from the total amount of profits, a distinction is made between full or partial reinvestment. It is impossible to predict in advance the profitability of reinvestment, but the investor can control the process by adjusting the timing, amount, selected instruments, and external circumstances.
Reinvestment is the practice of using dividends, interest, or any other form of income received as a result of investments, to obtain new profits through the purchase of shares, units, or other assets, instead of just spending what is earned.
Let's take a closer look at the principles of reinvestment and the factors that affect its result.
If you're planning to reinvest profits to increase your overall income, consider how to do so with minimal risk of loss while earning a steady income. To increase the chances of successful reinvestment, stick to three basic principles:
Use only available funds to invest. If you're not sure you'll need some or all of the money you're investing shortly, don't reinvest profits. For reinvesting, take as much money as you can set aside for the long term.
Diversify your investments. The golden rule for investors is to diversify their capital by diversifying their financial instruments. A balanced portfolio is the best protection against sudden market movements and losses. While one asset falls in value, the rest grow and generate income.
Make sure that investments generate income without exposing your entire capital to excessive risk. A professional investment manager can help with the selection of tools and investment strategies if there is no possibility to study the intricacies of stock trading independently.
As in the case of initial investment, reinvestment should be made competently, choosing the safest and most promising assets, and avoiding excessively risky transactions.
Any action by an investor must produce an ultimate return. You can receive dividends and spend them on your personal needs, or use the extra profits to multiply your invested capital.
Sometimes the external conditions for investments are not so favorable, and an investor prefers to wait out a dangerous period, withdrawing all assets into currency. Such behavior was demonstrated by Warren Buffett, 89, who decided in 2020 to get rid of assets, including investment bank Goldman Sachs, American carriers, and go into "cash", despite positive market dynamics and a relatively weak dollar. This decision analysts explain the preparation of the guru of investments to the stock crash, incomparable even with 2008 when Buffett has maintained an optimistic view of U.S. assets.
The decision on the advisability of reinvestment is based on some factors:
Inflation rate. If money is depreciating rapidly, reinvesting means trying to catch up with inflation while trying to maintain the same capital value. In a hyperinflationary environment, it makes no sense to wait for an investment to yield a limited return or to result in a loss due to the loss of value of the money invested.
Affordable financial instruments. The recent top assets for reinvestment include real estate, currency, and deposits. As the stock market develops, the center of attention has shifted toward stocks, bonds, and indices. U.S. stocks are growing in popularity, with different stock exchanges providing access to them.
Risk appetite. Some companies prefer to close their positions or limit investments to reduce possible negative consequences. Others are prepared to keep risking for the sake of profitability.
Every financial instrument has its profitability and risk limits. The higher the projected return on reinvestment, the more justified this step is.
The situation in the economy can facilitate or limit opportunities for investing and reinvesting. The worse things are in the country's economic sector, the less reason to reinvest profits.
In addition to objective factors that influence the decision to reinvest income, there are subjective features of a person and his circumstances that make him agree or refuse to make further investments.
A person invests his earnings where he can earn the most profit. As a rule, the decision to reinvest is made based on an analysis of alternative returns. If a person buys a car for $100,000 instead of opening a bank deposit with the profits he earns, it means that in addition to that amount over the 5 years the car will lose the amount of unaccrued interest - for example, 5% for each year. And instead of owning a car worth $100,000, one could earn $128,000.
Timing The Market: What Investment Returns Can You Expect?
On the whole, we can say that the world economy is growing at about five percent a year. Of course, in dollars.
Slightly lower should be the currency yield from investments in bonds, but their use is assumed only as a reserve, not strategic growth.
Is it possible to earn more? Yes, if something important happens: technological advances, breakthroughs in new industries - and the investor is at the root of it. Those who first appreciated the prospects of switching from coal to oil in the past are some of the richest clans on the planet today, such as the Rothschild clan. You do not have to go far, it was enough to assess the prospects for the development of electronics and, in particular, computer technology thirty years ago - and we can say a billion is already in the pocket.
Let's look at examples, of how much could be earned on different types of investments. The average annual return on the S&P 500 over the past ten years is about 13.6%. Thus, if an investor were to put into his portfolio the same securities that make up the index, he would get a much higher return than on a deposit in a bank.
During the same period, credit institutions attracted deposits at 4-5 percent. And in the bond market for government securities, the yield was, as we see from the previous example, 5.2 percent per annum. The yield on corporate bonds was even higher - 6-10 percent, depending on the reliability of the companies.
Thus, having placed money through a broker at the exchange, the investor could count on the bond market, if not twice, but one and a half times more than in the bank. At the same time, of course, such investments are not subject to deposit guarantees.
But, on the other hand, if you buy bonds from major companies, their existence is ensured at least access to raw materials. Behind them, unlike credit institutions, there are usually real production assets that generate stable revenues.
And what about other types of investments? Analysts of the real estate market say that properties have risen in price by more than 16% over the year. But these figures should be treated with extreme caution:
Firstly, realtors always, under all circumstances, claim that prices are going up, even if the trend is the opposite.
Secondly, the posted proposals - it is not the real price of an object, to sell something, the cost must be discounted, which remains at the level of non-public agreement between the seller and the buyer. The real estate market is much less transparent and not as liquid as the stock market.
In addition, the cost of admission varies significantly. Investments in real estate most often require at least a few hundred thousand, if it is not a collective scheme, while for the purchase of the same bond on the New York Stock Exchange just a thousand dollars is enough.
It must be said that one of the most profitable types of investment in 2021 was simply buying foreign currency. The dollars rose by more than 20% and the euro by almost 30%.
This suggests that those who invested money in instruments denominated in foreign currencies managed to make the most money on investments. Even though the interest initially looked more than modest.
How Much Money Should Beginners Invest?
The fact is that any investment activity involves a certain risk. Therefore, before engaging in investment activities, it is necessary to create the proverbial financial safety cushion.
This should include all mandatory payments, medicine, food, and even entertainment. Otherwise, an unsuccessful start in investing and the difficulties you will encounter in the absence of a "cushion" will most likely discourage you from continuing to learn to be an investor, and it rarely works out well for anyone the first time.
So, you already have a financial safety cushion. Now you need to invest the first sum of money. But the size of that amount will predetermine the type of instruments available to you. If the bonds have a face value of 50 dollars (please note that we will not take into account brokerage commissions, because our discussion is about the principle of approach to the first investment), then having this very $50, you can go and buy bonds? No, not really! The minimum investment required to purchase a single bond is about $1,000, though bonds are generally sold in $5,000 increments.
You can buy shares for $500 since their prices can start from $10. However, it would be rather unethical of us to recommend to a beginning investor to start investing in such a risky instrument as stocks. The dividend yield on them is not guaranteed, and no one can promise an increase in the price.
This is why our logic leads us to believe that one should begin investing with an amount of about $1000-$3000. Moreover, we advise such a trick. Put every "extra" amount of money on a separate account, not a brokerage account, but a time deposit account with the ability to deposit and withdraw partially, you can even do it on the same account where you "lay" a safety cushion. As soon as you manage to accumulate "extra" $3000, i.e. you don't need them for other vital necessities, you have to withdraw them, transfer them to the brokerage account and buy the next portion of the securities.
Yes, stocks are cheaper and sometimes sold by the lot, but we wouldn't recommend starting with them. Start filling your portfolio with corporate bonds, and try investing some in stocks, let's say 10% of your capital. 10% is an insignificant amount in case of loss, but in case of high returns, can significantly raise the average return of your portfolio.
How Can You Start Investing?
When you finally decide to start investing, you might be wondering what steps you should take. Here are our recommendations:
Decide on an investment horizon. When it comes to bonds, the stock market has a conventional division into short-term securities and long-term securities. For example, Federal Loan Bonds are limited to a specific term (3, 5, 7, and even 10 years). Shares, on the other hand, are considered indefinite assets. They exist as long as the company operates and remains public.
Choose an investment instrument. Decide where best to invest your money. An investor decides which securities he will buy, whether he will invest in business development, entrust his savings to a mutual fund and management company or simply open a deposit in a bank.
Be guided by risk and return. Fixed-income securities (like federal bonds) are considered less risky than stocks and bonds issued by businesses.
To make it easier for you to choose the right investment instrument, first determine your risk profile. This is the type of behavior you have in the financial market. It will take into account your goals, desired returns, investment horizon, and risk tolerance. Depending on your risk attitude, your risk profile may be conservative, rational, or aggressive. Conservative investors prefer low-risk instruments with small returns, aggressive investors are willing to risk capital for the sake of high potential returns, and rational investors choose the golden mean.
The Beginner's Guide To Where To Invest Your Money
By definition, it is necessary to invest in something. There are a great many options where you can invest your capital. Among the most common instruments, we should note the following:
-shares
-bonds
-investment funds
-real estate
-own business
Let us consider different ways to invest your capital according to the risk appetite.
Instruments for the conservative investor
A conservative investor who is not prepared for possible losses can include low-risk instruments in his investment portfolio: bonds, bond exchange traded funds (ETFs), real estate investment funds, deposits, as well as structured products with full capital protection and ISH.
Most often, it is recommended that beginning investors work with conservative instruments at first, and then add other instruments to their portfolios over time.
Instruments for the aggressive investor
Aggressive investors, i.e. investors who are ready to risk a considerable part of their capital for the sake of high potential profitability, invest their entire portfolio in stocks, derivatives (futures, options) and structured products without capital protection.
Such investors often have extensive experience in the stock market, a large amount of capital and will be able to survive a failure painlessly.
Instruments for the moderate risk investor
An investor with a moderate risk profile combines high-risk instruments with conservative ones. Adding conservative instruments to the portfolio reduces risks, while high-risk instruments allow for higher returns. The classic scheme: 50% of the portfolio in conservative instruments, 50% in high-risk instruments.
In addition to the above, the portfolio may also include precious metals in an investor-friendly form, equity ETFs (due to the greater number of shares in one ETF, equity funds are less risky), structured products and ISMs with partial capital protection.
With knowledge of all available financial instruments, each investor can choose the most appropriate ones for his level of expertise and experience, as well as for the comfortable riskiness. The main thing is to approach investments consciously, correlating each instrument to your financial plan and investment objective.
Potential Risks Of Investing
Risks can have an internal or external nature and are not always predictable. Their main types are:
Liquidity risk - the risk that interest in an asset will plummet and the value will be well below the purchase price;
Inflation - decrease in purchasing power and loss of liquidity of all assets;
Currency risk - decrease in the value of assets that are related to foreign currency;
Legal risk - change of risks as a result of changes in the regulatory framework.
There is also the possibility of force majeure, for example, man-made or natural factors. As a rule, they are stipulated in the contract with the investor as separate clauses. Other risks can be adjusted if you constantly monitor changes in the global and domestic financial markets. Another rule that can help reduce the likelihood of losses is the creation of an investment portfolio and its timely adjustment.
Still, there are some ways to reduce the possible risks.
It is easier to manage risks at the planning stage of a portfolio. It's impossible to reduce risks to zero, but a few simple principles will keep your investors and their capital as safe as possible:
Invest evenly in different types of assets. If you choose to invest in securities, invest in different areas.
Don't invest the last of your money. Always leave savings-a "safety cushion." If your assets depreciate, no one will pay you insurance.
Examine projects and assets carefully before investing. Invest in projects that have positive feedback from past investors.
Do not work with those who promise you huge earnings with no risk.
Do not give in to emotions. Act decisively and sensibly, without panicking at the slightest price movement.
Set yourself a limit on the maximum losses. Let's say you choose 25%. If your assets fall in price by 25%, you will sell them to avoid even greater losses.
The key to successful investing is to choose quality assets (reliable stable securities). You should not give in to gambling and invest all of your capital in risky projects.
What To Look For When Choosing An Investment Broker
Before deciding which broker will provide you with services, decide on your investment objectives: have you already decided what markets you are going to enter, and what assets would you like to trade? Before taking any step in investing, it is better to define your goals precisely. Now let's see what to consider when choosing a broker.
Step 1: Check the license
You need to start by checking if your broker has a license. Central banks regularly check the compliance of brokers and can revoke the license if any violations are found. If the license is revoked, the broker will suspend its work and must return the invested funds to the clients.
Step 2: Gather information from open sources
Familiarize yourself with the broker's website. It will be good to check the organization's data on financial performance. A little dive into the history of the company will not be superfluous. Check if there have been any legal proceedings, malfunctions, license suspensions - and for what reasons.
Check what has been written about the broker in the industry media, but do not forget to do fact-checking, i.e. pay attention to the reliability of the source and double-check the data.
Step 3: Check the fees and commissions
Brokers receive a commission on the amount of a transaction. Study the rates on the websites of different brokers. Large organizations usually offer several rate plans. To choose the most appropriate one, determine in advance what markets you plan to trade (stock, futures, over-the-counter) and how often.
Brokers may charge not only transaction fees, but also commissions for depositing and withdrawing funds, using a trading platform, submitting phone orders, and other fees. In addition, it is important to remember the existence of a subscription fee - if there is one, the broker will earn even in the absence of transactions. Consider custody services, which may be fixed and included in the brokerage fee or may vary depending on the number of securities.
Step 4 . Evaluate the convenience of the service
If you are planning to use a trading terminal, i.e. software for making transactions at the exchange - look at what kinds there are and how they work, which one is offered by the broker and whether you understand its interface.
Brokers now have mobile applications for trading. If they are available in the demo version - download and try it, in this way you will understand if the interface is convenient and if you feel comfortable working with the application.
Step 5: Check out the education and analytics sections
Training materials, investment ideas, analysis, and research articles and forecasts are useful for beginners and more advanced investors alike. Many brokers now offer articles, webinars, podcasts, video courses, and more to clients. This can be another factor that will make you pay attention to this particular organization.
Beginner's Tips To Get Started With Investing
It is impossible to completely avoid risk while investing in the financial market. Therefore, the investor is faced with the task - to minimize possible losses, at an optimal level of profitability concerning the goals and horizons of their achievement. For this purpose, studying the experience of famous investors and financiers is suitable. Here are a few tips to help avoid unnecessary mistakes.
Discipline
Even with minimal investments, a sequence of steps, analysis of the situation, and regular additions to the portfolio will lead to the desired income. Do not relax when you get the first earnings - it is better to reinvest them to achieve the goal as soon as possible.
Persistence and calmness
Everyone's journey is a series of ups and downs. Investors are no exception. A cool mind and control of emotions will not allow you to make mistakes in a critical situation. And the accumulated experience will help to avoid their repetition in the future.
The right environment
Communication with like-minded people will put you in the right mood, and monitoring market information and not only - will help you to navigate faster in the situation and make the right decisions. Reading professional literature, visiting topical forums and social networking pages - all will form your thinking.
Constant learning
The world does not stand still, and the world of investments is no exception. Self-education, observations of experienced colleagues, and reading financial literature will expand opportunities and open new promising directions.
Mistakes of beginning investors
It is not possible to avoid mistakes altogether - as in any business in which you are just starting. However, they can be minimized.
Lack of a safety cushion.
No one can guarantee your success in investing. If unforeseen circumstances arise, you must have a safety cushion of 3-6 months' salary.
Lack of funds for the beginning
Often brokers offer to begin from the minimum amount, say 300 dollars, however, such investments without additional permanent deposits will not be effective.
Lack of basic education
After studying, say, three books on the securities market and an economics textbook, many people start to feel self-confidence in the market. This is where the first serious errors begin, such as underestimating the risks or choosing sub-optimal instruments. Remember - knowledge must be gained, updated, and constantly expanded.
The desire to get rich quickly
In the search for super-profits, private investors can often meet crooks and all sorts of fraudsters on their way. A reasonable assessment of the prospects of income and the choice of well-known intermediary companies will reduce the risks as much as possible.
Using substandard sources
Sources of quality information are not difficult to find - to date has written many useful books and created a huge number of training materials.

Compound (COMP) formed bullish Gartley for upto 14.50% pumpHi dear friends, hope you are well and welcome to the new trade setup of Compound (COMP) token with US Dollar pair.
In previous trade setup, the priceline of COMP moved slightly down than potential reversal zone but recovered soon and then pumped well:
Now on a 4-hr time frame, COMP has formed a bullish Gartley move for another pump soon.
Note: Above idea is for educational purpose only. It is advised to diversify and strictly follow the stop loss, and don't get stuck with trade

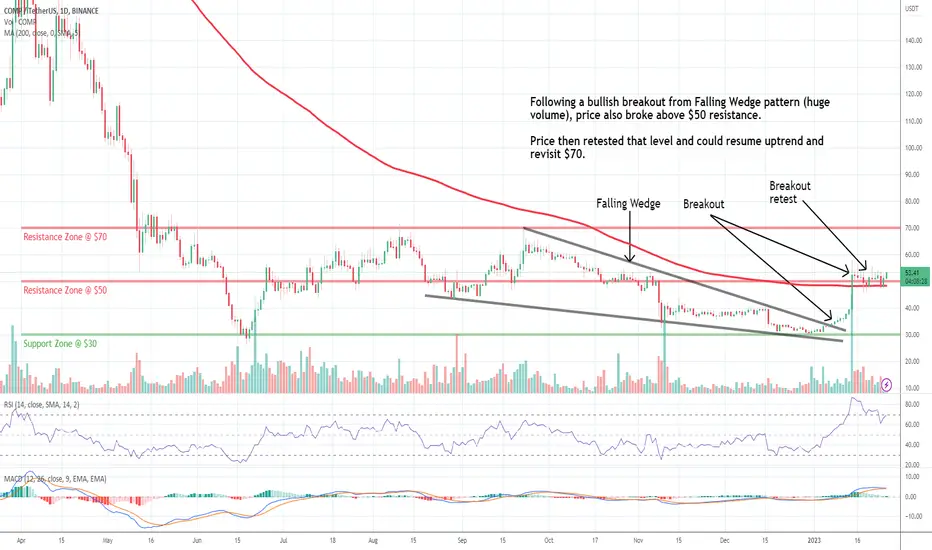
COMP: Resistance Breakout!Compound (COMP) technical analysis:
Trade setup : Following a bullish breakout from Falling Wedge pattern (huge volume), price also broke above $50 resistance. Price then retested that level and could resume uptrend and revisit $70. (set a price alert).
Trend : Uptrend on Short- and Medium-Term basis and Downtrend on Long-Term basis.
Momentum is Bullish but inflecting. MACD Line is above MACD Signal Line and RSI is above 55 but momentum may have peaked since MACD Histogram bars are declining, which suggests that momentum is weakening.
Support and Resistance : Nearest Support Zone is $30. The nearest Resistance Zone is $50, which it broke, then $70.
COMPBTC - A Chance of a Quick 10% ShortWe've had some massive gains with COMP over the last few years, plenty of 30%, 40% and even larger trades, a bit of confusion recently during a slightly more choppy period but profit's profit!
Crypto Tipster v2 is currently showing a Short signal and we could expect to see the price at least reach the nearest level of support at a few percent down, maybe reaching the incoming upward trend line which would take the price to around 10% below where it's currently sat.
If you enjoyed or agree with this idea - drop us a comment, like & follow! :)

#COMP - Short Scalp Opportunity#COMP - Short Scalp Opportunity
Entry Conditions:
- Bearish Divergence
- Looking to test lower support of range
- Flipped local trendline and retest
- Bearish Impulse Signal

COMP/USDT | Ready for Massive Breakout..!!
#COMP Descending Channel formation in the Daily timeframe..
Seems like Bottomed out & Ready for Breakout so Keep it under the Radar.
In Case of Upside Breakout, Expecting 3-4x Bullish Rally in the Midterm..
Bulls Need to Clear the 37$ Resistance to Confirm the Channel Breakout.
Please like the idea for Support & Subscribe for More ideas like this and share your ideas and charts in Comments Section..!!
Thanks for Your Love & Support..!!

✳️ Compound Descending Channel Followed by Bullish Wave (120%+)This little pattern here reveals what is coming to Compound.
#1 | Descending channel leads to rounded bottom followed by...
#2 | A bullish wave.
Now we have a strong higher low, a bullish RSI and market conditions improving.
#1 | The descending channel is present and lead to a failed consolidation that ended in a rounded bottom. This rounded bottom can be followed by...
#2 | A bullish wave.
40/50% potential on the first jump.
A total of 120% for the entire wave mapped on this chart.
Thank you for reading.
Namaste.

Compound (COMP) formed bullish Gartley | A good buy opportunityHi dear friends, hope you are well and welcome to the new trade setup of Compound (COMP) token with US Dollar pair.
On a 4-hr time frame, COMP has formed a bullish Gartley pattern.
Note: Above idea is for educational purpose only. It is advised to diversify and strictly follow the stop loss, and don't get stuck with trade

$70 in the next few days? or next week?Everything looks like its matched up for this to take off..... Thoughts?

COMP no positive signals but still in trendBINANCE:COMPUSDT
Locally no signals to buy or sell for COMP but for middle term if you looking for next few month COMP can pump over 100%
✅Before we start to discuss, I would be glad if you share your opinion on this post's comment section and hit the like button if you enjoyed it.
Thank you.
Possible Targets and explanation idea
➡️This fib still relevant since local top in April
➡️Traded under fundamental price and appeared Strong Buy signal in June by "Trade ON" indicator
➡️4 October appeared signal to Buy on Direction indicator. Strong Signal
➡️Now if market crash again buy line for Comp at 35.85 will be good enter point
➡️For local trades 71$ is good time to take profit on "take profit line"
➡️Middle term target is correction by this fib to 128$ (0.618 fib level)
➡️Globally with market supply of COMP I can expect price higher then 500 again
Hope you enjoyed the content I created, You can support with your likes and comments this idea so more people can watch!
✅Disclaimer: Please be aware of the risks involved in trading. This idea was made for educational purposes only not for financial Investment Purposes.
* Look at my ideas about interesting altcoins in the related section down below ↓
* For more ideas please hit "Like" and "Follow"!

COMP | Seems like Ready to FLY..!!
#COMP Descending Channel Formation in Higher timeframe Chart..!!
Major Trendline Resistance getting Weaker & Buying Volume Coming in, Expecting Breakout.
In Case of Upside Breakout, Expecting 2-3x Bullish Rally in the Midterm..
Please like the idea for Support & Subscribe for More ideas like this and share your ideas and charts in Comments Section..!!
Thanks for Your Love & Support..!!
