Compound vs TetherWe can see COMPUSDT moving above EMA50 today and higher low since late February.
Closing above $136 today can signal additional growth to come.
Namaste.
Compound

Compound Bullish BreakoutCompound is now starting to move vs Bitcoin.
We can see a strong recovery yesterday which pushed prices above EMA50 and EMA10.
We are seeing grow now...
We have potential for higher.
EMA50 is the support/stop.
Namaste.

COMPUSDT 1HR WK #15
50 ema is the area MM will either shift higher to test the 800or drop to form W pattern
vector candle breakout above daily cpr
POC sitting towards daily high
price 800 ema test possible retest ?

COMP - USDTCompound seems to be forming a new H-H after the previous downfall of the price. Waiting for a Fib retracement level 78.6% to LONG

COMP 1H SHORTBoth Price AND Volume have broken down on COMP 1 Hour.
There is a chance of retracement upwards to the Blue trendline on both Price + Volume Indicator (see both red circles)
The Short is waiting at 160.57 (Kucoin)
Good luck!

COMP (Compound) Token Analysis 04/03/2022Fundamental Analysis:
Compound is a DeFi lending protocol that allows users to earn interest on their cryptocurrencies by depositing them into one of several pools supported by the platform.
When a user deposits tokens to a Compound pool, they receive cTokens in return. These cTokens represent the individual’s stake in the pool and can be used to redeem the underlying cryptocurrency initially deposited into the pool at any time. For example, by depositing ETH into a pool, you will receive cETH in return. Over time, the exchange rate of these cTokens to the underlying asset increases, which means you can redeem them for more of the underlying asset than you initially put in — this is how the interest is distributed.
On the flip side, borrowers can take a secured loan from any Compound pool by depositing collateral. The maximum loan-to-value (LTV) ratio varies based on the collateral asset, but currently ranges from 50 to 75%. The interest rate paid varies by borrowed asset and borrowers can face automatic liquidation if their collateral falls below a specific maintenance threshold.
Since the launch of the Compound mainnet in September 2018, the platform has skyrocketed in popularity, and recently passed more than $1.2 Billion in total locked value.
According to Compound, the majority of cryptocurrencies sit idle on exchange platforms, doing nothing for their holders. Compound looks to change this with its open lending platform, which allows anybody who deposits supported Ethereum tokens to easily earn interest on their balance or take out a secured loan — all in a completely trustless way.
Compound’s community governance sets it apart from other similar protocols. Holders of the platform’s native governance token — COMP — can propose changes to the protocol, debate and vote whether to implement changes suggested by others — without any involvement from the Compound team. This can include choosing which cryptocurrencies to add support for, adjusting collateralization factors, and making changes to how COMP tokens are distributed.
These COMP tokens can be bought from third-party exchanges or can be earned by interacting with the Compound protocol, such as by depositing assets or taking out a loan.
Everything on Compound is handled automatically by smart contracts, which act to mint cTokens after Ethereum and ERC20 assets are deposited, and allow Compound users to redeem their stake using their cTokens.
The protocol enforces a collateralization factor for all assets supported by the platform, ensuring each pool is overcollateralized at all times. If the collateral falls below the minimum maintenance level, it will be sold to liquidators at a 5% discount, paying down some of the loan and returning the remainder to an acceptable collateralization factor.
This arrangement helps to ensure borrowers maintain their collateral levels, provides a safety net for lenders, and creates an earning opportunity for liquidators.
Compound was founded in 2017 by Robert Leshner and Geoffrey Hayes, both of whom previously worked in high-profile roles at Postmates — an online food delivery service. The two continue to hold executive positions at Compound Labs, Inc — the software development firm behind the Compound protocol, with Leshner currently serving as CEO, while Hayes is the CTO.
Though both founders have experience founding successful companies, Robert Leshner, in particular, has been particularly active in helping to grow the blockchain space, and has publicly invested in popular crypto platforms including Argent Wallet, Opyn, and Blockfolio.
The Compound team now comprises over a dozen individuals — almost half of which work as engineers.
Like many digital assets, only a fixed number of COMP tokens will ever come into existence. The total supply is capped at 10 million COMP and as of writing, less than 67% are in circulation (~6.7 million).
Out of these 10 million tokens, just over 4.2 million tokens will be distributed to Compound users over a 4-year period. The second biggest allotment (almost 2.4 million COMP) goes to the Compound Labs, Inc shareholders, whereas 2.2 million tokens will be distributed to the Compound founders and current team with a 4 year vesting schedule.
Finally, 775,000 COMP are reserved for community governance incentives and the remaining 332,000 tokens will be allocated to future team members.
The exact rate of COMP emission is subject to change over time, as voters are able to increase or reduce the emission rate by passing a proposal through community governance.
The current CoinMarketCap ranking is #90, with a live market cap of $1,021,434,119 USD. It has a circulating supply of 6,686,099 COMP coins and a max. supply of 10,000,000 COMP coins.
We have analyzed the Market Capitalization of this Asset:
Technical Analysis:
Looking at the current Price Levels, we can easily notice that the Price is Reneging below the 78.6% Fibonacci Level, and had fallen to the lower levels such as 85% and even 90%. these levels can be counted as the Undervalue or discounted Levels.
There exist Bullish Divergence of Price Value and MACD , which the sign of bearish trend reversal and start of the new Bullish trend which may lead to the new Economical Cycle.
There are Total of 3 Targets defined by the Average Confluences of the Fibonacci Expansion and Fibonacci Trend Base Extension. these confluences Points can even be counted as the Major Pivot Points .
The 3 TP gets its confirmation as the Bullish trend Triggers the 2 TP followed by some Price correction and Reaccumulation. on its Up Formation rally.
Currently the Price Value is at 85% Retracement level from its ATH; it means that, it has broken the 85% Retracement as the Resistance level and had rechecked it backed and it has been Proved to be the support area .
The Fibonacci Tools have been Drawn From 0$ to the ATH, so the Specified Levels are well Defined and Proved.
The Asset is at the Accumulation Level Currently, which means soon the smart many will Flow in it and the Price Value will get Pump and Appreciates.
Probably we may not again see this 90%, 85% Retracement Level or bellow in the current cycle.
Our Past Analysis:
Initial Acquisition:

COMP (Compound) Token {Market Cap} Analysis 03/04/2022Fundamental Analysis:
Like many digital assets, only a fixed number of COMP tokens will ever come into existence. The total supply is capped at 10 million COMP and as of writing, less than a third are in circulation (~3.3 million).
Out of these 10 million tokens, just over 4.2 million tokens will be distributed to Compound users over a 4-year period. The second biggest allotment (almost 2.4 million COMP) goes to the Compound Labs, Inc shareholders, whereas 2.2 million tokens will be distributed to the Compound founders and current team with a 4 year vesting schedule.
Finally, 775,000 COMP are reserved for community governance incentives and the remaining 332,000 tokens will be allocated to future team members.
The exact rate of COMP emission is subject to change over time, as voters are able to increase or reduce the emission rate by passing a proposal through community governance.
The current CoinMarketCap ranking is #90, with a live market cap of $1,021,434,119 USD. It has a circulating supply of 6,686,099 COMP coins and a max. supply of 10,000,000 COMP coins.
Technical Analysis:
There exist Bullish Divergence of Price Value and MACD , which the sign of bearish trend reversal and start of the new Bullish trend which may lead to the new Economical Cycle.
There are Total of 3 Targets defined by the Average Confluences of the Fibonacci Expansion and Fibonacci Trend Base Extension. these confluences Points can even be counted as the Major Pivot Points .
The 3 TP gets its confirmation as the Bullish trend Triggers the 2 TP followed by some Price correction and Reaccumulation. on its Up Formation rally.
Currently the Price Value is at 78.6% Fibonacci retracement level; it means it has broken the 78.6% Fibonacci Retracement as the Resistance level and had rechecked it backed and it has been Proved to be the support area .
The Fibonacci Tools have been Drawn From 0$ to the ATH, so the Specified Levels are well Defined and Proved.
The Asset is at the Accumulation Level Currently, which means soon the smart many will Flow in it and the Price Value will get Pump and Appreciates
Probably we may not again see this 78.6% Fibonacci Retracement Level or bellow in the current cycle.

🆓Compound (COMP) Mar-30 #COMP $COMP
Just had a very strong buying force of COMP and helped it conquer the $130 area and turn this zone into its support at this point. We can accumulate more COMP near the $130 zone for the $170 and $200 targets in April.
📈RED PLAN
♻️Condition : If 1-Day closes ABOVE 130$ zone
🔴Buy : 140 - 130
🔴Sell : 170 - 200
📉BLUE PLAN
♻️Condition : If 1-Day closes BELOW 130$ zone
🔵Sell : 130
🔵Buy : 110 - 95
❓Details
📈Red Arrow : Main Direction as RED PLAN
📉Blue Arrow : Back-Up Direction as BLUE PLAN
🟩Green zone : Support zone as BUY section
🟥Red zone : Resistance zone as SELL section

Compound vs Tether Very Strong 250%, More Advanced Than COMPBTCCompound vs Tether is looking better than COMPBTC.
COMPBTC has higher potential for growth based on the chart technicals but COMPUSDT is already above EMA10 and...
We have strong trading volume.
3 Consecutive green weeks/candles.
A higher low compared to Nov. 20 2021.
Bullish cross on the MACD and RSI.
The same falling wedge pattern.
And as I just mentioned, prices trading above EMA10.
These are all bullish signals on the weekly timeframe, which makes them 7 times stronger than the daily timeframe...
Something good can happen next.
Namaste.

Compound High Potential For Growth, Strong Bullish Signals 700%+Compound (COMPBTC) is looking really good, we will focus on the main/classic signals once more.
The classic falling wedge, beautiful.
The TD Sequential went through a perfect -9 and is starting to turn.
We have bullish divergence with the MACD and RSI (this is the weekly timeframe).
We have a bullish cross also on both indicators mentioned above.
The compound developers team are also changing the projects structure to reduce its rewards by 50%, which is also stimulating its prices growth.
The above signals are all bullish, we are looking at over 250% potential and up to 725% for the full bullish jump.
Namaste.

Long COMP @ 135 Undervalued DEFI LEADERCOMP has seen a recent outpacing of protocol TVL, relative to the token's price performance leading me to believe its a value play right now! LONG @ 135

Easy +20% setup for COMPSoon you will see resistance breakout with bullish RSI. After it you can go 20% until $150, where will be next resistance. At this moment we can see purchases, positive cumulative delta, bullish RSI. Everything going according to plan.

COMPOUND looks to make a new high trend with breakout effect.Hello trading friends,
This is an update for COMPUSDT.
Depending on the study trend - we could enter a new high trend with a possible breakout of the compound.
Depending on the chart show, it shows the box close possibility trend.
60% + could be a possible increase trend for COMP coming time.
Don't expect to fast changes - market going on their way.
- This is not a trading call - Trade only depends on your setups.
Good time

Compound COMP Price Targets and Stop LossCOMP/USDT
Entry Range: $110 - 125
Price Target 1: $144
Price Target 2: $183
Price Target 3: $233
Stop Loss: $96

Video: COMPUSD Looks Very Similar to Doge. Here's what to watch
In this video I'll show you what I've spotted on the COMPUSD chart and what I would be watching/waiting for before I took an entry.
⛓️ 🔗 Useful Links 🔗 ⛓️
Link to Static Posts:
Dogecoin - www.tradingview.com
CompUSD - www.tradingview.com

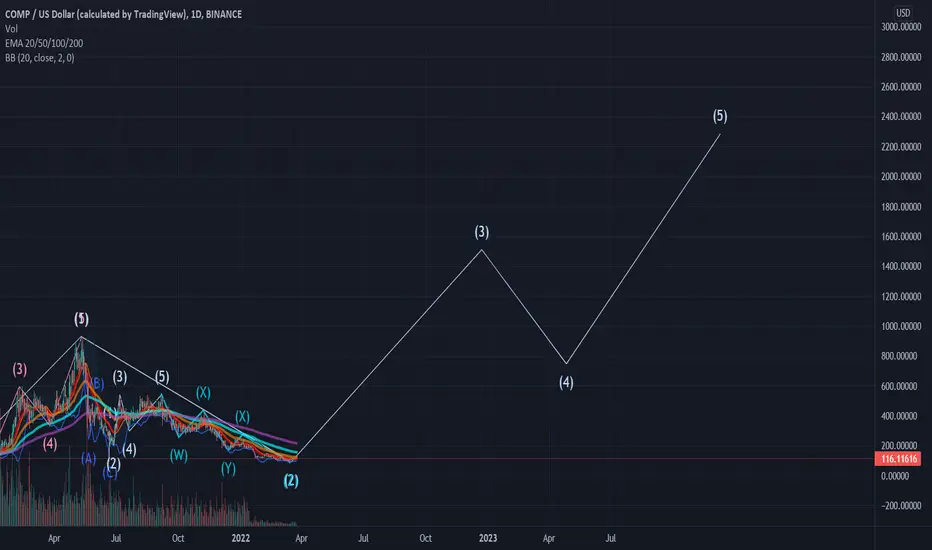
COMP/USDTesting/tracking elliot wave theory. Please do not trade off idea without S/L. Not financial advice.
The start of this count is around the $84 area ( wave 1) and we've reached the bottom of $99 or so (wave 2), I highly doubt we will go anylower than $99 but if we do, this chart is still valid as long as we're above $85.
Wave 1 - $900
Wave 2 - $99?
Wave 3 - 1500??
Wave 4 - 750??
Wave 5 - 2222??
Will update as price targets reach or chart becomes invalid.
educational 🧙 ♂️ Buying rumors and selling news to those who still don't know or follow me recently
Buying a rumor and selling the news is a trading practice
Rumors are an essential component of price action, and news is one that has the opposite effect. In other words, it will give the trader more focus on rumors rather than news. In addition, it will be the entry point when rumors emerge, and the exit point when news emerges.
This trading strategy places great emphasis on the timing of each trade as the rumors and news come in other than the technical analysis of the stock or asset.
Knowing that news and rumors are about to emerge, traders make important trading decisions after these events.
If you don't understand, then see the world upside down 😂😂
An example of simplification The market from the beginning of the week was expected to raise the interest rate, so gold is correcting downwards (this is a rumor buying)
While after the news is released, gold is expected to rise, and this is (selling the news).
COMP / COMPUSDT super bullishHey everyone
I am super bullish on this altcoin for multiple reasons.
1: charts/TA
Beautiful double bottom and ATL retest
Red line can be broken here with a breakout
Blue lines seem to be the general idea for now
Combined with low RSI and volume profile.. this is a gem.
2: fundamentals
70% supply released. Deflationary coin.
Beautiful Defi coin, backed by big investors and whales
Currently ranked at #92. Too low for the fundamentals in my opinion. Comp deserves atleast #60. Meaning huge inflow imo.
3: longer term idea is $1000 to $3500 because of strong fundmentals. Considering all cryptocurrencies going up and an altcoin run.
Shortterm is already x4 as you can see.
4: Comp hasn't seen any pumps last weeks. There is a good chance it will be "it's turn" soon. Like for example on Waves atm.
Which means a huge opportunity when we buy today. Really a longterm coin this one.

educational A detailed explanation of the BUTTERFLY harmonic pattern 🦋
🔹 BUTTERFLY is a reversal pattern consisting of four waves, similar to the Gartley and Bat pattern.
They are X-A, A-B, B-C and C-D waves.
🔹 Helps you identify when the current price movement is coming to an end, this means that you can enter the market as the price reverses its direction.
🔹 There is a bullish pattern where you can open a buy position
And a bearish pattern where you open a short position.
🔹 BUTTERFLY is a reversal pattern that allows you to enter the market selling at the highest levels and buying from the extreme bottoms.
🔴 buying style:
1️⃣ We have a strong upward movement, which is the beginning of the pattern and is called the (X-A) leg.
2️⃣ The leg (A-B) must be 78% Fibonacci retracement of the leg (X-A)
3️⃣ Then the leg (B-C) and it should be between 38% and 88% Fibonacci retracement of the leg (A-B)
4️⃣ Then the leg (C-D) and it must be between 161% and 261% Fibonacci extension of the leg (B-C)
5️⃣ And the pattern (D) ends, which should be between 127% and 161% Fibonacci extension of the leg (X-A)
6️⃣ When the model is formed and its conditions are completed as we mentioned, the price will rise from point (D) and can benefit from buying from point (D).
🔴Selling style:
1️⃣ We have a strong downward movement, which is the beginning of the pattern and is called the (X-A) leg.
2️⃣ The leg (A-B) should be 78% Fibonacci retracement of the leg (X-A).
3️⃣ Then the leg (B-C) and it should be between 38% and 88% Fibonacci retracement of the leg (A-B).
4️⃣ Then the leg (C-D) and it must be between 161% and 261% Fibonacci extension of the leg (B-C).
5️⃣ And the pattern (D) ends, which should be between 127% and 161%, the Fibonacci extension of the leg (X-A).
6️⃣ When the model is formed and its conditions are completed, as we mentioned, the price will drop from point (D) and the sale can benefit from point (D).
below you can see other educational content

COMP/BTC at SupportCOMP/BTC at Support with Divergences
Not according to my usual strategy, as I normally just trade trends. But COMP is at 100 (psychological price level) with Bull divergences on COMP/BTC and COMP/USDT
I'm buying with Stop/Loss around 97

educational A detailed explanation of the SHARK harmonic pattern
The Shark model was discovered in 2011 by Scott Carney.
It is somewhat similar to the crab pattern, and the most important characteristic of this pattern is that it depends on the 88.6 Fibonacci correction ratio
This model was created by combining Fibonacci numbers with Elliot Wave Theory.
The shark model is characterized by the need to specify the points for determining the model points, which are x, a, b, c, and the beginning of the structure of the model is point 0. In the shark model, point B exceeds point x
buy style
1- There is no specific correction for A
2- Point B corrects 113 to 161.8 from XA
3- Point C of model completion at 88.6 to 113 0X and at 161.8 to 224 AB
sell style
1- There is no specific correction for A
2- Point B is a correction from 113 to 161.8 from XA
3- Point C of model completion at 88.6 to 113 from 0X and at 161.8 to 224 from AB
below you can see one of our trades on shark pattern , and other educational content and some other trades on it

educationalA detailed explanation of the harmonic model SHARK 🦈
The Shark model was discovered in 2011 by Scott Carney
It is somewhat similar to the CRAB model 🦀
🔹 The most important characteristic of this model is that it depends on the 88.6 Fibonacci correction ratio
This model was created by combining Fibonacci numbers and Elliot Wave theory.
The shark model is characterized by the need to specify the points of the model, which are X, A, B, and C
The starting structure of the model is point 0.
In the shark model, point B exceeds point X
🔴 bullish style
1️⃣ No specific patch for A
2️⃣ Point B corrects 113 to 161.8 from XA
3️⃣ Point C for model completion at 88.6 to 113 0X and at 161.8 to 224 AB
🔴 bearish style
1️⃣ No specific patch for A
2️⃣ Point B is a correction from 113 to 161.8 from XA
3️⃣ Point C for model completion at 88.6 to 113 from 0X and at 161.8 to 224 from AB

education5-0 . Harmonic Pattern
The 5-0 pattern was discovered by Scott Carney
🔹It was published in his book “Harmonic Trading, Volume Two.”
It is a unique model that has accurate Fibonacci ratio corrections to validate the model.
🔹Although the 5-0 pattern is considered a reversal pattern, because the 50% retracement level is the most important in the potential reversal area.
Correction ratios are slightly different from Bat or Gartley style.
🔹The 5-0 category is in the 5-point harmonic reversal family of models
🔹It is essentially defined by a point B, as is mandatory for all harmonic patterns.
The basic premise of the pattern is to determine the reactions after completing the opposite direction
5-0 patterns usually represent the first pullback of a major trend reversal.
🔹In many cases, the AB leg of the structure is the last failed wave of the trend.
