COMP USDT 4Hcomp usdt is back in range and gave us a second chance to buy low best time to buy on spot to be safe!!
no financial advice just a idea ;)
Compound
COMP USDT new entrycomp usdt touched the support really fast and im still in the trade there is still time to join
no financial advice use risk management!!

$COMPUSD Cypher Harmonic Confirms BreakoutThe cypher tool in TradingView is awesome, regardless of fractals.

COMPUSDTCOMP has touched its upward trendline and can start a good upward movement. Mid-term targets are shown in the chart.

MY MINIMALIST ANALYSIS FOR COMPOUND $COMP
10.26.21
0537H +8 SINGAPORE
ALERT: ENTRIES,PARTIAL EXITS, EXITS and MAXIMIZED AREAS OF VALUE
Disclaimer:
The findings of the following analysis are the sole opinions of the publisher of this idea and should not be taken as a piece of investment advice.
"FOLLOW THE WHITE RABBIT!"
HOW TO USE THIS MINIMALIST CHART
Created on a MONTHLY, WEEKLY & DAILY Analysis (The Dynamics of the Market.)
It is designed for SWING TRADES at the BOTTOM. I do not SHORT, though, you can still use it.
The LARGE BOXES (Tops and Bottoms) are MAJOR pivot points that will occur, while the SMALL BOXES (Tops and Bottoms) are MINOR pivot points.
These can be entries to a BUY/ SELL POSITION, EXIT/PARTIAL EXIT/TOP-UP AREAS
and even if you wish to hold longer for a CONSERVATIVE MAXIMUM TARGET AREA OF VALUE (Depending on, if the conditions are right.)
At times I include WAY BEYOND PARABOLIC Price TARGETS.
Watch out for your Volume, Chart Patterns, Candlestick Math, Price Action, and especially your Fibs, Market Dynamics, and trading psychology.
The above-mentioned is sufficient enough as a major deciding factor for this MINIMALIST CHART.
Note: That This CHART is best used without indicators. (As we all know, they lag.)


Still on a Long position for CompUSDT it seems like a triangle breakout to me and I think Comp will meet it's targets in less than two weeks ;)
I'm hoping for ichimoko to confirm my idea in hours
I will post an update

COMPUSDT Long Position With Two Targets (Compound)If the MACD Signal lines Cross each other my signal confirms and it's a buy signal for COMPUSDT. Let's see what happens :)

Compound Potential Long 215-260Even though BTC and others are bullish...COMP suffured an exploit and will most likley do some slow bleed out before it starts regaining stronger ground.
Long at 260 - 215....
If 215 get broken we could see some serious issue with comp at the final alt season run. This could also impact other DEFI token that have direct connections with compound as well.

🆓Compound (COMP) Oct-18 #COMP $COMP📈RED PLAN
♻️Condition : If 1-Day closes ABOVE 280$ zone
🔴Buy : 300 - 280
🔴Sell : 380 - 460
📉BLUE PLAN
♻️Condition : If 1-Day closes BELOW 280$ zone
🔵Sell : 280
🔵Buy : 240
❓Details
🚫Stoploss for Long : 10%
🚫Stoploss for Short : 5%
📈Red Arrow : Main Direction as RED PLAN
📉Blue Arrow : Back-Up Direction as BLUE PLAN
🟩Green zone : Support zone as BUY section
🟥Red zone : Resistance zone as SELL section
🅰️A : The Close price of 1-day candlestick is Above the zone
🅱️B : The Close price of 1-day candlestick is Below the zone

COMPUSDT coiling for a bullish reversal?Clean levels. Potential for at least a mean reversion and bounce off of key support levels.

COMPUSDT Reversal EntryA break out has at the top of the descending triangle, waiting for the retest before a potential buy BINANCE:COMPUSDT

COMP/USDTCOMPOUND trend in falling wedge where make a bottom at 279$ and then test it three times ..so my conclusion is "that is a solid bottom :)" then broke falling wedge pattern make support on golden pocket 315$ ..now need to flip resistance to support at 338$. where make a potencial W pattern/bullish ..potencial long price is on the chart..cheers

COMP/USDT AnalysisCOMP / USDT
Comp is showing bullish falling wedge in confluence with trendline support (red line)
it has high potential to grow :
1- either from here (falling wedge)
2- after retest of weekly support
Keep your eye on it 👀
Best of wishes 🙏

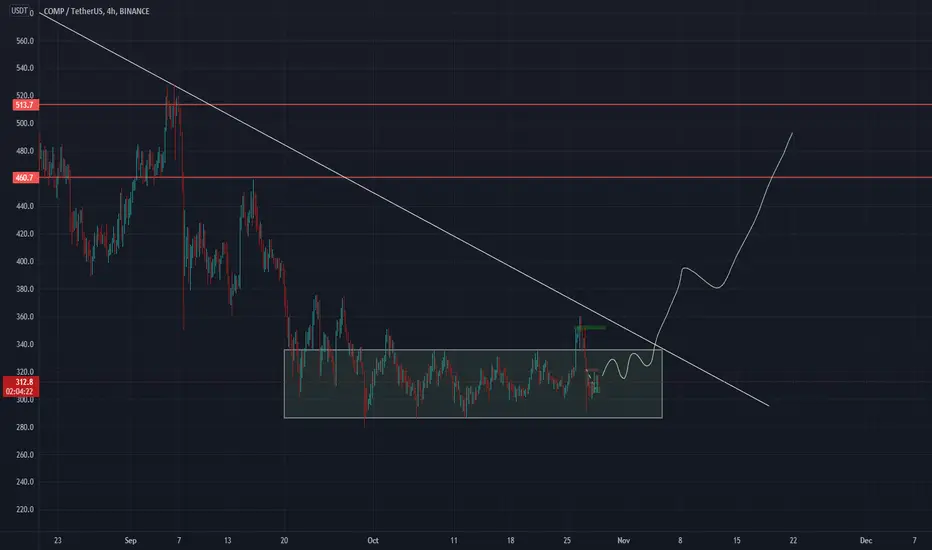
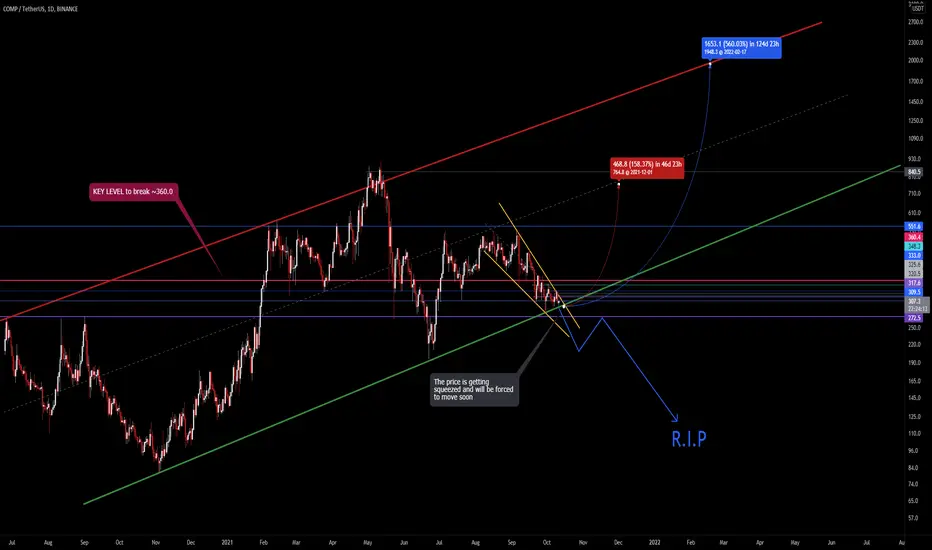
🚨COMP-is it time? F.Wedge+Macro BottomWhat you need to know is that the was some bad news that came out recently:
"$22M Drained From Compound Contract That Was Hit for $80M Last Week. About $66 million – and counting – was recently added to the still vulnerable contract, thus making more funds available for exploit. "
Source: coindesk
That event obviously had a negative impact on the price, but surprisingly we didn't see a rapid sell-off.
Compound touched the bottom trendline of the parallel channel for the third time and seems like it's about to break out of the falling wedge formation anytime now.
The key level to claim is ~360.0. Once it's done compound will be ready for some big moves. Until that happens it's possible for the price to just keep going sideways.
LUNA UPDATE Luna following my previous analysis perfectly. After securing +120% partial profits on our leverage position we continue to hold the remainder of our trade risk free, now we can see the market has made yet another correction giving us the possibility to compound our position. Waiting for a confirmed 4hr higher high to look for a second entry.

Compound (COMP) - October 5Hello?
Welcome, traders.
By "following", you can always get new information quickly.
Please also click "Like".
Have a nice day.
-------------------------------------
(COMPUSDT 1W Chart) - Mid-Long-Term Perspective
Above the 144.58-287.10 section: The uptrend is expected to continue.
The centerline of OBV in the volume indicator is showing a lot of upside.
We need to see if the green width increases as the centerline of OBV declines.
If the price is maintained above the range of 144.58-287.10 with this change in trading volume, it is expected to lead to a large increase.
On the wRSI_RC indicator, you need to check if the RS line rises below 20.
If this change is accompanied by a volume explanation, we would expect it to turn into an uptrend and move up along an uptrend line.
(1D chart)
Support section: 220.36-266.58 section.
First resistance zone: near point 359.03.
Second resistance section: 451.47-497.69 section.
If it falls from the support zone, it is expected to touch the 144.58-191.87 zone, which is the boundary zone of the mid- to long-term investment area.
I mentioned the resistance section separately, but the resistance section is formed throughout the volume profile section spanning the section 359.03-529.78.
It is expected that it will take some time to break through this section upwards, but if the BTC price rises to the 50K level and maintains the price, it may rise accordingly, so we need to watch the flow.
------------------------------------------
We recommend that you trade with your average unit price.
This is because, if the price is below your average unit price, whether it is in an uptrend or in a downtrend, there is a high possibility that you will not be able to get a big profit due to the psychological burden.
The center of all trading starts with the average unit price at which you start trading.
If you ignore this, you may be trading in the wrong direction.
Therefore, it is important to find a way to lower the average unit price and adjust the proportion of the investment, ultimately allowing the funds corresponding to the profits to regenerate themselves.
------------------------------------------------------------ -----------------------------------------------------
** All indicators are lagging indicators.
Therefore, it is important to be aware that the indicator moves accordingly with the movement of price and volume.
However, for the sake of convenience, we are talking in reverse for the interpretation of the indicator.
** The MRHAB-O and MRHAB-B indicators used in the chart are indicators of our channel that have not been released yet.
(Because it is not public, you can use this chart without any restrictions by sharing this chart and copying and pasting the indicators.)
** The wRSI_SR indicator is an indicator created by adding settings and options to the existing Stochastic RSI indicator.
Therefore, the interpretation is the same as the traditional Stochastic RSI indicator. (K, D line -> R, S line)
** The OBV indicator was re-created by applying a formula to the DepthHouse Trading indicator, an indicator disclosed by oh92. (Thanks for this.)
** Support or resistance is based on the closing price of the 1D chart.
** All descriptions are for reference only and do not guarantee a profit or loss in investment.
(Short-term Stop Loss can be said to be a point where profit and loss can be preserved or additional entry can be made through split trading. It is a short-term investment perspective.)

Compound USD predictionAnother Compound chart showing potential path of moving average and price action over the next couple of weeks.
Just a prediction; Nothing to base your trades or finances upon only an idea.

COMPOUND price predictionEstimation of Compound /USD price action over the next month or two. 200 Moving average beginning to curl upward. Barring any bad news events in traditional markets prices should continue to rise over the next month in most cryptos.

🆓Compound (COMP) Sep-28 #COMP $COMPThe selling force on COMP is dominated so in next days, it could fall down sharply to 260$ from this 340$ zone. The 260$ zone is quite reliable to start a new rally up to 340$, 420$ and 520$ zone or even higher in October.
📈RED PLAN
♻️Condition : If 1-Day NOT closes ABOVE 2.2$ zone
🔴Sell : 340$
🔴Buy : 260$
🔴Sell : 340$ - 420$ - 520$
📉BLUE PLAN
♻️Condition : If 1-Day closes ABOVE 2.2$ zone
🔵Buy : 340$
🔵Sell : 420$ - 520$
❓Details
🚫Stoploss for Long : 10%
🚫Stoploss for Short : 5%
📈Red Arrow : Main Direction as RED PLAN
📉Blue Arrow : Back-Up Direction as BLUE PLAN
🟩Green zone : Support zone as BUY section
🟥Red zone : Resistance zone as SELL section
🅰️A : The Close price of 1-day candlestick is Above the zone
🅱️B : The Close price of 1-day candlestick is Below the zone

Compound DEFI FALL SEASON!chart looks ready to explode to the upside. Similar structure to $CRV (we have already seen what that one has done). A RETURN OF DEFI will happen this Fall!
I hope you found the idea interesting;)
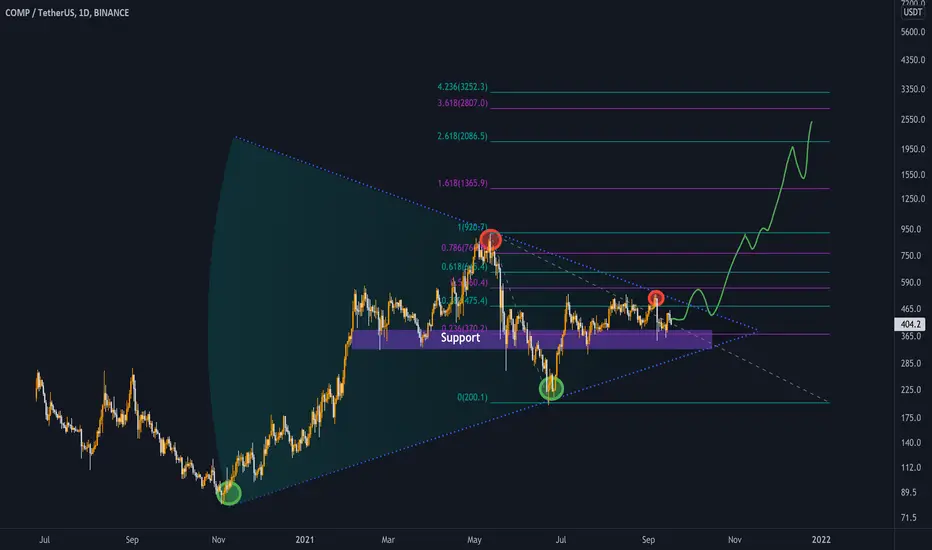
COMP ready to hit $910after previous crash, COMP still accumulation on major support
next target: $750 & $910

Compound COMPBTC - Bullish rectangle + Descending channel- Compound - COMP Rank #57 on coinmarketcap.
- On the chart we can spot a huge bullish rectangle, which will break up very soon!
- Also we can see a descending channel, which is also ready to break up!
- Profit target is below ALL TIME HIGH
- For expected duration of the trade, probability, stop loss, profit target, entry price and risk to reward ratio ( RRR ) - please check my signature below ↓
- If you want to see more of these ideas, hit "Like" & "Follow"!
- See my related idea about COMPUSDT below in the related section.
