Compound COMP price rose from the dead)The Compound project was fundamentally quite strong when it was sold / presented to crypto market participants)
However, over the 2 years of being in a downward trend, the price of t he COMP token has fallen 39 times from a high of $910 to a low of $23.
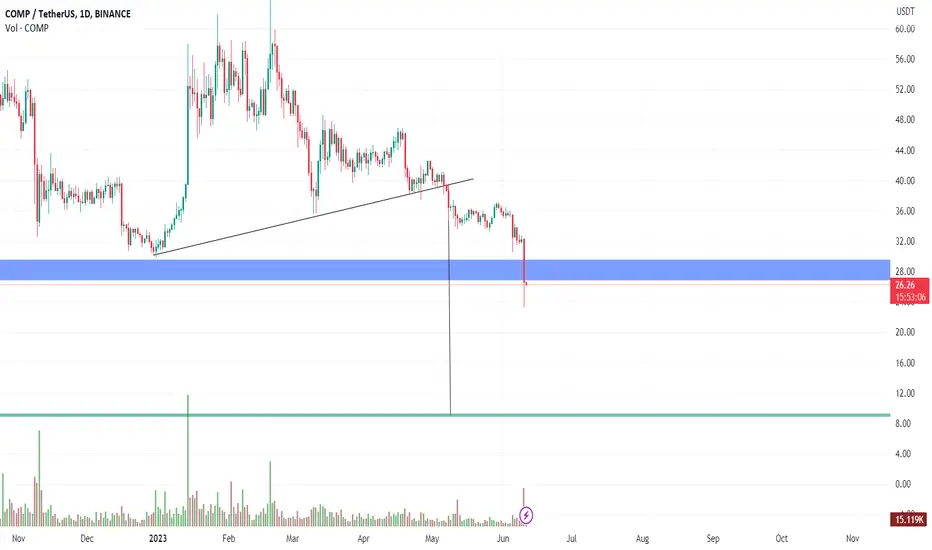
And now, in the last two weeks, a miracle has happened, the price of CompUSDT has come to life and is showing steady growth. Moreover, it is catching up with the crypto market, which started growing much earlier.
Currently, looking at the chart, we do not believe that the CompUSD price will break through and consolidate above the strong resistance zone above $55-65 at the first attempt.
Unless you have an insight as to why the COMP price should grow non-stop right now, then please share it in the comments)
In all other cases, we consider it safe to buy COMPUSDT only when the price is firmly established above $65
_____________________
Did you like our analysis? Leave a comment, like, and follow to get more
COMPUSD

COMP: Pullback in UptrendCompound (COMP) technical analysis:
Trade setup : Price broke above 200-day MA with huge volumes and confirmed a bullish trend reversal. It’s also broken above $70 to signal uptrend resumption and hit a high of $87 where some trader began taking profits. Priced pulled back to the nearest support of $60, which also lines up with Fibonacci levels of $62 (38%) and bounced right off of that. Upside potential to $90 next.
Trend : Uptrend across all time horizons (Short- Medium- and Long-Term).
Momentum is Mixed as MACD Line is below MACD Signal Line (Bearish) but RSI > 55 (Bullish). MACD Histogram bars are rising, which suggests that momentum could be nearing another upswing.
Support and Resistance : Nearest Support Zone is $60 (previous resistance), then $47. The nearest Resistance Zone is $70, which it broke, then $93.

COMPUSD: 1W candle turning green pointing to a rally continuatioCOMPUSD has been a very profitable crypto for us lately (last idea at the bottom) and as it crossed above the 1 year Channel Down invalidating it, the 1W timeframe turned bullish (RSI = 65.140, MACD = 5.050, ADX = 32.042).
If the 1W candle closes green on this bullish pinbar, we will buy again and target the 1W MA100 (TP = 100). The upside potential is significant as the recent Bullish Cross on the 1W MACD was formed under the 0 level.
Prior idea:
## If you like our free content follow our profile to get more daily ideas. ##
## Comments and likes are greatly appreciated. ##

COMP is still bullishHi, dear traders. how are you ? Today we have a viewpoint to BUY/LONG the COMP symbol.
For risk management, please don't forget stop loss and capital management
When we reach the first target, save some profit and then change the stop to entry
Comment if you have any questions
Thank You

Compound Token (COMP) Analysis 08/03/2021we had our previous Publications TP Achieved
currently we can see a Bullish Hidden Divergence of price with MACD, which is the sign of trend continuation,
using Fibonacci Projection for the Target Specifications.
1TP is the parallels leg of Fibonacci projection and easy to achieve by nest impulse wave after the current retracement.
if 2TP triggered with the first rally then we may have a price correction and our 3 TP is confirmed.

COMPUSDT time to shortThe current status of the BINANCE:COMPUSDT is as follows:
The BINANCE:COMPUSDT has experienced a great rally and has moved directly towards one of the historical resistances at $75.
However, we are seeing divergence in the rsi indicator in both the daily and 4-hour timeframes, which indicates a weakening trend and also a good opportunity for those who had long positions to exit.
⚠️"Daily crypto market analyses I provide are personal opinions & not financial advice. Trading carries risks, so do your own research & seek advisor's help."
Don't forget to like and comment

COMPUSD Ranged trading and buy if this level breaks.Compound (COMPUSD) is rebounding after the initial rejection on the 71.500 Resistance that goes all the way back to the August 10 2022 High. As long as it holds, we will trade within that and a Higher Lows trend-line. The 1D RSI pattern is identical to the January 15 - 30 peak formation, which also traded in range before the 1D MA50 (blue trend-line) broke and completed a nearly -40% decline.
As a result, if the 1D MA50 breaks again, we will calculate a rough -40% decline from the last High, most likely that will be around 45.000.
A 1D candle close above the Resistance though, will be a bullish break-out for us and we will target a potential 1W MA100 (red trend-line) test at 100.000.
-------------------------------------------------------------------------------
** Please LIKE 👍, FOLLOW ✅, SHARE 🙌 and COMMENT ✍ if you enjoy this idea! Also share your ideas and charts in the comments section below! **
-------------------------------------------------------------------------------
💸💸💸💸💸💸
👇 👇 👇 👇 👇 👇

COMPUSDT at monthly resist, likely to head to monthly supportThe price has hit the confluence of monthly, weekly and daily resistance. This level has pushed the price several times down. Would this time be different? It is possible that this time is different as resistances are meant to be broken when the price rallies. However, the system says, the probability favors a short here towards the monthly and weekly support. I case it breaks the resistance and trades above for a while, then a long will become favorable.

COMPUSD: Closed over the 1D MA200 flashing a strong buy signalCOMPUSD closed the 1D candle yesterday over the 1D MA200 for the first time since April 18th, giving a strong buy signal despite turning overbought on the 1D time frame (RSI = 73.112, MACD = 1.660, ADX = 54.712).
We are taking a buy here, targeting the 0.786 Fibonacci level (TP = 55.000).
## If you like our free content follow our profile to get more daily ideas. ##
## Comments and likes are greatly appreciated. ##

COMPUSDTI put my last chart about COMP in down this chart.
It must touch green line for a great rise.
COMP ANALYSIS (4H)Hi, dear traders. how are you ? Today we have a viewpoint to SELL/SHORT the COMP symbol.
For risk management, please don't forget stop loss and capital management
When we reach the first target, save some profit and then change the stop to entry
Comment if you have any questions
Thank You

COMPUSDMy bias for COMPUSD still remains bearish as the previous low is already broken. I was taken out from my first initial trade due to a tight stop loss. A re-entry is taken with my target still my previous target.

COMP getting support and aiming 52!1D time frame
-
COMP just got support from uptrend.
This is a good buying opportunity.
Do not miss it!
Target: 52~54
SL: 29.6

Nice risk/reward ratio for COMPCOMP is currently chilling at daily support level and right at the bottom side of the huge triangle, showing RSI divergence on 4h and 1d time frames. Giving possible upside move with more than 50% and small risk with stops below support & trend line could be a nice play.

Bulls Defend Critical Support: #COMPUSDT Shows Signs of Uptrend🐂 #COMPUSDT bulls fiercely defending the $38 area, where the 78.6% Fibonacci support was twice rejected. The recent price action reveals a clean rebound off the uptrend trendline and the critical VolumeProfile demand zone.
If this massive support continues to hold and #COMPUSDT can produce a new higher high, it is highly likely that we will see a continuation of the bullish trend. The next resistance level to watch is at the $50 mark.

COMP IS BULLISHHi, dear traders. how are you ? Today we have a viewpoint to BUY/LONG the COMP symbol.
For risk management, please don't forget stop loss and capital management
When we reach the first target, save some profit and then change the stop to entry
Comment if you have any questions
Thank You

✅TS ❕ COMPUSD: support level✅✅ The COMP continues to hold support.
The chart has broken the downward structure.
Price will bounce from the current level. ✅
🚀 SELL scenario: short to 44.58. 🚀
----------------------------------------------------------------------------
Remember, there is no place for luck in trading - only strategy!
Thanks for the likes and comments.

✅TS ❕ COMPUSD: descending channel✅✅ The COMP is moving in a downtrend.
The asset has returned to the downtrend channel.
The price will continue to decline. ✅
🚀 SELL scenario: short to 36.75. 🚀
----------------------------------------------------------------------------
Remember, there is no place for luck in trading - only strategy!
Thanks for the likes and comments

✅TS ❕ COMPUSD: fixed above the channel✅✅ COMP is fixed above the upper border of the channel.
The price held the support level.
I expect that the asset will begin to rebound from the current level. ✅
🚀 BUY scenario: long to 59.84. 🚀
----------------------------------------------------------------------------
Remember, there is no place for luck in trading - only strategy!
Thanks for the likes and comments

COMP to MOON#COMP is preparing for breakout and rise to $173.
Take long position after breaking trend line.

✅TS ❕ COMPUSD: downward channel✅✅ COMP tests the upper limit of the channel.
The price forms descending peaks.
I expect further decline after consolidation in the channel. ✅
🚀 SELL scenario: short to 48.45. 🚀
----------------------------------------------------------------------------
Remember, there is no place for luck in trading - only strategy!
Thanks for the likes and comments

Compound (COMP) formed bullish Gartley for upto 14.50% pumpHi dear friends, hope you are well and welcome to the new trade setup of Compound (COMP) token with US Dollar pair.
In previous trade setup, the priceline of COMP moved slightly down than potential reversal zone but recovered soon and then pumped well:
Now on a 4-hr time frame, COMP has formed a bullish Gartley move for another pump soon.
Note: Above idea is for educational purpose only. It is advised to diversify and strictly follow the stop loss, and don't get stuck with trade

✅TS ❕ COMPUSD: downward channel✅✅ COMP already failed to break through the channel border twice.
The peaks are going down.
I expect a fall after fixing in the channel. ✅
🚀 SELL scenario: short to 48.45. 🚀
----------------------------------------------------------------------------
Remember, there is no place for luck in trading - only strategy!
Thanks for the likes and comments
