COMPUSDT, We supported in PRZ levelHello everyone
Compound is one the most powerful project that is working ...
If you need to know and want to learn fundamental analysis you can send us messages in private
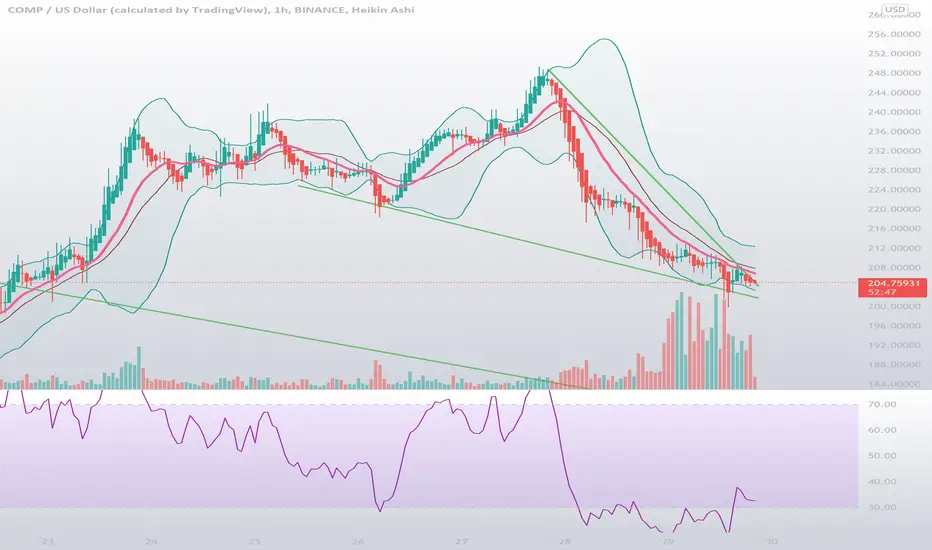
Accroding to the chart and previous analysis of COMP, After the price break the sensitive support zone area and our SL activated we analysed chart again that we found the point for the swing trend.
We shown on chart PRZ level that can support the price and start new movement of upwards.
The price exactly supported in support zone and its time to buy one step in here, the price according to the supported in zone has the potential to go up and test trendline resistance.
If it can go up with powerful momentum it has chance to break the trendline resistance and if it can break the resistance successfully it can move upwards more to new target.
We will update new target after break happen.
Dont forget use stop loss and put it below the lower shadow of candle in the zone 1-2% lower than that.
Good Luck
Abtin
Previous analysis :
COMPUSD

COMPUSDThe triangle were the COMP-token is in for months will end soon. Let's see how this plays out..

COMPUSDT - Falling wedgeProbably a bullish setup on the 1H COMPUSD(T). Most of time this type of pattern will breakout to the upside. Let's watch this..
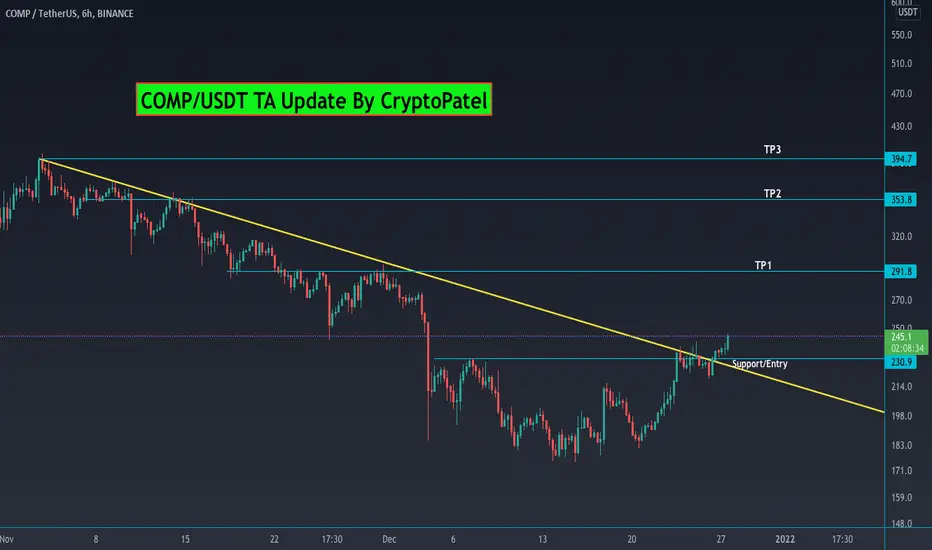
COMP/USDT Bullish breakout and Ready for Big Move#COMP/USDT TA update:/
$COMP currently trading around $245
I am bullish on $COMP
I am buying some here and waiting for some around $240
Entry:- $230-$240
Targets:- $291/$353/$394
Stop Loss:- 218
So I am accumulating more at dip with Tight Stop Loss.
Support:- $230
Compound (COMP) - December 25Hello?
Welcome, traders.
If you "follow", you can always get new information quickly.
Please also click "Like".
Have a nice day.
-------------------------------------
(COMPUSD 1W Chart)
Above the 250.56132 point: the uptrend expected to continue
Keeping the price above the 250.56132 point is paramount.
If it declines at this rate, it is expected to enter the mid- to long-term investment area.
The resistance range is 405.76617-490.76413.
-------------------------------------
(COMPBTC 1W chart)
To turn into an uptrend, it must rise above the 0.00657 section.
In particular, it is expected that the upward trend will accelerate when the volume profile section formed in the 0.00657-0.00876 section is passed.
To break out of the downtrend line, we need to see if it rises above the 0.00528 point.
------------------------------------------
We recommend that you trade with your average unit price.
This is because, if the price is below your average unit price, whether the price trend is in an upward trend or a downward trend, there is a high possibility that you will not be able to get a big profit due to the psychological burden.
The center of all trading starts with the average unit price at which you start trading.
If you ignore this, you may be trading in the wrong direction.
Therefore, it is important to find a way to lower the average unit price and adjust the proportion of the investment, ultimately allowing the funds corresponding to the profits to be able to regenerate themselves.
------------------------------------------------------------ -------------------------------------------
** All indicators are lagging indicators.
Therefore, it is important to be aware that the indicator moves accordingly with the movement of price and volume.
However, for convenience, we are talking in reverse for the interpretation of the indicator.
** The MRHAB-O and MRHAB-B indicators used in the chart are indicators of our channel that have not been released yet.
(Since it was not disclosed, you can use this chart without any restrictions by sharing this chart and copying and pasting the indicators.)
** The wRSI_SR indicator is an indicator created by adding settings and options to the existing Stochastic RSI indicator.
Therefore, the interpretation is the same as the traditional Stochastic RSI indicator. (K, D line -> R, S line)
** The OBV indicator was re-created by applying a formula to the DepthHouse Trading indicator, an indicator disclosed by oh92. (Thanks for this.)
** Support or resistance is based on the closing price of the 1D chart.
** All descriptions are for reference only and do not guarantee a profit or loss in investment.
(Short-term Stop Loss can be said to be a point where profit and loss can be preserved or additional entry can be made through split trading. It is a short-term investment perspective.)
---------------------------------

buy & hold COMPOur opinion is to buy COMP and sell it after saving 20% profit.
Stop Loss is your best friend.

comp analysisWhat if, What if not
COMP ANALYSIS
Comp gets kicks back from 294$ .It was the good support zone . Now it holding 167$ zone ,for me it is good time to buy and hold because Comp hits 900$ .
For my point of view Comp again go for 500$.
Short targets
1 221$
2 267$
#DYOR
#Supposing bear trend not started

COMPUSDT - SHORTThere is a short position in COMPUSDT COMP
COMPUSDT COMP
🔴Short Now or set on Key Level 186.5
🟢Target 1 171.1
🟢Target 2 164.5
❌Stop loss 191.2
#K_Level


COMP - when is the best time to buy ?Globally, COMP is sandwiched between the trend line and the liquidity zone. We should now expect good entry points into the market. In case of a false breakdown of a strong liquidity zone or a breakdown of the trend line, there could be a good buying opportunity.
Write in the comments all your questions and instruments analysis of which you want to see.
Friends, push the like button, write a comment, and share with your mates - that would be the best THANK YOU.
P.S. I personally will open entry if the price will show it according to my strategy.
Always make your analysis before a trade.

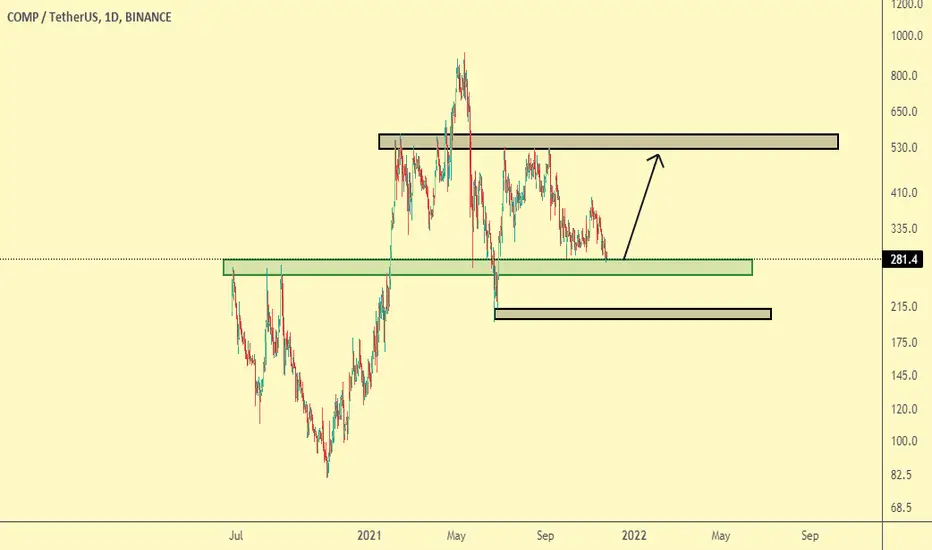
COMPUSDCOMPUSD is trying to break the line of resistance. On the 1D also possible positive divergence is forming.. Volume is also I increasing. COMPBTC and COMPETH are also in the lowest price-ranges..
There's a lot of resistance but when COMP goes, it goes. And after months of a downtrend this can be a nice reversal / buying opportunity

#comb/usdt buy setup ready$COMP/USDT (LONG)
Leverage: 1-3x
High potential, lower risk long term Sicilian hold. We're about to have the ride of the year🔥
*lower position size, as this trade could take anywhere 3-6 months to reach targets.
ENTRY
260 to 285
OTE: 278.2
TARGETS
295
315
340
370
400
440
480
530
580
650
730
800
900
SL
222.8

COMPUSDT , Its need more correctionHello guys
I hope that everyone are in profit and dont have any loss in these days
According to the price is coming near the support zone area and the market expect that can rise the price.
If the price can not support in first support zone area we shown another support zone and PRZ level that can meet expectations for price increases.
Previous analysis :
If you have any question just ask us
Good Luck
Abtin

COMP - when is the best time to buy ?COMP has been moving in a downtrend for a long time. However, it is worth noting that recently there was a big drop and many liquidations, there is a huge volume at the bottom, which is a good signal. It is also worth noting that a trend line has been formed on the chart and the price is moving towards it. In case of a contraction and breakdown of the trend line, there could be a good buying opportunity.
Write in the comments all your questions and instruments analysis of which you want to see.
Friends, push the like button, write a comment, and share with your mates - that would be the best THANK YOU.
P.S. I personally will open entry if the price will show it according to my strategy.
Always make your analysis before a trade.

MY NOT SO MINIMALIST ANALYSIS FOR COMPOUND$COMP (INDICATORS INCLUDED)
11.02.21
1243H +8 SINGAPORE
ALERT: ABOUT TO COIL UP - ENTRIES, PARTIAL EXITS, EXITS, and MAXIMIZED AREAS OF VALUE
THIS IS AN AREA OF OPPORTUNITY: A ZONE FOR AN ENTRY.
Accumulation looks healthy. I think it will not break resistance yet until we see volume increase further. COILING towards STRONG SUPPORT and then BOOM!
You may enter now, It can make a sharp small dip DO NOT FUD.
Disclaimer:
The findings of the following analysis are the sole opinions of the publisher of this idea and should not be taken as a piece of investment advice.
"FOLLOW THE WHITE RABBIT!"
Just Follow the TOPS and BOTTOMS of the BOXES as a GUIDE
HOW TO USE THIS MINIMALIST CHART
Created on a MONTHLY, WEEKLY & DAILY Analysis (The Dynamics of the Market.)
It is designed for SWING TRADES at the BOTTOM. I do not SHORT, though, you can still use it.
TARGET ZONES IDENTIFICATION
The LARGE BOXES (Tops and Bottoms) are MAJOR pivot points that will occur sometime in the future. While the SMALL BOXES (Tops and Bottoms) are MINOR pivot points.
These can be entries to a BUY/ SELL POSITION, EXIT/PARTIAL EXIT/TOP-UP AREAS
and if you wish to hold longer for a MAXIMUM TARGET EXIT AREA OF VALUE -CONSERVATIVE (If price action conditions are right.)
At times I include WAY BEYOND PARABOLIC Price TARGETS depending on The Character of the Market.
Watch out for your Volume, Chart Patterns, Candlestick Math, FIB COILS (ABC), Price Action, FIB LEVELS, Market Dynamics, and especially trading psychology.
Wishing you all The Best Trades and Thank you all for your Appreciation and Support of My Work.
Much thanks to My 3 Mentors!
Note:
Master your Trading Discipline
, Trader's Psychology and Institutional Psychology
Vive Le Austist!

COMP/USDT buy signalToday I am having multiple buy signals. This could be that long waited confirmation of the strong rally. Obviously time will tell.

COMPUSDT , We need correction for this breakwaveGood Night guys
Compound is one the most powerful project guys , read about it and how is it working
According to the chart that we published in vip club the breakwave activated our 2 buy zone and toward the breakwave , this wave need correction and the targets that we shown is in way of the price to reach .
Until the key point is not break and candle close above of them the trend is downward and this is scalp trading for traders.
Put Stop loss at the below of lower candle the this breakwave made.
But dont forget use stop loss and attention to money management
If you have any question send us messages
Good Luck
Abtin

AAVE - the bluest of chips, 4-5x on the wayWhite - an old eth fractal from 2017 that seems to be closely resembling todays AAVE chart. AAVE has been consolidating for the last 6+ months, which gives me confidence that a big move is indeed brewing. Fundamentally I believe it's a great defi project and have personally used it to earn yield on some stablecoins.

COMPUSD Updated ThoughtsCOMP can be seen to be in a falling wedge as it is touching the 1.618 Fib circle line
This fib circle line has been a previous support
I expect this level to hodl and a breakout from the falling wedge to occur
The line is what I expect the indicator to do as price moves

Defi reversalDefi tokens died since NFT hype started. Almost all of them are decreasing. COMP has strong potantial to change this downtrend if it can breakout upward from the channel. Blue line is the strongest support line within near area.

comp (compound) price analysisthis is what I expect from compundusdt analysis.
this is what I expect from compundusdt analysis.
this is what I expect from compundusdt analysis.
compound's potential targetscompound wide channel in daily : dynamic resistance line was broken and retest, also price is testing longtime support line , potential profit in long position:
Entry : 296
SL: 198
TP 1 : 400
TP 2 : 500
TP 3 : 600

COMPUSDT , ITS TIME TO BUY NOWWWWWHello everybody
According to our last analysis the Buy zone activated and now we should buy and wait until the target reach
We are moving between two sensitive zone and now the pulse of upward signal in multi time frame accepted and now we are ready to go and jump
Be careful guys
You should check the chart with your own strategy and check it in multi time frame
Previous analysis :
Good Luck
Abtin
