COMPUSDT , Its ready to go Hello guys
Whats up ? i hope that anyone have nice weekend to start amazing trading week after that
In here we have one of the most powerful project that are working in Layer 2
In here we have 2 senstivive zone and 2 most important zone for the price that we shown on chart , After we broke the key level in long days ago the trend was changed to upward and we need pullback after rally for break and after that the market was unstable and that is the reason that the altcoin market was dump and now after main support that we have war of bullish and bearish we have a sign for win of the bullish and the market wants to go up , And in here we shown it on chart that you can buy and wait until the first target and after that the price impact to resistance zone we can predict what will happen next
You can buy guys and wait until the target reach
Dont forget use stop loss and use money management
Good Luck
Abtin
COMPUSD

COMP - new rocket 🚀🚀COMP is out of the accumulation zone. Additionally, the price tested this zone as support. These are good signals for growth. The price has now approached the trend line and in case of a breakdown could reach the first and second target quite quickly.
Write in the comments all your questions and instruments analysis of which you want to see.
Friends, push the like button, write a comment, and share with your mates - that would be the best THANK YOU.
P.S. I personally will open entry if the price will show it according to my strategy.
Always make your analysis before a trade.

DIP BUY BEFORE BREAKOUT COMPOUND - GOLDEN COIN!Hello trading friends,
Expect that this is a DIp buy before Compound will show coming time a breakout.
This coin was found out by the coin view channel scan.
Expect that we can enter soon over 400 usd + with the targets as from 430 USD even to the top ATH 1200 usd +
Have a great day!

COMPUSD COINBASE LONGSupertrend just signaled a buy on the one day chart for COMPUSD as we are seeing higher lows and higher highs. We also have a bullish convergence on the RSI. Looking to long this one and possibly enter the previously created upward channel.

COMP - new rocket 🚀🚀Comp is a coin with good potential. A strong project on the fundamental analysis side. On the chart, the coin is in a trading range on the higher timeframes.
On the chart you can see that there is a large volume at the bottom when the lower boundary is tested, it is a bullish signal. A good buying opportunity. The first target is the upper limit of the trading range. The second target is the ATH.
Write in the comments all your questions and instruments analysis of which you want to see.
Friends, push the like button, write a comment, and share with your mates - that would be the best THANK YOU.
P.S. I personally will open entry if the price will show it according to my strategy.
Always make your analysis before a trade.

COMP - JUST BUY THIS COIN FOR X10 ✅🚀COMP is the leader in our crypto portfolio. A very promising coin from a fundamental analysis point of view. In a nutshell, Compound is a DeFi lending protocol that allows users to earn interest on their cryptocurrencies.
🔋If we analyze from technical analysis side, this coin has been in accumulation for two months already, and soon we expect exit from accumulation zone and strong impulse growth. But don't discard correction option, the price can go down to support zone, which is marked below.
We bought this coin on the 26th of October at 318$ in the long accumulation zone for 5% of our total equity. This is one of our medium-term positions. We expect a potential of 500% to 1000%.
And of course don't forget to subscribe to our tradingview and other platforms, leave the name of the coin you want us to analyse in the comments. 💚

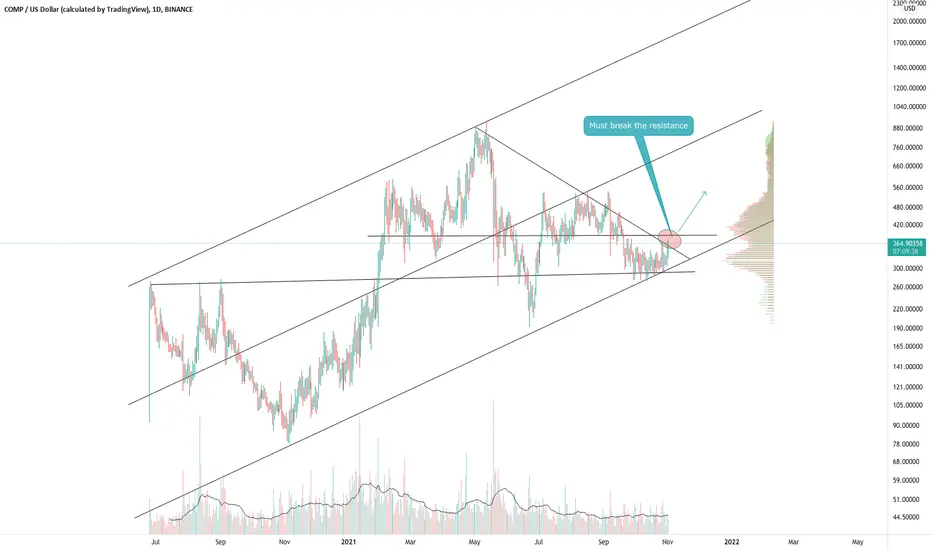
COMP - must break the resistanceCOMP - must break the resistance and after if make a pullback it s more better
COMP Could Blow Upwards - Trendline BreakoutCOMP is at the trendline which is on a 4 hour timeframe and it looks to be trying to break it. If it does it could possible go upwards, maybe fast or maybe in a couple days. Unless bitcoin causes everything to crash again.
Please note this is not financial advice.

CompUSDT respected major channelCompusdt is working nicely through the support, stay consilidet for long time ready to fly after breaking the trendline,,

COMP - new rocket 🚀🚀If you look at the technical analysis side, COMP looks very good.
The price has been in accumulation for a long time while getting closer and closer to the trend line. After yesterday's fall, the price has recovered very quickly, also we should note the appearance of more volume at the bottom. This is a good signal for growth. A breakdown of the trend line might be a good buying opportunity.
Write in the comments all your questions and instruments analysis of which you want to see.
Friends, push the like button, write a comment, and share with your mates - that would be the best THANK YOU.
P.S. I personally will open entry if the price will show it according to my strategy.
Always make your analysis before a trade.

COMPUSDT : Are you ready to pump ?In COMPUSDT 4h
It had converge for a month .
It almost break out the triangle .
If it break out and stand firm above the triangle ,trading strategy as below .
SL:301.0
TP1:351.4
TP2:370.8
TP3:378.7
TP4:395.6
TP5:422.9
If you like this analysis, give it a like or share your thought or let me know what crypto TA you want to know.

MY MINIMALIST ANALYSIS FOR COMPOUND $COMP
10.26.21
0537H +8 SINGAPORE
ALERT: ENTRIES,PARTIAL EXITS, EXITS and MAXIMIZED AREAS OF VALUE
Disclaimer:
The findings of the following analysis are the sole opinions of the publisher of this idea and should not be taken as a piece of investment advice.
"FOLLOW THE WHITE RABBIT!"
HOW TO USE THIS MINIMALIST CHART
Created on a MONTHLY, WEEKLY & DAILY Analysis (The Dynamics of the Market.)
It is designed for SWING TRADES at the BOTTOM. I do not SHORT, though, you can still use it.
The LARGE BOXES (Tops and Bottoms) are MAJOR pivot points that will occur, while the SMALL BOXES (Tops and Bottoms) are MINOR pivot points.
These can be entries to a BUY/ SELL POSITION, EXIT/PARTIAL EXIT/TOP-UP AREAS
and even if you wish to hold longer for a CONSERVATIVE MAXIMUM TARGET AREA OF VALUE (Depending on, if the conditions are right.)
At times I include WAY BEYOND PARABOLIC Price TARGETS.
Watch out for your Volume, Chart Patterns, Candlestick Math, Price Action, and especially your Fibs, Market Dynamics, and trading psychology.
The above-mentioned is sufficient enough as a major deciding factor for this MINIMALIST CHART.
Note: That This CHART is best used without indicators. (As we all know, they lag.)

CompAt lower prices, and when Bitcoin reaches the $ 50,000 to $ 55,000 price range, I start buying Altcoins, one of the best of which is Comp.
COMPUSDT Long Position With Two Targets (Compound)If the MACD Signal lines Cross each other my signal confirms and it's a buy signal for COMPUSDT. Let's see what happens :)

Comp to fly🎯As you see on the chart comp is close to a strong resistance and I'm pretty sure it's bottomed here.
Now trendline has been broken and a leg up is expected

COMPUSDT May Create an ALL-TIME HighAccording to my analysis, it may but i must use a very tight stop just in case it's going for an all time low.
PPPDirhams.
Disclaimer: This is just my idea. Am not liable for the end results if adapted by anyone. Trade cautiously as there are chances that you will lose your investment..
BINANCE:COMPUSDT

COMP is going to drop up to 220$!Situation is not good for ALTCOINS and COMP is no exception to this rule.
COMP will drop hard up to 220$ if lose key level, Also this is a good opportunity to take short position.(Suggested SL is 316$)

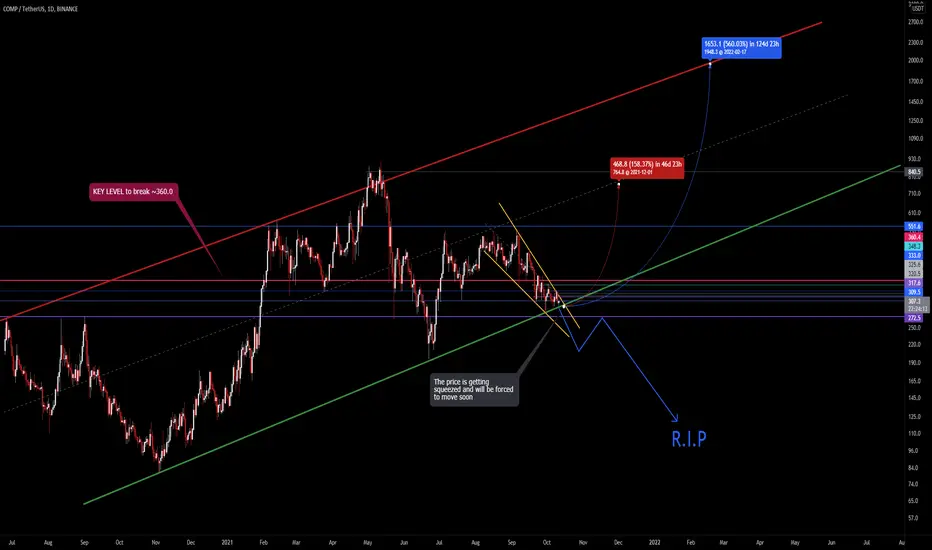
🚨COMP-is it time? F.Wedge+Macro BottomWhat you need to know is that the was some bad news that came out recently:
"$22M Drained From Compound Contract That Was Hit for $80M Last Week. About $66 million – and counting – was recently added to the still vulnerable contract, thus making more funds available for exploit. "
Source: coindesk
That event obviously had a negative impact on the price, but surprisingly we didn't see a rapid sell-off.
Compound touched the bottom trendline of the parallel channel for the third time and seems like it's about to break out of the falling wedge formation anytime now.
The key level to claim is ~360.0. Once it's done compound will be ready for some big moves. Until that happens it's possible for the price to just keep going sideways.
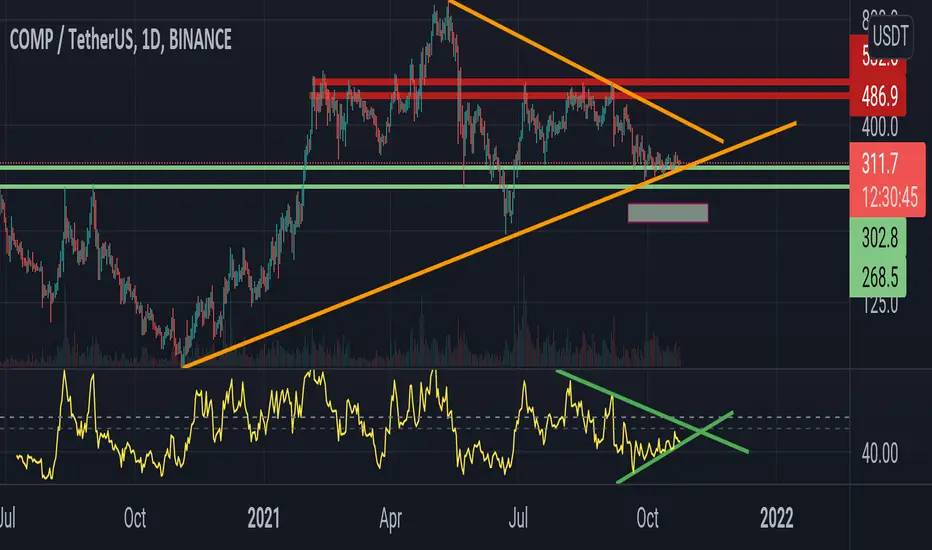
COMPUSDT - Falling Wedge Pattern!COMPUSDT (4h Chart) Technical analysis
COMP/USDT (4h Chart) Currently trading at $325
Buy level :Above $321
Stop loss: Below $284
TP1: $372
TP2: $427
TP3: $474
TP4: $528
Max Leverage 3x
Always keep Stop loss
Follow Our Tradingview Account for More Technical Analysis Updates, | Like, Share and Comment Your thoughts.

COMP SITTING IN A NICE BUY ZONE$COMP is quietly sitting in an accumulation zone. This is a great buying opportunity to get in before we start moving towards ATH or even price discovery by the end of Q4.
This is just an analysis, not a financial advise.

comp buy time EVERyone buy in dip then make more profit
and buy when everyone selling
and don't buy then everyone buying

Compound (COMP) - October 5Hello?
Welcome, traders.
By "following", you can always get new information quickly.
Please also click "Like".
Have a nice day.
-------------------------------------
(COMPUSDT 1W Chart) - Mid-Long-Term Perspective
Above the 144.58-287.10 section: The uptrend is expected to continue.
The centerline of OBV in the volume indicator is showing a lot of upside.
We need to see if the green width increases as the centerline of OBV declines.
If the price is maintained above the range of 144.58-287.10 with this change in trading volume, it is expected to lead to a large increase.
On the wRSI_RC indicator, you need to check if the RS line rises below 20.
If this change is accompanied by a volume explanation, we would expect it to turn into an uptrend and move up along an uptrend line.
(1D chart)
Support section: 220.36-266.58 section.
First resistance zone: near point 359.03.
Second resistance section: 451.47-497.69 section.
If it falls from the support zone, it is expected to touch the 144.58-191.87 zone, which is the boundary zone of the mid- to long-term investment area.
I mentioned the resistance section separately, but the resistance section is formed throughout the volume profile section spanning the section 359.03-529.78.
It is expected that it will take some time to break through this section upwards, but if the BTC price rises to the 50K level and maintains the price, it may rise accordingly, so we need to watch the flow.
------------------------------------------
We recommend that you trade with your average unit price.
This is because, if the price is below your average unit price, whether it is in an uptrend or in a downtrend, there is a high possibility that you will not be able to get a big profit due to the psychological burden.
The center of all trading starts with the average unit price at which you start trading.
If you ignore this, you may be trading in the wrong direction.
Therefore, it is important to find a way to lower the average unit price and adjust the proportion of the investment, ultimately allowing the funds corresponding to the profits to regenerate themselves.
------------------------------------------------------------ -----------------------------------------------------
** All indicators are lagging indicators.
Therefore, it is important to be aware that the indicator moves accordingly with the movement of price and volume.
However, for the sake of convenience, we are talking in reverse for the interpretation of the indicator.
** The MRHAB-O and MRHAB-B indicators used in the chart are indicators of our channel that have not been released yet.
(Because it is not public, you can use this chart without any restrictions by sharing this chart and copying and pasting the indicators.)
** The wRSI_SR indicator is an indicator created by adding settings and options to the existing Stochastic RSI indicator.
Therefore, the interpretation is the same as the traditional Stochastic RSI indicator. (K, D line -> R, S line)
** The OBV indicator was re-created by applying a formula to the DepthHouse Trading indicator, an indicator disclosed by oh92. (Thanks for this.)
** Support or resistance is based on the closing price of the 1D chart.
** All descriptions are for reference only and do not guarantee a profit or loss in investment.
(Short-term Stop Loss can be said to be a point where profit and loss can be preserved or additional entry can be made through split trading. It is a short-term investment perspective.)

COMPUSD - COMPBTC - Falling wedgeKeep an eye on Comp in the next days.
On the COMPBTC chart, Comp hasnt yet broken out. The red box serves as support.
