COMPUSDT - SETUPCOMPUSDT price consolidates and bounced from a good support zone and now bulls are showing their excitement by pushing the price aggressively. So keep an eye, Bull's next stop will be fib level 0.38 (220.0) if they continue their momentum.
COMPUSDT


Compound (COMP) Buy ZoneCompound (COMP) Buy Zone
--------------------
BIAS
Mid-Term : Neutral
Long-Term : Neutral
Risk : Medium
With around 50% correction from mid term high, Compound is getting ready for a bounce in a couple of weeks.
--------------------
$COMP/USDT LONG SETUP
Leverage : x3 - x5
Entry Price : 112.5 - 125
TP 1 : 129.5
TP 2 : 134.5
TP 3 : 145.5
TP 4 : 154
TP 5 : 162.5
TP 6 : 172.5
TP 7 : 183
TP 8 : 199
Stop Loss : 97.5
*Maximum 2% of Portfolio.
*Unload 12.5% at each TP. Whenever TP 2 hits, Move stop loss to entry.
--------------------

COMP broke down ascending support #COMP/USDT
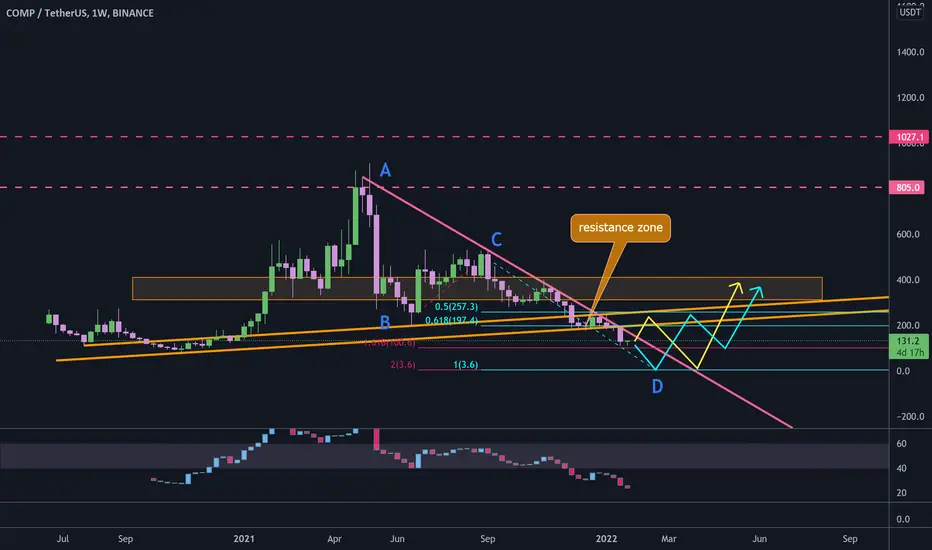
$COMP dropped to 1.618 fib level of BC swing up, as mentioned in previous weekly analysis.
there is a descending resistance line that if price success to break it out, it can pullback to ascending broken line and possible to drop more to 2 fib level of BC then increase to resistance zone between $300 and $400.
COMP above middle line of parallel channel$COMP touched the middle line of descending parallel channel that is the same as long term support.
holding the middle line will increase price to break out from channel. for starting a new rally price has to break out from last yellow trend line maybe around $300.
if price break down from middle line it will drop to $80 and below that I think better to say goodbye to this coin.

COMPUSDTHello. The $250 is expected to fall to $126 and $80, respectively, due to the downtrend and the break of support.

COMP - when is the best time to buy ?COMP is moving in a downtrend but there is a volume at the bottom. This is a good signal. A trend line and a key level can be identified on the chart.
Whether the price will immediately break through the trend line or collect liquidity below the key level is unknown. But in both cases, a break of the trend line could be a good buying opportunity.
Write in the comments all your questions and instruments analysis of which you want to see.
Friends, push the like button, write a comment, and share with your mates - that would be the best THANK YOU.
P.S. I personally will open entry if the price will show it according to my strategy.
Always make your analysis before a trade.

I’ll go short on #Compusdt hereJust if you are into futures trading and know money management, involve on.

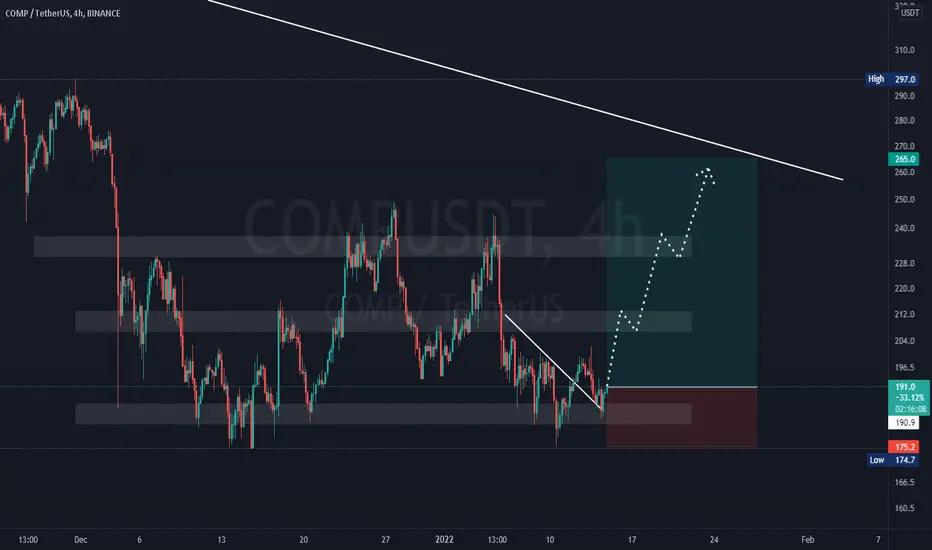
SIMILAR BULLISH PATTERN TO DECEMBERVery similar pattern to the action that happened in December where the price pumped from 180 to 250 levels.
Since level 180 USDT showed as a very solid support zone, I expected the price to go higher in the following days.
If we do so, we can expect the price to be pumped to the local resistance around level 200 USDT as it also stands for a psychological resistance zone, if we manage to break this price, I am predicting to pump into 240 USDT levels.
Please feel free to share your opinions and thoughts!
Thank you for any support or advice!

COMPOUND - Bottom trend Hello trading friends,
Compound showing a trend where it could be possible that this is a new button area for new uptrend gain.
This depends on the historical trend 2021.
It's a coin with long-term expectations.
Targets
249 usd are at long term a great target, as this is also the main target and split target.
The compound is not for the fast expecting, it can take some time, but even with the before breakdown trend it's still healthy for new range gain.
Have a great day

$COMP - Accumulation Phase (Wyckoff Pattern) I am comparing my views on $COMP which looks very similar to Wyckoff Accumulation pattern which you can find easily. I would suggest you to all wait and long from SOS (Sign of Strength) which will most likely be consolidation in bull flag. Targets are 320, 410 and 520. Feel free to drop any comments in doubt. I will post the trade when we see SOS.

#COMP Will play like this ?Comp in good support, and bounced many times here.
Expecting the price to move like my pattern.
COMPOUND - LONG TERM VISIONHello trading friends,
The compound is still interesting for long-term targets. normally this coin had already to be increased, but one of the reasons this coin did stay at the low trend, and with the breakdown trend of bitcoin it did breakdown further.
We are now at a level where this coin can be interesting for the spot and long term.
Depending on data compound could still show the trend that it should show.
The targets
into the chart there are adding some targets, every target we enter with confirmation and time frame can bring us to next one.
This is not a trading call, but OpenView about the interest of the project.
Have a great day!
@ soon more about it

COMPUSDT, We supported in PRZ levelHello everyone
Compound is one the most powerful project that is working ...
If you need to know and want to learn fundamental analysis you can send us messages in private
Accroding to the chart and previous analysis of COMP, After the price break the sensitive support zone area and our SL activated we analysed chart again that we found the point for the swing trend.
We shown on chart PRZ level that can support the price and start new movement of upwards.
The price exactly supported in support zone and its time to buy one step in here, the price according to the supported in zone has the potential to go up and test trendline resistance.
If it can go up with powerful momentum it has chance to break the trendline resistance and if it can break the resistance successfully it can move upwards more to new target.
We will update new target after break happen.
Dont forget use stop loss and put it below the lower shadow of candle in the zone 1-2% lower than that.
Good Luck
Abtin
Previous analysis :

COMP/USDT swing trade ideaIf BTC does not nuke $COMP looks ready for some upside. Targets in chart. No idea how long it will take. Gun to the head I would say a couple of weeks to a month.

COMPUSDT Analysis (potentially + 50% in shortterm)Hello friends.
Please support my work by clicking the LIKE button(If you liked).Thank you!
Everything on the chart.
open pos: market and lower
target: 230 - 250 - 270
after first target reached move ur stop to breakeven
stop: ~171 (depending of ur risk). ALWAYS follow ur RM .
riwk/reward: 1 to 7
risk is justified
Good luck everyone!
Follow me on TRADINGView, if you don't want to miss my next analysis or signals.
It's not financial advice.
Dont Forget, always make your own research before to trade my ideas!

COMP/USDT - ready for run upHello everybody!
This coin looks ready to run up.
Currently above bearish trendline, buy volume is growing.
Go for 400-500USD.

COMPUSDT - LONGBased on technical factors there is a long position in COMPUSDT Compound
COMPUSDT Compound
Score 2️⃣
🔵Long Now or set on Key Level 220.0
🟢Target 1 245.0
❌Stop loss 215.0
#K_Level
Every signal has a score from 1 to 5, so accordingly adjust your risk for each signal. The signals with the score of 5 are the most probable ones.
Please support our activity with your likes and comments.

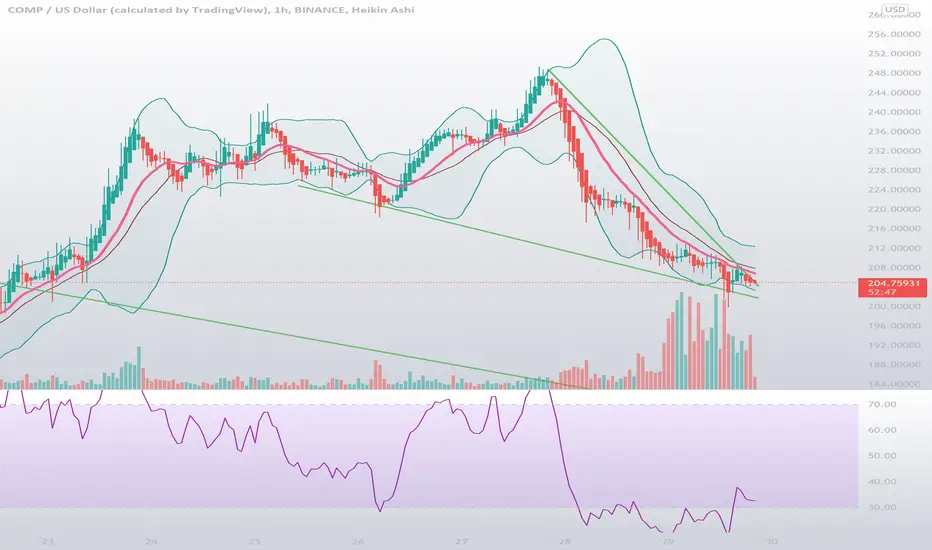
COMPUSDThe triangle were the COMP-token is in for months will end soon. Let's see how this plays out..

COMPUSDT - Falling wedgeProbably a bullish setup on the 1H COMPUSD(T). Most of time this type of pattern will breakout to the upside. Let's watch this..
Compound (COMP) Buy ZoneCompound (COMP) Buy Zone
--------------------
BIAS
Mid-Term : Bullish
Long-Term : Bullish
Risk : High
Currently above our second trend-line support after a weak short term bounce, Compound is looking bullish in mid term. We expect at least a $260 retest on which the entire market depends.
--------------------
$COMP/USDT LONG SETUP
Leverage : x3 - x5
Entry Price : 235 - 251
TP 1 : 259.5
TP 2 : 274
TP 3 : 289.5
TP 4 : 313
TP 5 : 331
TP 6 : 368
TP 7 : 407
TP 8 : 449+
Stop Loss : 209
*Maximum 2% of Portfolio.
*Unload 12.5% at each TP. Whenever TP 2 hits, Move stop loss to entry.
--------------------

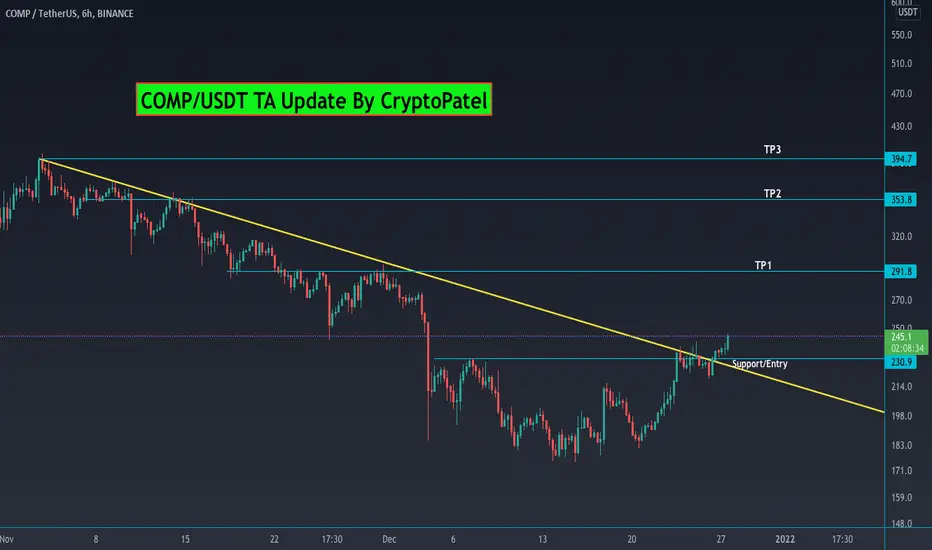
COMP/USDT Bullish breakout and Ready for Big Move#COMP/USDT TA update:/
$COMP currently trading around $245
I am bullish on $COMP
I am buying some here and waiting for some around $240
Entry:- $230-$240
Targets:- $291/$353/$394
Stop Loss:- 218
So I am accumulating more at dip with Tight Stop Loss.
Support:- $230
COMPUDTthis one seems to still have some room for upside.
If this S/R flip holds we are in for a treat this season.
Manage risk accordingly and take profit or add when you have to.
Remember , when structure is broken it doesn't immediately mean we moon. Have patience and wait for confirmations.
