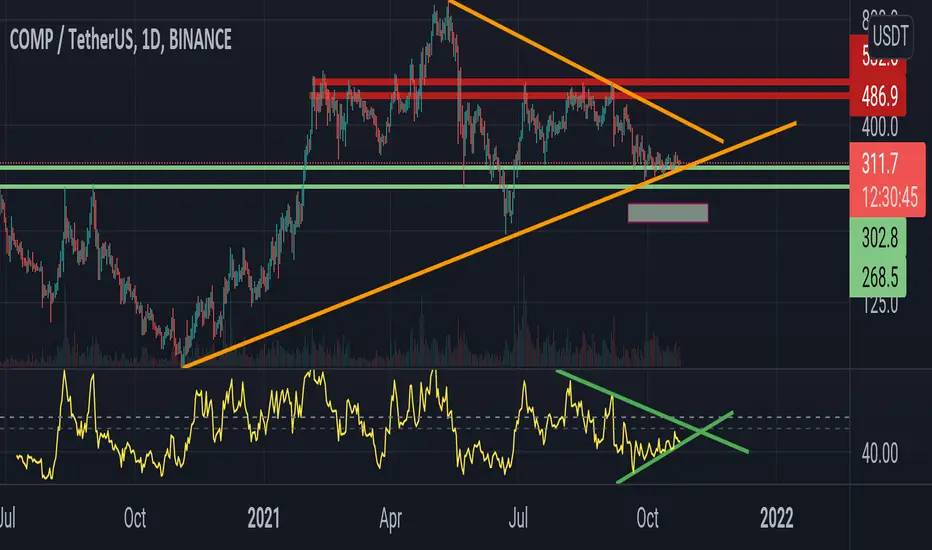
Compound looking for a solid recovery from hereROUNDED BOTTOMS PAY THE BILLS
I have marked all major resistance zones. hopefully it is going to break that resistance zone and and convert it into new support.
Cheers
COMPUSDT

COMP - new rocket 🚀🚀If you look at the technical analysis side, COMP looks very good.
The price has been in accumulation for a long time while getting closer and closer to the trend line. After yesterday's fall, the price has recovered very quickly, also we should note the appearance of more volume at the bottom. This is a good signal for growth. A breakdown of the trend line might be a good buying opportunity.
Write in the comments all your questions and instruments analysis of which you want to see.
Friends, push the like button, write a comment, and share with your mates - that would be the best THANK YOU.
P.S. I personally will open entry if the price will show it according to my strategy.
Always make your analysis before a trade.

going long on COMPSold my LTC for COMP... regardless of LTC debatable fundamentals, COMP is far more promising in that regard.
As you can see in the weekly chart, COMP has been in the accumulation stage for long and still below the 8W SMA indicating that it is still under valued in a bull run. Add to that COMP is still back to July levels.
Again, the RSI, Ichimmoku Cloud and Ichimmoku Signal and Heiken Ashi are not signaling a buy signal. So it is a pure speculative purchase based on the FA, not the TA or PA.

Comp looking really goodIn order to keep the rythm here i get u the last one. Comp is looking so solind and a stong move should be aproching. If this breaksout i expect it to go to the 0.618 at least.This crypto has always been very volatil and has played out big moves. Definetly is a must have in ur watchlist Be ready for this one and good luck.

#COMP/USDT [ COMPOUND ] trendline touche#COMP/USDT can do it from here after the continuous trendline touche 📈, keep an eye on it👀 .
4H Technical Analysis
⚪️ RSI: 61.78
❇️ Stoch: 90.68
⚪️ MFI: 48.57
❇️ CCI: 183.48
❇️ WR%: -6.75
E.SMA 10 25 50 100 200
EMA: ❇️ ❇️ ❇️ ❇️ 🔴
SMA: ❇️ ❇️ ❇️ ❇️ 🔴
⚪️ ADX: 25.38
❇️ ADX Signal: +DI > -DI (Bullish)
❇️ MACD Bullish Crossover ON
❇️ Parabolic SAR: Bullish
#BTC #Trading #Binance

COMPUSDT Buy SetupHere is analysis of COMPUSDT. You can take your profit whenever you want. Everything is on the chart. Make money and enjoy!

COMPUSDTCOMP has touched its upward trendline and can start a good upward movement. Mid-term targets are shown in the chart.

COMPUSDT Technical Analysis⏳ Spot
💎 COMPUSDT has formed an ascending channel, it has got rejected from the significant resistance zone, if it breaks above the channel it will continues the Bullish move to other TPs
🌐 Tradingview
🏁 Short & Medium Term
💵 Invest Only 5% of your Portfolio
🎳 Entry at Market or at 322.0 - 328.0
☕️ TP1 377.7
🍺 TP2 420.0
🍻 TP3 485.0
🍾 TP4 550.0
🍷 TP5
🍸 TP6
🍹 TP7
🎁 TP8
🚫 SL 303.3
Good Luck 🎲
Check the Links in Description and If you LIKE this analysis, Please support our page and Ideas by hitting the LIKE 👍 button. ❤️ Your Support is really appreciated! ❤️
Traders, if you have your own opinion about it, please write your own in the comment box. We will be glad for this.
Feel free to request any pair/instrument analysis or ask any questions in the comment section below.
We will have more FREE forecasts in TradingView soon
Have a profitable day 😊👍🏻

COMPUSDT : Are you ready to pump ?In COMPUSDT 4h
It had converge for a month .
It almost break out the triangle .
If it break out and stand firm above the triangle ,trading strategy as below .
SL:301.0
TP1:351.4
TP2:370.8
TP3:378.7
TP4:395.6
TP5:422.9
If you like this analysis, give it a like or share your thought or let me know what crypto TA you want to know.

Still on a Long position for CompUSDT it seems like a triangle breakout to me and I think Comp will meet it's targets in less than two weeks ;)
I'm hoping for ichimoko to confirm my idea in hours
I will post an update

CompAt lower prices, and when Bitcoin reaches the $ 50,000 to $ 55,000 price range, I start buying Altcoins, one of the best of which is Comp.
COMPUSDT Long Position With Two Targets (Compound)If the MACD Signal lines Cross each other my signal confirms and it's a buy signal for COMPUSDT. Let's see what happens :)

COMPUSDt analysHello friends.
Please support my work by clicking the LIKE button(If you liked).Thank you!
Everything on the chart.
I've seen ascending triangle.
open pos: 425-440
target: 620 and 700,after first target reached move ur stop to breakeven
stop: ~380+-5 (depending of ur risk). ALWAYS follow ur RM .
risk/reward 1 to 6
Good luck everyone!
Follow me on TRADING View, if you don't want to miss my next analysis or signals.
It's not financial advice.
Dont Forget, always make your own research before to trade my ideas!
Open to your questions or suggestions(Looking for investors!).

COMP bullish Pattern HarmonicBINANCE:COMPUSDT
ETH Harmonic Pattern Long
Down Pattern
- Anti Gartely
- Anti Butterlfly

analisis for comp/usdtanalisis very simple based on ressistance support fibonacci extension and price action
I think this alt will fly also because of the pair with comp/btc

COMP/USDT ONE day chartCOMPUSDT one-day chart. I think this is a bullish engulfing pattern. So the COMP price moves upward.
This is my personal opinion.
.
.
.
What u think !!!!!!

Alts pump stated - Ex CompHello,
Here is what I have identified, based on one of my own custom indicator.
My indicator called DCA Daily Buy (but also working on 12, 4h, 1h, with adujsted settings), supposed to help me identify bottoms on big coins : BTC, ETH, LINK, LUNA, COMP, SNX, and some others, vs USDT.
I have found by mistake that vs BTC, my indicator was already flashing sigals to buy.
And when I compare for example compusdt and compbtc, I see that when compbtc start to move up, compusdt also moving up, soo I have set some buy order... :)
compbtc :
compusdt :
CompBTC Compared to CompUSDT :

COMPUSDTBreaking out of Falling Wedge Pattern and Establishing targets towards 400 initially followed by 450. However any closing above 450 would open 500 - 530 as next upside.
On downside 300 acting as strong support.

COMP/USDT LONG SETUP!!Comp Should Break The Consolidation To Upside For More Upward Movement.
Currently Comp Is At Weekly Support Thats Why I Longed From There.
Stay Blessed.

COMP big bullish move incoming?COMP has been consolidating above a previous support level for close to a month now and has started to form the first halve of what could be a parabolic curve bouncing off the trend line. The parabolic sar indicator has turned bullish on the daily timeframe for a couple of days now and there is a slight bullish divergence on the RSI daily. Even though support looks steady BTC can spoil the party so I would look at entering a long on spot or with low lev only. First target around 520 easy.

COMPUSDT Technical Analysis⏳ Spot
💎 COMPUSDT has formed a Wedge pattern and a descending channel. After breaking above the descending channel it has gone for the retest. The price has got rejected from this zone. I am expecting that the price starts to go higher from this level.
🌐 Tradingview
🏁 Short Term
💵 Invest Only 5% of your Portfolio
🎳 Entry at Market or at 310.0
☕️ TP1 330.0
🍺 TP2 345.0
🍻 TP3 420.0
🍾 TP4 _____
🍷 TP5 _____
🍸 TP6 _____
🍹 TP7 _____
🎁 TP8 _____
🚫 SL 290.0
Good Luck 🎲
Check the Links in Description and If you LIKE this analysis, Please support our page and Ideas by hitting the LIKE 👍 button. ❤️ Your Support is really appreciated! ❤️
Traders, if you have your own opinion about it, please write your own in the comment box. We will be glad for this.
Feel free to request any pair/instrument analysis or ask any questions in the comment section below.
We will have more FREE forecasts in TradingView soon
Have a Profitable Day

COMPUSDT Reversal EntryA break out has at the top of the descending triangle, waiting for the retest before a potential buy BINANCE:COMPUSDT

COMP/USDTCOMPOUND trend in falling wedge where make a bottom at 279$ and then test it three times ..so my conclusion is "that is a solid bottom :)" then broke falling wedge pattern make support on golden pocket 315$ ..now need to flip resistance to support at 338$. where make a potencial W pattern/bullish ..potencial long price is on the chart..cheers
