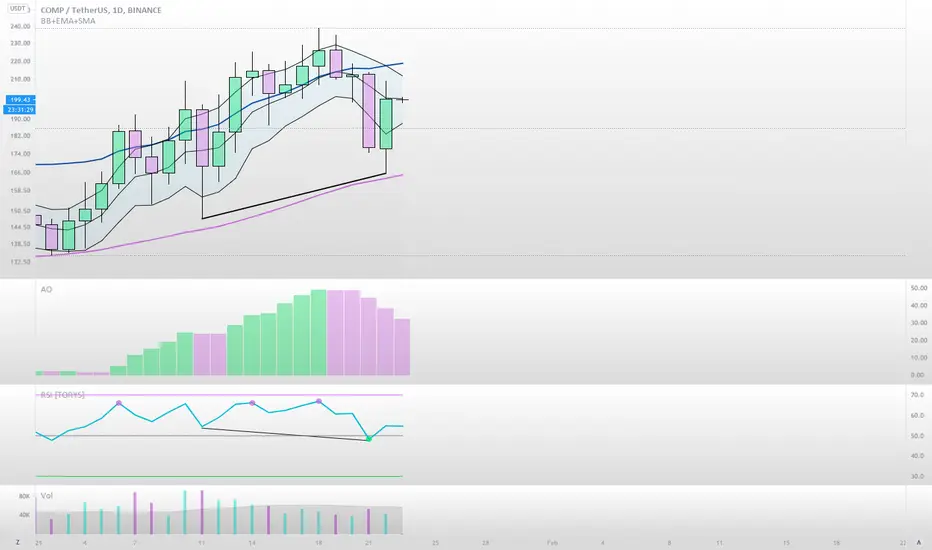
COMPUSDT


COMPUSDT ( Comp/TetherUS), Buy On H1.COMPUSDT ( Comp/TetherUS), Buy On H1.
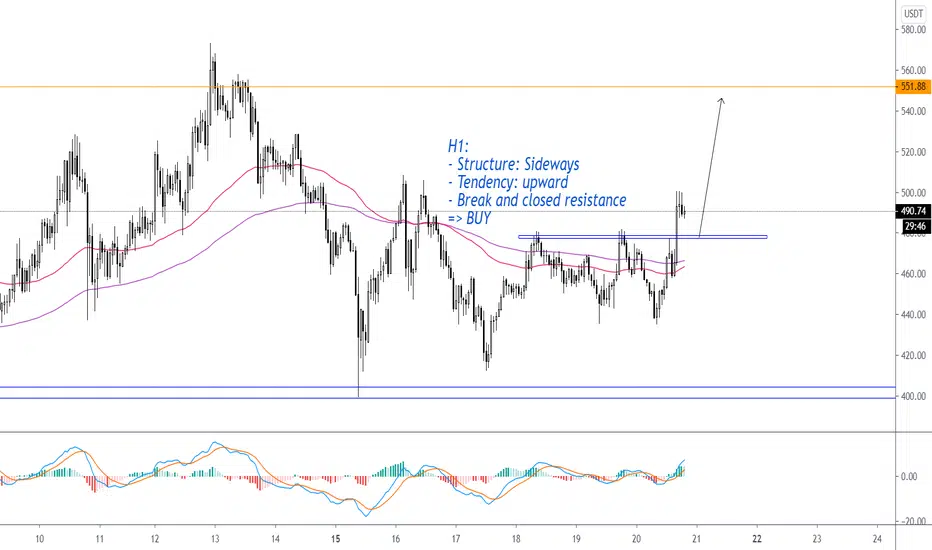
H1:
- Structure: Sideways
- Tendency: upward
- Break and closed above resistance
=> BUY
COMPUSDT ( Comp/TetherUS), Buy On H1.COMPUSDT ( Comp/TetherUS), Buy On H1.
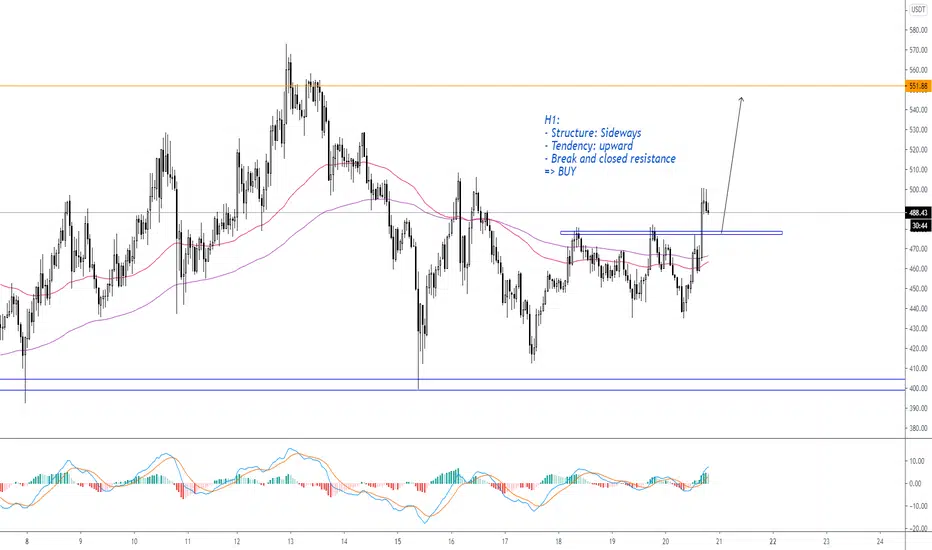
H1:
- Structure: Sideways
- Tendency: upward
- Break and closed above resistance
=> BUY
🆓Compound/USDT Analysis (20/2) #COMP $COMPCOMP is accumulating a lot in $400-550 zone and this shows us that COMP is a very potential coin and very profitable for us.
📅NEWS
No News
📈BUY
-Buy: 440-460$. SL if B
-Buy: 540-570$ if A. SL if B
📉SELL
-Sell: 540-570$. SL if A
-Sell: 760-800$. SL if A
-Sell: 1050-1100$. SL if A
-Sell: 1550-1600$. SL if A
♻️BACK-UP
-Sell: 440-460$ if B. SL if A
-Buy: 340-360$. SL if B
❓Details
Condition A : "If 8H candle closes ABOVE this zone"
Condition B : "If 8H candle closes BELOW this zone"

COMP COMPOUND GOVERNANCE - Breakout - COMPBTC COMPUSDT COMPUSDCOMP COMPOUND GOVERNANCE - Breakout - COMPBTC COMPUSDT COMPUSD

COMP-USDTGreetings,
COMP is currently at #9 on the DEFI list. This coin I trade for a long time, but unlike other instruments DEFI (SUSHI, 1INCH, ZRX, YFI, MKR, etc. links will be found below), did not make trading ideas, it's time to correct.
On the daily chart we can see that the price works out a concave bottom with a target of +/- $800
On the 4-hour chart, an upward triangle is forming (lows are rising and the upper shelf is resistance level 530-560$, similar situation as in bitcoin before 50 k$
Also possible is the formation of an ascending wedge after the breakdown of the triangle, and its further break upwards. A breakout potential of the triangle is 50% from the upper boundary, which will also take the price to $800.
If the support of the trending triangle does not hold the price, the next area of interest in my opinion is where the drop will be repurchased at 340-360$.
To bitcoin, the price went under the trendline, which is not good, and a falling wedge has formed at the moment.
Daily chart
4 hour chart
Always use a stop loss, and do not use a leverage greater than x3.
A trader should always have tomorrow.
If this information is useful, please like and subscribe, so as not to miss anything.

COMPUSDT Credits: Seen on MitchRay's stream yesterday
The Compound Dragon pattern looks even better now, makin higher lows and potential hidden bullish divergences (as its tradition) developing on the daily and now bullishly engulfing on the last 4h candle of the day.

#COMP took the retracement off the lower boundary of the channel#COMP took the retracement off the lower boundary of the channel, I expect reaching the upper boundry level - Stay tuned for an updates

Compound (COMP) can potentially rise 160% - High and Tight FlagCOMP did break out above the top of the flag pattern, but the price has since dropped.
If the price can continue to rise we could see gains of 160%.


Buying CompoundComp looks to continue the uptrend against USDT and BTC. Buying the breakout to earn a few extra sats.

Comp Bullish Pennant breakout SetupComp Cryptocurrency token price looks good for breakout
Buy below 535
Stop Loss 443
Target : 590 , 635 , 700 , 830


#COMP to 650$ #COMP looks ready for next leg up
Retraced to fib 0.618 and retest. We had there some bullish engulfing candles on 4H
Bounce from new support zone
Formed a ascending triangle... soon to breakout
Target 650$
Enjoy!!!

COMPUSDT Short TermBreak out downtrend Channel ,We see the general trend within an uptrend channel.
I am waiting for the Targets
According to the 6% Stop loss, I recommend Spot.

COMPUSDT -+335% profit.the last idea brought 335%
The hardest part is sitting on profit...
R/R - 1/39
What were your results?


#COMP is pushing the horizontal resistance for the fifth time$COMP is pushing the horizontal resistance for the fifth time , Breakout imminent 🚀

Warriors... COMP out and Play!!WARRIORS!! Comp is at a resistance.. Can it break? If so mission.. COMP-lE-TE!!! No Pun INtended.. This is not financial advice. Lets GOOOOO!!!

COMP Long$COMPBTC and $COMPUSDT has had more than 10% retracement on the H4 TF, we could see a bounce and upward continuation. You could take a position in the purple box and get a 30x riding up...