Probabilities in Trading!? Short termHi guys today ill be trading USDCAD cause i saw i short term sell. This might not work but ill give it a shot because my set up tells me to go. Good luck
Confirmation

AUDNZDContinuation flag is forming on daily TF, I will be looking for rejection in the zone below and potentional BUY opportunities.

AUDCADI would like to see pull back to the green zone before price will take to the treand line above.


USDZARApproaching trend line and strong area - expecting rejection after fundamentals and exhaustion.

USDHUFApproaching strong resistance area, also TDI is overbought on multiple time frames. Let's see what will happen after fundamentals.

EURGBPHas touched and respected structure, after 3rd touch of the trend line below I wait for the next 1 hour candle to close as a confirmation for long trade.


GBPCADPOTENTIONAL REVERSAL HARMONICS PATTERN, waiting for reaction at resistance level and confirmations.

USDZARhas broken with strong momentum previous structure of retangle pattern on Tuesday - now is has been at another structure level from higher timeframe
therefore, it may reject to the previous resistance or trend line above or we can break this support structure and expect a drop about huge amount of pips

Uptrend channel continuesUptrend channel continues.
Watch this hammer bullish candle at the bottom. It´s a confirmation.
Buy now. Target: Top of the channel. SL: A few pips under last low
Keep it simple.
Good trade!!!

GBPJPYAll GBP pair looks similar, it just need patience to wait for the confirmation, but situation with libra may continue drop.

USDZARUSDZAR has been consolidating for a while and creating a retangle. I does smooth moves every day, so I personally will wait for break of the structure. Then for break of the 16.36220 price level area for long term sell - strong resistance area.

Will NZDCHF Give a confirmed entry in this zone?the highlighted zone is an area of interest to me. I am not just looking to buy at this level. My bias may be long but i need to find a confirmation to enter the trade. (DB, engulfer etc)
This is a trade setup that i found and identified on a 1 on 1 session with a TeePee Student.


EURJPY 124.782 - 0.56 % SHORT IDEA * CONTINUATION PATTERNS Good Day Everyone
On the EURO / YEN the pair is currently holding the descending channel structure as the market closes, looking for continuation of the trend on the pair in this coming week.
The pair is currently trading in a bearish flag formation when scaling down a little which could signal continuation with the trend should RESISTANCE LEVEL 125.066 HOLD...
lets's see how it goes...
HAPPY TRADING EVERYONE
_________________________________________________________________________________________________________________________
ENTRY & SL - FOLLOW YOUR RULES
TP 1 - 124.294
TP 2 - 123.459
SL - 125.175
RISK-MANAGEMENT
PERIOD - SWING TRADE
__________________________________________________________________________________________________________________________
If this idea helps with your trading plan kindly leave a like definitely appreciate it.

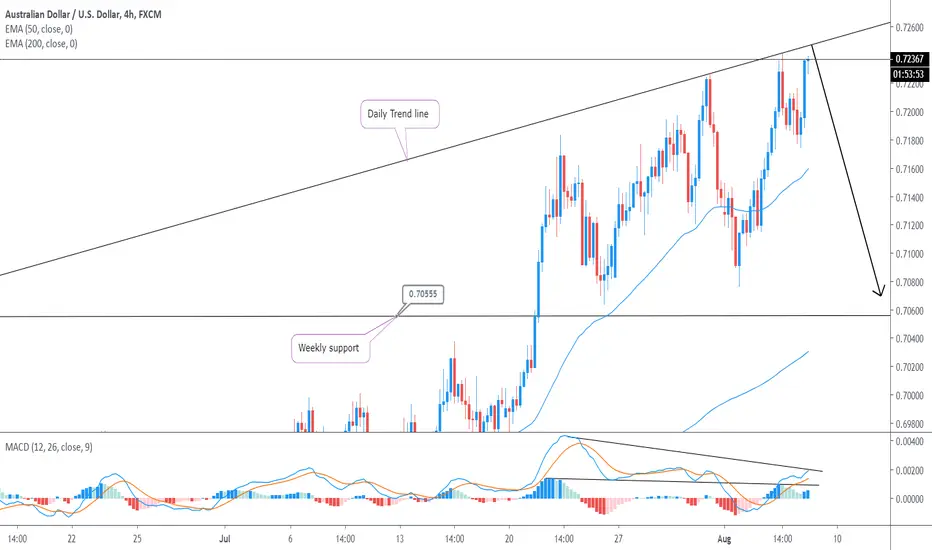
AUDUSD Weakening2 weeks ago this pair broke the weekly resistance level (now support) my overall bias for this long term (for now atleast) is long, however, with the price action weakening more and more, and the pair approaching a daily level, i will be looking for confirmations of a short. MACD shows us weakening of the rally through each push higher across both the HISTO & the MA's - full divergence in play.