BTC will test 10.300 USD soon?_BTCUSD_20200206After consolidation around MA200 and made zone 9,400-9,500 become support, BTC can test the zone 10,300 USD. At this price, also marked by Fibo 0.5 and BTC was denied in Oct, 2019 in a rally of nearly 3,000 USD so if BTC reclaims this area, it will confirm we have higher high in a uptrend phase from bottom zone between 6,400-6,800 USD.
Let we see if we can hold the price at over 10,000 USD this time. In this case, 10,150-10,300 USD can become the support region, we can see BTC test the high 11,000-11,200 zone before having other actions. MACD and RSI on daily chart support we can go higher from now.
From weekly chart, we can also see the signals that price can rise from MACD and RSI which we can expect 9,900 and 11,000-11,200 USD can become resistance in this increase.
P/s: NIAH (Not investment advice here) ^^
Confirmation

Moving Average Crossover??I've noticed that moving average are about to cross over or very tight together.
50 EMA & 200 EMA..
Possible downtrend move of 60 pips maximum.
Remember, no crossover, no trades.. Because most of the time moving average doesnt even cross over, they just are really close together then departs!! So never know until you see clear confirmation!

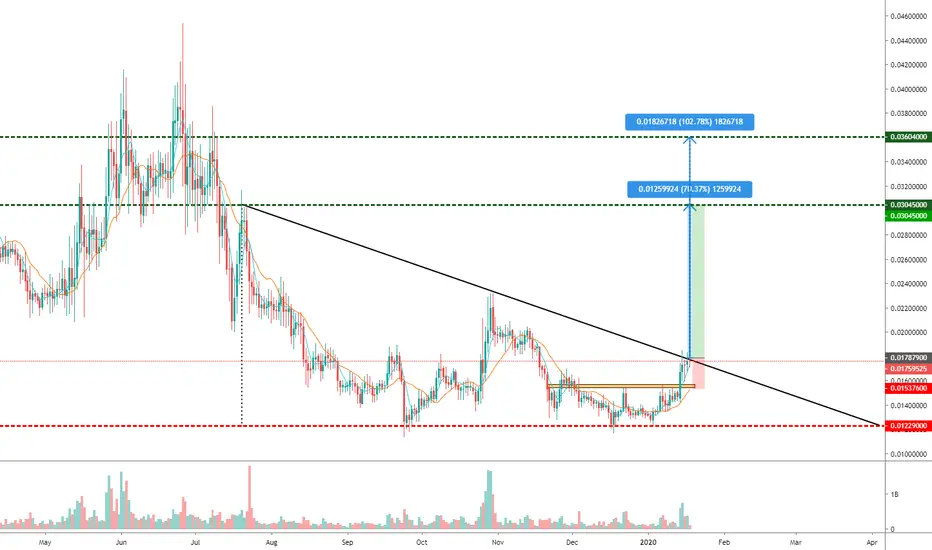
TRXUSD: possible long scenario, waiting for confirmationTRXUSD has formed a descending triangle technical price pattern on the daily chart. It seems reasonable to join bulls after the price closes above the trend line (which is now being tested), so it's better to wait for the confirmation.
Entering around 0,017879 price with stop below 0,015376 and take profit between 0,03045-0,03604 provides R:R above 5:1.
TRX annual yield: 0,14%
//
Follow me to stay updated.)
ULTA Prepping for its move.As i said on friday Ulta had 2 options it took the ladder forming a stronger base. Hit lows of today and double barred up. Watching closely till we get a break in the wedge. wont add positions until we get confirmation to much chop for me.


Looking for a longI'm looking for a long.
- I see test a broken trendline
- I also see a trendline confirmed at this spot
- There is a fib retracement
My TP area will be also the zone where i'm trying to catch a short.
If the region at my SL got reached, i think we die to the downside.

SPX500 – MACD Divergence Indicates for Reversal Opportunity soonThe SPX500 has reached a new record last week.
The price has a significant divergence with the MACD indicator which indicates for a reversal opportunity.
If the price will breakout the support below it will be the right signal to look for a price action setup to sell the SPX500 index.
The demand at the bottom will be the target for this position.

EURJPY | Daily We see a double bottom where we have to wait for the price to return a little and then we can make a deal!

Bitcoin BreakoutThe buy price is on the backtest of the 200ma.
Target $10,000 again.
The stop price is below the upper blue rail.

BTCUSD - Trading in formation? Important levels to watch!_______________________________________________________________________________________________________________________________________
Hello traders investors and community, today I will have a look at the current price action BTCUSD is providing us.
We are looking locally on BTCUSD with possible short term trade entry.
_______________________________________________________________________________________________________________________________________
Currently, BTCUSD is forming a descending wedge on the 2-hour timeframe, these types of patterns are known for a break-out to the upside.
However, we have resistance in bitcoins trading range at 8555 and 8745, which where we have a pull-back when we touch it.
_______________________________________________________________________________________________________________________________________
The bullish outcome of the wedge is expected but we have to watch out with how much volume and momentum the break-out occurs.
As for now the volume looks rather weak then bullish . A possible short term LONG position can be entered whether in the orange support area seen in my
chart or with a break-out and confirmation of the wedge .
_______________________________________________________________________________________________________________________________________
We have strong support between 7670 and 7850 where a price bounce is highly likely when we visit this are again. At a bullish continuation the 8000 USD
are is very important where we seen several bullish upthrust which where a part of the range formation in which BTCUSD is trading now.
_______________________________________________________________________________________________________________________________________
The RSI is sending neutral signals right now, as i changed the RSI value from 14 to 28 to have a better look on locally price action which differs on the 2-hour
time-frame from the 4-hour time-frame. A visit of 15 - 30 in the RSI will give a bullish signal.
_______________________________________________________________________________________________________________________________________
Thanks for watching! May you have a good day and all trades going well! For more market insight feel free to support!
The information provided is for educational purposes only and should not be used to take action in markets.
_______________________________________________________________________________________________________________________________________

BTCUSD - THIS PATTERN COULD LEAD BITCOIN TO NEW ATH__________________________________________________________________________________________________________________________________________________________________
Hello traders investors and community, as BTCUSD shows some good bullish momentum and volatility I made an interesting observation which I share with you today.
__________________________________________________________________________________________________________________________________________________________________
In the last bull run, BTCUSD formed an inverted head and shoulders with a confirmation on the support level of the head. You can see it in my chart marked with the green box.
Normally the target of this pattern is the percentage length from the top of the head to the neckline, BTCUSD made double of this length projected from the head to the top of bitcoins bull run.
__________________________________________________________________________________________________________________________________________________________________
When looking on the daily chart , BTCUSD could exactly form this inverted head and shoulders in big format as seen in my chart, with confirmation above the last top at 13800.
We have strong support between 7900 and 8000, when we visit this area again it is highly possible that we test it as support again, the same as BTCUSD bounced several times in the 10000 area.
__________________________________________________________________________________________________________________________________________________________________
This pattern can be taken into consideration when BTCUSD comes back to the support area and establishes to hold the 7900 - 8000 range as support and form bullish momentum.
When the pattern confirms and makes a clear confirmation above the top of the last bull run, the target between 24000 and 25500 will be intact, that would be a new all-time high for BTCUSD .
__________________________________________________________________________________________________________________________________________________________________
For this scenario, it is important to hold the 7900 to 8000 range as support otherwise when we fall under this level new lows could be possible.
A look at price action in the range should be taken into consideration before making any decision.
__________________________________________________________________________________________________________________________________________________________________
Thanks for watching! May you have a good day and of course all trades going well! For more market insight feel free to support!
The information provided is for educational purposes only and should not be used to take action in markets.
__________________________________________________________________________________________________________________________________________________________________

Wait To See if The Price Will Breakout The SupportThe EUR/USD price is bullish for intraday traders.
However, on the higher time frames, we can see the price arrived into a fresh supply which can turn the price
Back to the bearish zone.
The support below is my confirmation if the price will breakout the support it indicates the price tends to reach the demand below and
Therefore I'll look for a price action setup to sell EUR/USD as a day trade position.

THE STAKES FOR SHARP ENTRY ARE TOO HIGH!!!OANDA:XAUUSD
I took total of 4 trades on Gold in the last 2 weeks. All of them hit my target TP.
Do I aim for sharp entry? Well I don't. Not anymore.
I used to chase sharp entry before, but now all I want is profit. Not perfect entry. The stakes for sharp entry are too high. Also, you need to stay focus all the time and mainly use limit orders to place your order. You might get stopped out multiple times before you finally catch the reversal edge or you might missed out some good trades as well.
As you can see all my past trades on gold are based on structure breakout. I do not aim for sharp entry, but I'm looking for confirmation. I wait for confirmation (aka structure breakout) then only I place my order at the market price.
Is waiting for confirmation performs better than trying to get sharp entry?
Don't be surprised, IT IS WAY BETTER!
Of course there are some opportunity costs waiting for confirmation. My SL is larger, my risk to reward ratio is lower (1 to 1 if I really have high confidence). But I'm still able to make 1:2, 1:3, or even 1:4 RRR. Another opportunity cost will be my entries are late.I do not catch the earliest reversal, I enter the market only after the momentum is picking up.
Another cool part trading with confirmation (my confirmation is structure breakout) is that I have more time to do other stuff. As I'm trading the 4H chart, I'm reducing my screen time and only look at the chart every 4hour and it took me less than 1 minute each pair to make market decision.
In summary, structure breakout is my confirmation & entry at the market after confirmation give me higher win rate while still able to maintain my RRR. I got more time to other stuff and really enjoy my life as a trader. I'm not that adventurous anymore to chase for sharp entry. Entry late, but still profit.
So my advice, make yourself wait a little bit longer when you want to trade. Be patience and wait for confirmation might be a short cut for you to become a profitable trader. :)
Hope you learn something from this article.
Enjoy, follow me & share this if you like it.

audcad shortBearish trendline, retested at 38.2 fib aawaiting candle confirmation on 4h chart. potential sell 1:3 profit and loss ratio.

USDCHF H4 CFM SHORTPrices went deeper into weekly supply, got rejected and lost momentum. Getting a short at the current H4 supply with first targets at the H4 demand 2R away and final profits at 0.9815

How do YOU trade harmonics?? So guys, there a tons of way to trade harmonic patterns.... in the end most of them fail so how do people trade them successfully...
I myself decided to look into different approaches to trading harmonics. I have looked at tons of charts on different timeframes and i found an approach I was not able to find online anywhere for some reason... (wonder why)
I have never seen a trading strategy that could provide you with this amount of RRR. The risk per trade is absolutely minimum, while the return is maximum.
The process is quite simple, and im sure this is what most of the real traders out there are doing, and probably charging thousands and thousands of dollars for teaching this to people. But its all good!
First you must find a harmonic pattern. This should be easy with all the software out there. (some guy said you take the ''art'' out of trading by doing this, please don't be that guy)
For this approach, price will have to see a retracement greater then 50% of CD in the harmonic pattern.
if price retraces down to the 61.8% this will follow with a pullback to 23.6%. Afterwards price will come down at touch the 23.6%, (sometimes a few pips above or below) to trigger all the pending orders. Price will fight its way up to touch the 127.2% extension, while finding support at fibonacci retracements greater then the initial 23.6% ( it will not go under this level! )
If price retraces down to the 78.6%, it is considered strong and the move is expected to turn at 161.8%
In some cases the move will go much higher, extending up to 4.618% (!!?)
Same approach for bearish situation.
Now the price does not always retrace to those exact levels, but when it does you can be 100% sure that it will happen.
With this approach you will have signals, confirmations and entry points based on pure data!
If you happen to find this approach useful, give the post a like and comment below with your ideas.
God bless

XAUUSD SELL WAIT FOR CONFIRMATIONPULLBACK MAX UNTIL 61% WHICH ONE
MATCHES WITH A TREND LINE, THEN
A SELL UNTIL A TP OF -27%. WAIT FOR CONFIRMATION FOR THE SELL

CRUDE OIL CFM H1 SHORT in DAILY SUPPLYPrices rallied close to daily supply, lost momentum and removed opposing demand. Would be looking to get an aggressive short entry when prices rally into H1 supply for the short

GOLD CFM H1 LONGPrices dipped into daily demand, lost momentum and removed opposing supply zones. Will be looking to get long at the current level once market opens


EURUSD H1 (30m clean up) CFM SHORT IN DAILY SUPPLYPrices rallied into D1 supply, lost momentum and removed opposing zones on the H1 time frame. The 30 min time frame was used to fine tune the entry.

H4 CFM CRUDE OIL SHORT in D1 SUPPLYPrices rallied into daily supply, lost momentum and removed opposing zones. Looking to get short at the H4 supply with H1 clean up
