USD / CAD SHORTDisclaimer: Any of the content presented on my page showing my analysis of the market is just that, an analysis which means this is my personal opinion of where the price is going to go. Do not by any means take this simple analysis for a reason to enter a trade, I am not presenting these analyses as a form of signals, simply a way to get feedback and opinions from others on how my trades look. Take this trade at your own risk, but know forex is a risky market that you can make a lot of money but can lose that money or even more just as fast, enter these markets with your own risk and good luck with your trading :).
4 Hour Analysis:
The price has been going in a down trend on the daily and the four hour. Price had stalled out and started to range but did not have a problem making lower lows throughout this range and has also showed rejection to the upside while making moves to the downside. All I would need for a trade at this point is confirmation on a lower time frame and I would be risking one percent of my total capital.
1 Hour Analysis:
Price was about to breakout of this range so I got ready waiting for a strong bearish close below the lows of the range. If price breaks below these lows but only by a few pips, that would not be enough confirmation for me to get into this trade, I want a strong candle to the downside before I even consider getting into this trade.
Risk Management:
Stop risking your entire account on one single trade, this is going to lead to a massive loss adventually and even if you are on a big winning streak all it takes is for one trade to go south and your account could be blown in one trade. Keep your risk management in check and stay consistent, slow down and set a set amount to risk on every trade, for me I risk one percent of my total capital on every trade NO MATTER WHAT or how juicy the trade is or could be. Have a set amount cause in the long term a consistent risk amount will really reveal your edge in the market and put it to work. Look, everyone is different in the way they trade but so everyone is going to risk more or less depending on the person and the kind of strategy, see what works best for you and stick to it.
Good luck to you all this week, I hope you have an amazing trading week and please let me know if you have any questions and I can do my best to help you out.
Thanks again,
KeySlot.
Confirmation

EUR / AUD SHORT PositionDisclaimer: Any of the content presented on my page showing my analysis of the market is just that, an analysis which means this is my personal opinion of where the price is going to go. Do not by any means take this simple analysis for a reason to enter a trade, I am not presenting these analyses as a form of signals, simply a way to get feedback and opinions from others on how my trades look. Take this trade at your own risk, but know forex is a risky market that you can make a lot of money but can lose that money or even more just as fast, enter these markets with your own risk and good luck with your trading :).
Daily Analysis:
Price was previously stuck in some kind of range at the top of this last push, one thing that shows me that their is a lot of weakness to the upside is the amount of wicks that price had left when making a push down. Now, after that rejection price has not been able to be stopped and has been continuing to push lower and lower reaching the recent lows and stalling out for a bit. With a price confirmation on a lower time frame this could be a potential trade to the downside and could be one that could take a while to fully play out, if you are patient enough you could get a good amount of pips if it plays out in our favor. Wait for more confirmation on the lower time frames and decide for yourself what would be a good entry tailored to your specific system.
Hourly Analysis:
On the lower time frames you can see down below, price had tried breaking down below the 1.57778 area, price has now shown a lot of momentum to the down side and is showing only more of a reason for us to get into this trade. For the system that I trade if I get into this I already have a set risk amount which will be only one percent of my total capital at any given time. The only reason I would add on to my position or risk any more on a given trade is when I have my stop at breakeven and price is well below it, I might place another trade risking one percent overall.
I hope you all have an amazing trading week, and good luck to all of you out there.
If you have any questions about how I trade or you want more details, feel free to leave as many questions you may need down below and I will get back to you as soon as possible.
Thanks again,
Keyslot

SHIBS - Confirmation is key, shitcoin or not. Is SHIBS a shitcoin? Absolutely.
As a trader, even in a shit coin, you find opportunities.
The last impulse move has rejected at the previous ATH candle close. IF we manage to break that previous high I will be watching for an entry and rise a potential second wave.
If we fail to push higher RIGHT NOW, and potentially lose the lower support. Then so be it.
If you are not in SHIBS right now, stay on the sidelines - WAIT FOR CONFIRMATION

Ethereum AnalysisBINANCE:ETHUSDT
As you can see, there is a trend similar to the bitcoin trend
And if we drew a triangle, we could see the failure of the roof
But now you can see the price after hitting the ceiling
The price channel has reacted and can be corrected as
Let's consider and wait for the canal roof to break because it will make good progress

XAUUSD SELL!Gold has been trading inside the given Channel since July 2020. a few days ago the price bounced back up after testing a strong Support zone , after which it reversed as it approached another strong resistance line of the Channel. Last day's movement has confirmed that Gold is seeking further downside movement . With the Momentum still intact , my Final Target remains 1708!

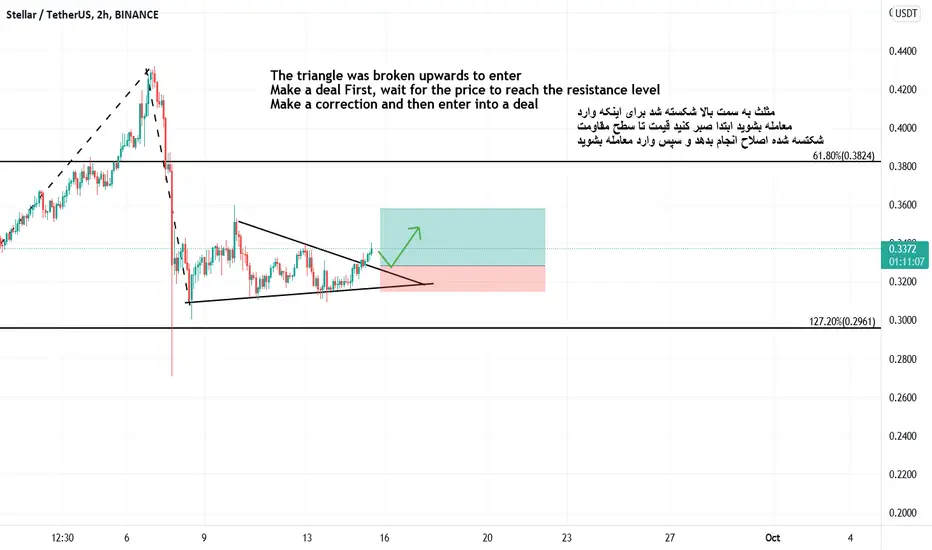
XLM breack triangleBINANCE:XLMUSDT
The triangle was broken upwards to enter
Make a deal First, wait for the price to reach the resistance level
Make a correction and then enter into a deal
Ethereum AnalysisBINANCE:ETHUSDT
Hello friends, since the last time we had atrium analysis
Four days have passed and fortunately he has been able to resist the profession
Break yourself and climb and now align
Fibonacci is broken and has even done his pullback
And wait for the price to stabilize above 4000 to enter
And then make a decision and the last resistance will be in the range of 4370

Wait for the price to retest and appear a sell setup with USDCADH1 time frame.
Structure: The uptrend is broken.
The price has plummeted past the critical 1.25700 support with growing downside momentum.
Here we wait for the price to retest to 1.25800 for confirmation as well as sell signal.
Profit targets are the 1.24900 and 1.24300 zones.
-----------------------------------------------------------------------------------------------
Wish you all have a good trading day!

GBPUSD vs 3 Resistance LevelGBPUSD is retesting 3 resistance at once, the rising wedge lower trendline & its previously resistance area, and its bigger timeframe down trend line.
Of course, we're still waiting for confirmation in Candle Pattern & breakout.
Manage your own risk.
Disclaimer: This content is intended to be used and must be used for information and education purposes only. It is very important to do your own analysis before making any investment based on your own personal circumstances. Accordingly, the writer will not be liable in respect of any damage, expense, or other loss you may suffer arising out of such information or any reliance you may place upon such information.

COMP Head and ShoulderBINANCE:COMPUSDT
There is an almost ideal head and shoulder pattern on the chart
Which you can achieve after the resistance of the pattern neckline
Come in and make a profit of 0.618 and
The price is on strong support that is likely to rise

Nasdaq possible shortThe move we might see for today
We will wait for break of Structure and retest for the sell.
Expected zone is the daily support based on previous days.
Use candle stick confirmation and manage risk
This is a idea and not a signal so please use your own analysis and judgement

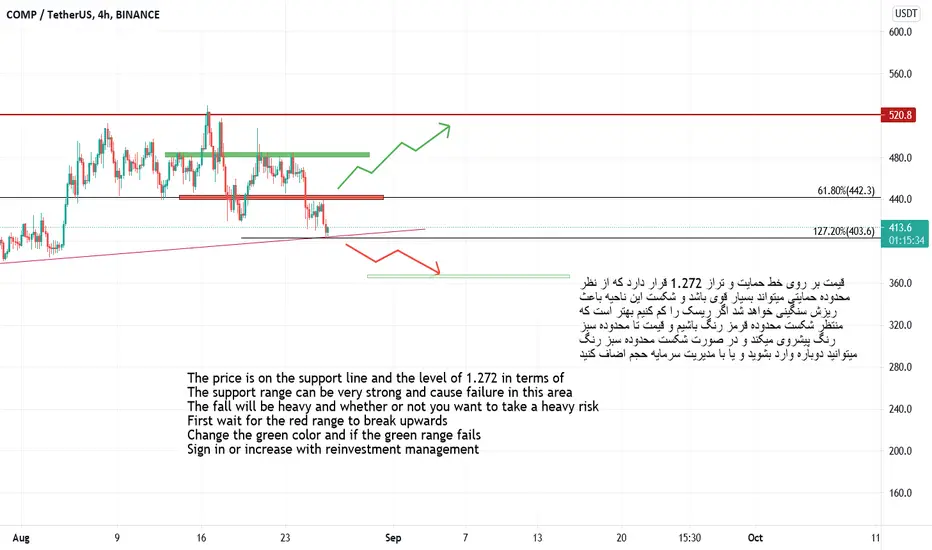
COMP/USDTBINANCE:COMPUSDT
The price is on the support line and the level of 1.272 in terms of
The support range can be very strong and cause failure in this area
The fall will be heavy and whether or not you want to take a heavy risk
First wait for the red range to break upwards
Change the green color and if the green range fails
Sign in or increase with reinvestment management
LINK in TriangleBINANCE:LINKUSDT
The process of guarding has taken a heavy toll and you can
Wait for the price to reach the bottom of the channel and see the reaction after seeing the reaction
Decide which is less risky and the second method is that there is
You can stabilize after being supported by the Fibonacci level
Reaching the top of the midline you can re-enter

IMPROVE YOUR TRADING | 4 TYPES OF TRADE CONFIRMATION ✅👌
"Look for a confirmation!"
"Wait for a confirmation!"
When I was learning how to trade and when I was watching and reading different trading educators, these words naturally pissed me off. What the hell are you talking about? What confirmation?
It was a full-blown mystery...🤯
Then, once I started to mature in trading and trade full-time, I became an author on TradingView.
Posting my forecasts and trading setups, I frequently mentioned the confirmation.
And now the newbies that are reading me and learning from me are pissed off...🤬
That is so funny I guess.
But the truth is that the confirmation must become a fundamental part of your trading strategy. It is your key to successful trading.
What exactly is the confirmation?
It depends on many many different things, in this article I will discuss with you the 4 main types of confirmation and give you detailed examples.
1️⃣ - PRICE ACTION CONFIRMATION
That is actually what I prefer.
Analyzing different markets and searching for decent trading opportunities often times we find some peculiar instruments to watch.
Identifying the market trend and key levels we find the potential spots to trade from.
But do we just open the trade once the "ZONE" is spotted?
I wish it could be that simple...
Trading just the zone, without additional clues brings very negative figures. We definitely need something else.
Price action & candlestick patterns can be those clues.
Accurate reflection of the current local market sentiment makes the patterns a very reliable confirmation.
Dodji's, pin bars, double tops/bottoms ...
Proven by history, the skill of identification & reading the patterns will pay off quickly.
Being in some sense the language of the market, the patterns are the fundamental part of my trading strategy.
2️⃣ - FIBONACCI LEVELS
Fibonacci levels are a very popular technical tool. Being applied properly it helps the trader to confirm or, alternatively, disqualify the identified "ZONE".
With multiple different methods like confluence trading, fibs are applied in hedge funds and various banking institutions.
The main problem with the fibs, however, is complexity and a high degree of subjectivity. Meeting different traders and watching different posts on TradingView I noticed that all traders tend to have their own vision. There is no universal system to apply here, a proper fib.confirmation technique can be built only with long-lasting backtesting and practicing.
3️⃣ - FUNDAMENTAL NEWS
The figures in the economic calendar, news, tweets. Actual fundamental news can become your best confirmation tool.
However, the main obstacle right here is the promptness, validity and reliability of the data that you get.
The information shouldn't be delayed and it must be objectively true.
The search for such a source is by itself is a very time-consuming and labor-intensive business not even mentioning its potential costs.
And that is not all. Knowing how to make sense of that data, its proper perception, and understanding requires a solid economical and financial background and experience.
At the end of the day, becoming an expert in fundamental analysis, the trader can easily sort the trading zones and trade only the ones that are confirmed by a decent fundamental trigger.
4️⃣ - TECHNICAL INDICATORS
I believe all the traders apply some indicators. From a simple moving average to some complex composite algorithms, indicators play a very important role in trading.
Being 100% objective and providing up-to-date real numbers and figures, they are our allies in a battle against subjectivity.
For many traders, the various signals from indicators are considered to be accurate and reliable confirmations.
Many algotrading solutions are operating simply relying on such signals and being able to bring consistent profits proves the power of technical indicators.
What confirmation type should you rely on?🧐
I guess the main rule right here is that the confirmation must MAKE SENSE to you. You should feel the logic behind that. It must make you confident in your action, even in case of the occasional losses, it must keep you calm and humble.
Let me know in a comment section what confirmation do you prefer!
💝Please, support my work with like and comment!
Thank you for reading.

EURAUD: Nice Confirmation to Buy 🇪🇺 🇦🇺
Hey traders,
This week EURAUD dropped to a strong horizontal structure support.
1.59 is the level from where the price managed to break and close above the resistance line of a falling wedge pattern.
For me it is a trigger for a further bullish continuation.
Goals:
1.605
1.612
❤️Please, support this idea with a like and comment!❤️

ALGO/USDT Broke out of the triangle patternALGO/USDT (Algorand) broke out the triangle pattern and made a confirmation. Best time to enter and we could see some bullish movement.
Use the green lines (Resistance zone) as targets. Possible 60% plus
This is not financial advice please DYOR and place stop loss below the red line (strong support zone)

Hdfc morning star confirmationHdfc morning star patter confirmation and indicator cross over confirmation with 2 target

BTC Confirming Support at 38,000BTC passively broke out from the descending channel and confirmed buyers within the 38-37000 range. Continuation of this could lead to a breakout or more resistance from sellers at the upper range of what appears to be a bull flag. A strong daily close would confirm an upwards reversal. FOMO could lead to a complete breakthrough on the initial bounce. On top of this, MACD is on its way to a bullish cross. Wait for daily close.

BitcoinBINANCE:BTCUSDT
Hello friends, in the first step you will see the trend in addition
Failure of the range of 40,000, which is a trend for a while near it
Suffering fluctuated, but after a bit of falling, he was able to make good progress
And also witnessed the failure of long-term bearish resistance
That the price is pullback on the resistance line and for entry
Wait for confirmation

Bitcoin AnalysisBINANCE:BTCUSDT
The trend is currently fluctuating in the form of suffering
To determine if the trend tends to climb
The first price should be able to with a candle that is about seventy percent of it
Close above the specified range and after receiving the confirmation
Can be suitable for entry, and if desired
Again, it can drop to pre-shrinkage size or up to the midline range

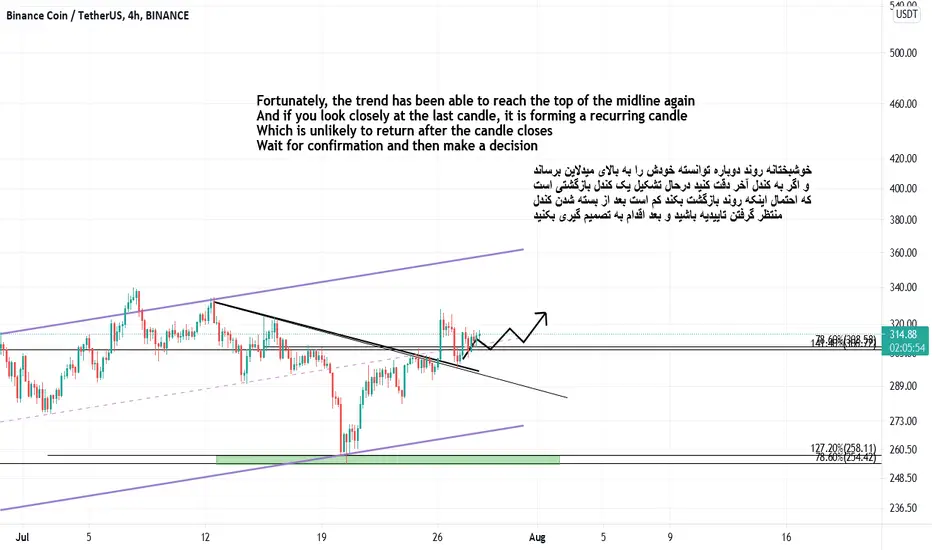
BNB/USDTBINANCE:BNBUSDT
Fortunately, the trend has been able to reach the top of the midline again
And if you look closely at the last candle, it is forming a recurring candle
Which is unlikely to return after the candle closes
Wait for confirmation and then make a decision
ETH/USDTBINANCE:ETHUSDT
Well friends, we are witnessing the failure of the price channel ceiling and the best
Option to enter we have to wait until the price
Complete your pullback and then wait for confirmation from the process
Be able to make an entry decision and if
Do not correct the price and break the level of 0.786 and 1 directly
Try not to make emotional decisions and wait before anything else
Be corrected by price

BTC/USDTBINANCE:BTCUSDT
Hello friends, as you can see, with a time frame of 4 hours
With three candlesticks, the price was able to advance to the level of 1.618 and climb 15%
Has and now the price has to be adjusted to be able to again with one
Break the advance of the 1.618 level and reach the price of 40,000, which is this
It is not difficult, our trend is bullish and expect a break of 1.618 soon
