Targets EURUSD (if you go or stay long)EURUSD = If the price breaks the resistance between 1.10 and 1.10230, may could expand to fibo ext levels 50% and 61.8%. This fibo levels match with confluence points (blue lines crosses in 1.1070 and 1.1120), causes a price block for reaching next levels. Also, matches with the top line of the ascending channel, being able to find a strong sell interest. But, if the price is rejected in 1.10 and 1.10230 zone, the downside movement to the bottom of channel will be start and fill the gap.
Confluence


Short GBPCAD key Fibo level and RSI confluencePrice has hit a key 423.6 resistant Fibo level which I believe will push lower to the horizontal resistance turn support at the level 1.75294. RSI is trending lower at a high overbought level and along with Stock trending down. Price may be pressured downwards to the key horizontal level. Confirmation on H4 shows downward pressure.

Bearish Cypher Bat (1hr) Butterfly (daily) CompletionsHere we have 3 patterns all completing relatively close together. I will be looking to take this short as soon as my entry rules are met. The patterns finish at a decent level of resistance if you look back on higher time frames. We also almost have an overbought signal on the daily rsi as well as bearish divergence on the smaller time frames. Trade safe everybody,


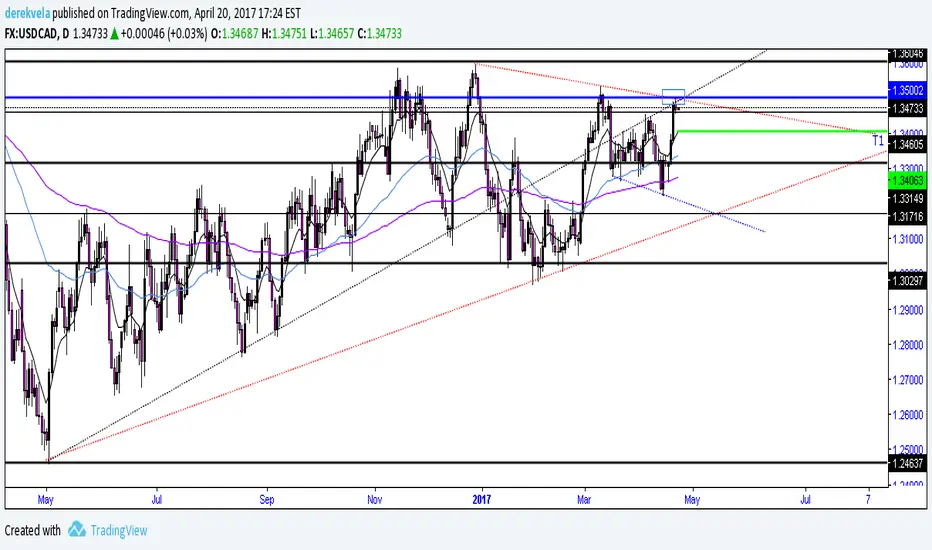
A lot of confluence with 1.3500 whole number levelMultiple trend line confluence with 1.3500 as strong resistance level. Could drop all the way down to 1.3171 area where we have an expanding triangle. We also have a bearish shark which I didnt draw on the chart with the 88.6 being in confluence with the 1.35
AUDUSD 2618 / Bearish Bat We have had a 2618 happen which was my initial reason for entry. this also tied with a possible completion of a abcd pattern at previous highs which gives us the 1.618 fib extension at a monthly key level.
When I was looking at the Daily time frame we have had our impulse leg down, 50% fib and also a strong 618 retracement from the recent push upwards. All of this again gives further confluence with the 886 level right at the previous daily highs and Key level


EURUSD Wait for retracement and SHORT CONFLUENCEGood confluence between a head and shoulders forming, a counter trendline test and a fib retracement.

LONG NZDJPYI see some JPY weakness coming into the market after USDJPY rejection off 100.
127% extension fade zone on the hourly, 4 hour, daily timeframes. Strong confluence that we see NZDJPY up towards 79.

looking at the DXY there could be some further downsideand there are several areas that could be good locations to go long-the-dollar again.
first area is around 99.31 at the neckline resistance, followed by 2 confluence areas - the first around 97.84 area, the second around the 96.45 area

Gold rejects Daily ResistanceLooks like a pretty good Opportunity to me. Confluence on the Daily & the 60min chart.
1234.29 will be my target, but as usual you're free to choose some major support down lower for your target.
Take Care
Maximilian


EURUSD Eyes Confluence of Resistance at 1.0800The EURUSD is about to close out another banner week. It would be the third in a row since the single currency found a bid at 1.0520. And thanks to a more dovish than expected Fed, the pair is trading at its highest level since February 6th.
But despite recent strength, the Euro has yet to make any real headway. The pair continues to trade in a range that has directed price action since December of last year, which brings us to the main (technical) event for next week.
The confluence of resistance in the 1.0800 region looks formidable. The trend line from the December 8th high comes in near 1.0790. And just above that is the 1.0825 handle, a level that dates all the way back to 1999.
The 1.0825 level is also the 38.2% Fibonacci retracement when measuring from the 2016 high at 1.1615 to the current 2017 low at 1.0340.
For these reasons, I’m not interested in buying the Euro while below 1.0825 on a daily closing basis. There is far too much resistance just above current prices to consider a long position.
For now, the jury is still out on whether the EURUSD has carved out a four-month inverse head and shoulders pattern. For that to become a probability rather than a possibility, I’ll need to see a daily close above the 1.0800/25 area.
Otherwise, any bearish price action from this area next week could set the stage for a short setup. Key support from current levels comes in at 1.0712 followed by 1.0635.

A Second Look At DNN: The Bullish Case (with short contingency)Hello, traders! A busy chart,but hopefully not too confusing. Yesterday, i posted a more or less bearish case against DNN. After taking a second look, i see bullish rsi and stoch. I see a fine example of an elliot wave 8 pattern with the final corrective wave c ending at the 1.618 of wave a. Also, you'll notice the fib retracement and extension together look like an excellent area for confluence and support. After a few days of consolidation, DNN could move upwards and make for nice cup and handle. Then again, only time will tell! do your homework!! Best, Matt

GBPNZD LONG Hey guys,
havent been around for a while and will not be as active as before but i thought to myself this would be a nice trade to share with you guys. Lot of fib confluences and a weak NZD lets us stand a greater chance that this pair will reach its pre-brexit low in a year. The orange lines are area's we might run in to problems at as well as the fibs. Entry will always be on a lower TF.
Trade with care and see you around,

Wolfe Wave USDCHF ShortShorting due to a Wolfe Wave from the green zone.
Confluence is the ABCD pattern and RSI divergence.

GBP/JPY - MAJOR CONFLUENCE for a Short PositionAs shown by my recent trade setup (Linked to this idea), price broke out of a wedge and is now retesting the lower trendline. There is a key area of resistance that price has not broken yet (shown by the blue box), key fib retracement levels can also be found in the same zone, the lower trendline also falls within this resistance zone and finally there is a double top. With all of these falling in the same zone, it provides a very strong opportunity for a short. Stop loss can be placed above the blue resistance zone but room should be allowed for price to move around this area. The first take profit area is a key area of support - furthermore, the profit target is at the same zone as the double top targets. The second profit target is at 1.2764 area (where the next support level can be found)

will biol blow up? the road to 2.14 good fundamentals. hoping for reversal, to 2.14-2.2. solid entry, try 1.94/1.2 is 1.61 so around there is perfect for the correction up. best!

AUDJPY - Looking interestingAJ Looks of interest i can see a drop into the confluence area, waiting for confirmation on lower tf for short entry.

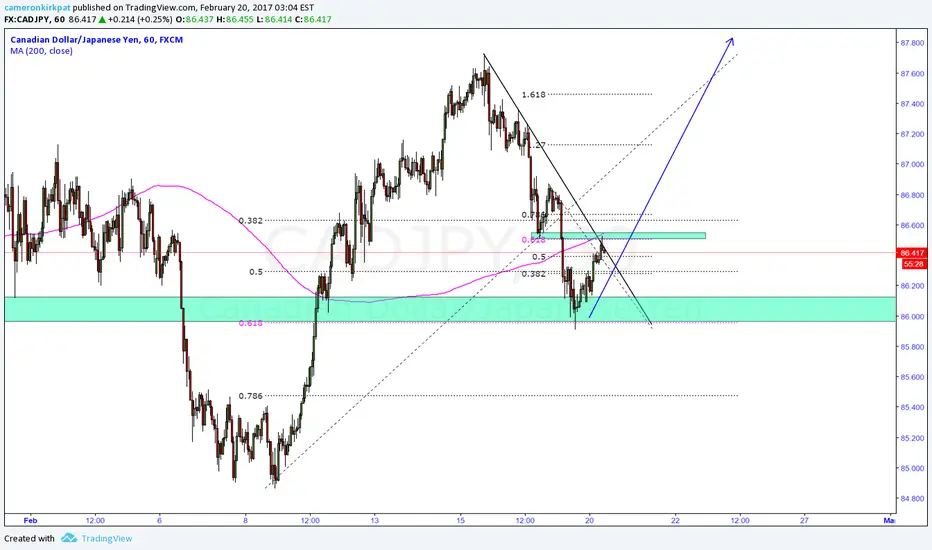
CADJPY Multiple confluencelarger time frame i see a long trade, lower time frame i see a short trade set up.... since higer time frames matter most i see CADJPY going to 87.5
USD/JPY Shark Bullish Setup 111.200USD/JPY
-potential long opportunity at the D leg completion of bullish Shark setup.
Stop loss would be 20-30 pips of D
Target 1 - 112.856
Target 2 - 113.651

AUDUSD confluence3rd upper trendline touch
previous resistance
hourly spinning top/doji
perfect ABCD harmonic completion (.618 to 1.27)
1H & M15 overbought stoch rsi
entry order @ .76945
SL @ swing high (C-D leg)
TP1 @ .618 retrace of C-D (possible three drive)
TP2 @ swing low (B-C leg)
TP3 @ lower trend line/swing low (AB leg)
