EURNZD SWING LONG - Capitalise on the strength of the EUROWith this pair currently at monthly support, there is a good opportunity to capitalize on the possibility of the pair rejecting this support. Also, the pair being at weekly support provides further confluence for the rejection of monthly support. If the market provides a daily close above daily resistance, then the re-test of that structure would present a good entry level for the swing
Confluencetrading

Trade with the Trend | Pullback SetupLooking for a pullback to create another LH on the lower ascending trendline of the parallel channel. Will be entering longs near the 0.618 fib retracement in confluence to a previous S&R area

Keeping it simple Head and shoulders pattern I believe this pattern will play out for the bears also head and shoulders pattern play really great in Risk reward as well as a high probable trade for binary options as well as spot trading opportunities: I also know there is a lot of confluence at the level of the left shoulder failing already as i type this. i will put my SL into TP . i have a bearish engulfing signal on the 15 min that you would see but on the hourly its a RED BE WHICH IS CANDLESTICK ANALYSIS ALSO PLAYING IN. Also the risk reward is about 4:1 which is something i really like. Were keeping it simple and we will see how this plays out in the hourly

BankNifty Solid Sell Activated! RedLine Broken Plus MoreOn 29th of June, i gave a trading idea which has been activated today! See Related Idea!
What's interesting is the confluence of Pitchfork Breakout and my redline? Isn't it?
Expect a large fall, whatsoever people tell you from here!!!
Trade at your own risk! For Educational Purposes Only!

Possible Retest & Long Position - GBPCHF - 7.68% R:R Hi All! Hope you're keeping well and having a great weekend! Just wanted to share a personal analysis I've made on GBPCHF! Please feel free to comment below any questions you may have!
With GBPCHF, I would personally like to see some movement to the downside towards the marked 4hr structure, to retest it as a support for price then to move back and follow the price trend to the upside. As you may not know, the Bank of England has a speech tomorrow which will greatly affect the pound - if the speech is 'hawkish' then we could see some strength for GBP which will support this long position.
You may notice that the fib retracement isn't on the highest wick, which is something I've personally done because I feel that maybe the last two candles on Friday could be very sketchy to work off, especially towards the market close. By doing this though it's lining up perfectly with the structure, and would be nice to get a long from that position. We're also above the 40EMA which I personally work with on minor pairs which will support this - also this could count towards a touch on the ascending trendline (subjective) which could also show support.
I have chosen to have my stoploss at 20pips + 3pips for spreads, and I will be risking 1% of my capital for this trade.
Confluences:
Trendline
Structure
40EMA
Fib Retracement
Conformation
"Pending" 😉
Obviously please do your own analysis, so please don't take this as gospel and please ensure that you use the correct risk management for this trade.
Let me know your guys thoughts!
Cheers
Daniel
Instagram: @DanielJamesFX
Twitter: @DanielJamesFX

EURJPY Swing LongWith the possibility of creating, at least, an equal high on the weekly time frame, this pair presents a good swing trade opportunity. On the daily time frame, the pair is on a re-test of an important structure level. If the pair rejects this support level, then there is a high probability of the pair rallying from support. Additionally, an inverted H&S is forming on the 4hr time frame of this pair, which serves as good confluence for a long on pair.
A more ballsy target would be the 127.2% fib extension of the weekly retracement.

Trendline Breakout & Retest SetupEURJPY currently finds itself trending within an ascending parallel channel after successfully breaking out of the descending trendline. We will be looking to enter longs on a pullback towards the 0.618 fib retracement, in confluence to our outlined parallel channel and the previous level of support.
GBPUSD Long Trade IdeaGoing long @Institutional Level 1.24200
Trade bias is based on confluence trading

Trendline Break & Retest | SELL LIMITAUDCHF broke out of the ascending trendline on lower time frames and is currently trending within a parallel descending channel. Looking to open shorts on a pullback towards the 0.5 inner fib retracement zone - which outlines perfectly with our broken trendline.
If we fail to see a rejection/bounce from the LL of the descending trendline, cancel order.

Selling on PullbackLooking to open short positions on a pullback towards the respectable descending trendline, 0.618 fib retracement level, and previous level of support which is now resistance.

Trendlines Retest | Short OpportunityCADJPY is rapidly making its way back up to retest the broken 4H ascending trendline, and potentially retest the current respectable descending trendline outlining perfectly with our 0.618 fib retracement level.

Trendline Retest | Short term setup -4H ascending trendline
-0.618 Fib retracement
-Previous resistance now acting as support
-strong zone of confluence
-Bullish sentiment on short term due to the huge oversell recently. Looking for a pullback to retest the current descending trendline

GBPUSD-Possible Strong Bullish Momentum?-There are two ways in which we could enter this pair on which is either to enter on reversal to the demand zone
-Or either we enter at the breakout of the 1.26133.
-Either way there is strong bullish momentum indicated by the break of the ascending channel.
-The 50 EMA is also showing the bullish signals for this pair.
-We will have to wait to see how price will react to these levels and look for strong bullish candle confirmation for entry.

H&S Short SetupAfter breaking out of the ascending trendline, we are now retesting it on the H&S pattern and previous resistance highlighted in green. Furthermore, the 0.618 fib level has also shown it's presence there providing us with a solid zone of confluence to potentially open a short position from.

Sell on PullbackAfter breaking below the ascending trendline, we will now be looking to retest it on a pullback towards the 0.5 Fib level in correspondence to the previous resistance zone.

USDCHF Looking for a PullbackAfter the long consolidation period within the symmetrical triangle, USDCHF finally decided to break below and we will be looking to retest the ascending trendline. Looking for a pullback on the 0.618 Fib level in correspondence to the previous support now acting as resistance. The three TA elements outlined together create this zone of confluence in which we could consider opening a short swing trading position.
This is NOT a financial advice, trade at your own risk!

Golden Pocket SetupThis is a follow up trade from my last USDJPY setup:
-Bullish trend within a wedge. Looking to retest lower ascending trendline for a long position.
-1H trendline break, looking for a pullback to retest the trendline.
-Golden pocket with our 0.618 retracement level on lower time frames.
-Respectable support area outlined in grey, hence why the SL is higher than usual


EURNZD- Possible Bullish Reversal at 23.6 Fib Level!- Price has broken the descending channel and we could potentially see a reversal of the resistance which is in confluence with my demand zone.
-Another confluence is that the 23.6 fib level lines up perfectly with the demand zone which could indicate that price will most likely reach the level and the bulls will be in control of the pair.
-The 50 EMA is above price which suggests bullish momentum.
-Very good opportunity to buy this pair but have to be patient on how price will react when it gets to the zone.

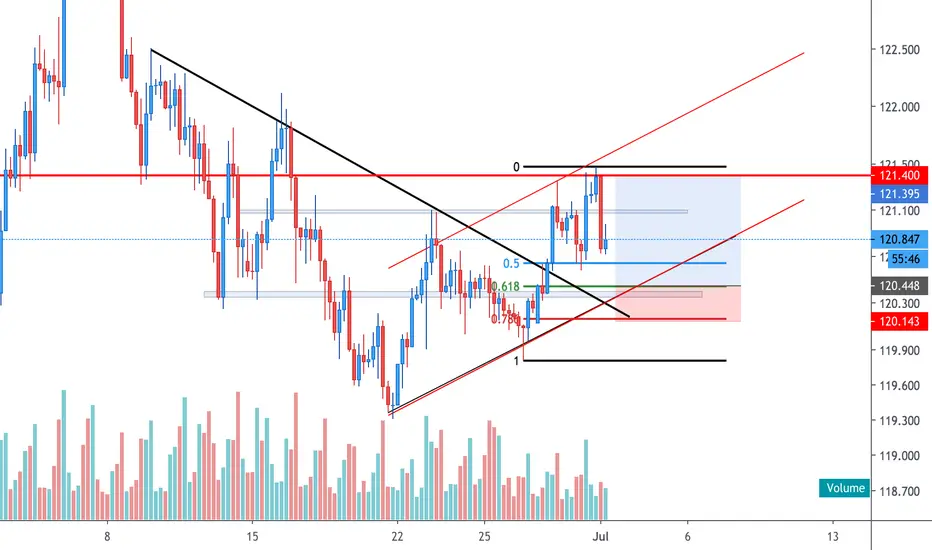
Pullback Expected | Long SetupAfter successfully breaking out of our descending trendline, we will now be looking to potentially retest it. Currently, the market is trending within a respectable parallel channel. A zone of confluence is created when the previous broken trendline and the current ascending trendline, meet each other. Furthermore, we have a clear 0.618 Fib retracement - lying right in between the two trendlines creating this "golden pocket", where we could consider opening a long position.

Looking for Retracement Expecting a pullback down to retest our ascending trendline on EURJPY, which is also in confluence with our 0.618 Fib level, and also the previous crucial support area. Furthermore, we expect to retest the breakout of the previous descending trendline.

[NZDUSD] Trendline Retest SetupWe managed to see a clean break of the ascending trendline looking back at the 4H time frames. Currently we are in a retracement phase, where there is a potential to retest the trendline, as well as the 0.618 Fib level, and see further downside formed from here. Furthermore, our 0.618 level corresponds perfectly with our previous supports (now acting as resistance), forming up this zone of confluence to potentially look to enter the market!

Short DOWTaking short on DOW as SPX500 failed on highs as well. Entering at 24358, stops above 24405, targeting 24060.
Risk: 50
Reward: 350
R:R 1:7
