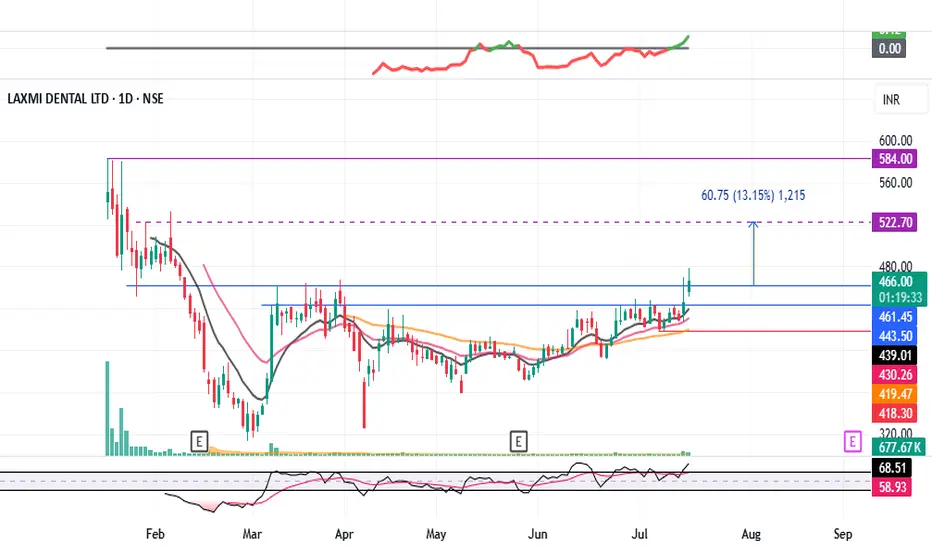
LAXMIDENTL : Consolidation Breakout#LAXMIDENTL #breakout #breakouttrading #ipostock
LAXMIDENTL : Swing Trade
>> Consolidation Breakout
>> Volumes Building up
>> Stock in Momentum
>> Good Strength in stock
>> Trending setup
Swing Traders can lock profit at 10% and keep trailing
Pls Boost, Comment & Follow for more analysis
Disc : Charts shared are for Learning purpose not a Trade Recommendation, Take postions only after consulting your Financial Advisor or a SEBI Registered Advisor.
Consolidation-breakout
Hero MotoCorp — Daily Chart Breakout Trade SetupHero MotoCorp — Daily Chart Breakout Trade Setup
Range Bound: The stock has been consolidating between ₹4,170–₹4,400 for the past several weeks.
Structure: This is a classic rectangle consolidation, often a continuation pattern.
Volume: Watch for volume expansion on the breakout; prior breakouts lacked follow-through due to low volumes.
Higher Timeframe (Weekly/Monthly) charts show a bullish continuation since mid-May, with high-volume candles across weekly and monthly charts
Key resistance zones: Weekly resistance lies between ₹4,930–₹5,000.
Strong fundamental macro tailwinds: March sales show robust performance in both domestic ICE and EV segments (Vida)
🔍 Key Confirmation Signals for a Potential Trade
✅ Strong daily candle close above ₹4,420
✅ Above-average volume on breakout
✅ RSI crossing 60 on breakout adds momentum confirmation
⚠️ Risk Management Notes
Avoid early entry within the range (false breakouts possible)
Wait for EOD close above resistance for confirmation
Consider a trailing SL once the stock crosses ₹4,500

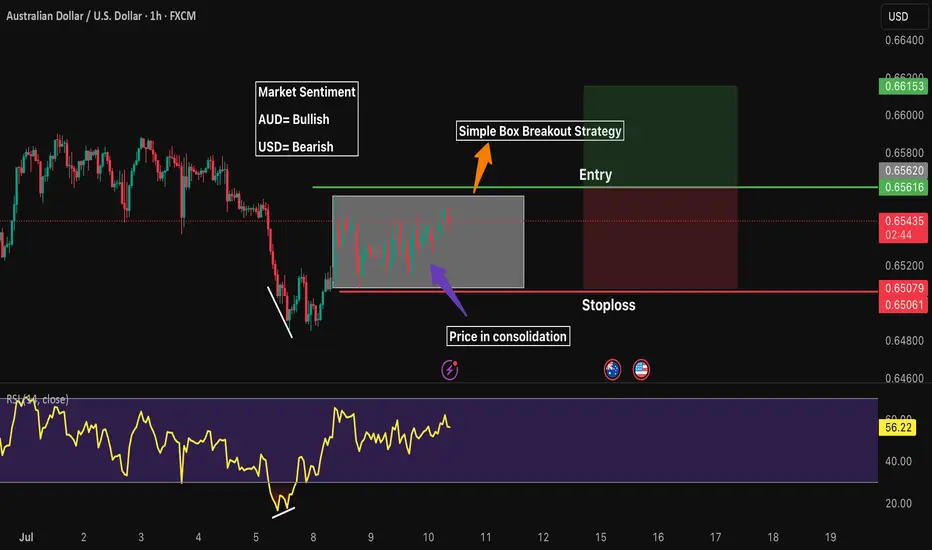
AUDUSD 1H LongMarket Sentiment
AUD= Bullish
USD= Bearish
Waiting for price to breakout from its consolidation box
RR 1:1
EUR/USD breakout awaiting EUR/USD has not provided a clear structure over the past week or two. The pair appears to be in consolidation, building liquidity on both sides of the current range. At the moment, I’m waiting for a decisive breakout, ideally followed by distribution within the monthly supply zone, although that zone is still some distance away.
This week, my focus will be on whether a new supply zone forms, closer to current price. If price sweeps the nearby equal highs and then shows signs of reversal, this could give us a fresh supply area to work from. Alternatively, if price moves lower, I’ll be looking at the 8-hour demand zone around 1.16000 for a possible long setup.
Confluences for EUR/USD:
- Although price has been slightly bullish, the current consolidation phase suggests a potential reversal could be on the horizon.
- Liquidity is building on both sides of the range, making a reaction from the monthly supply zone increasingly probable.
- There’s significant downside liquidity still untapped, such as Asia session lows, which could serve as short-term targets.
- For clearer confirmation, we still need a decisive break in market structure to the downside.
P.S. If price sweeps the lower liquidity and moves into the 8-hour demand zone near 1.16000, I will be watching for accumulation to form and signs of bullish intent from there.

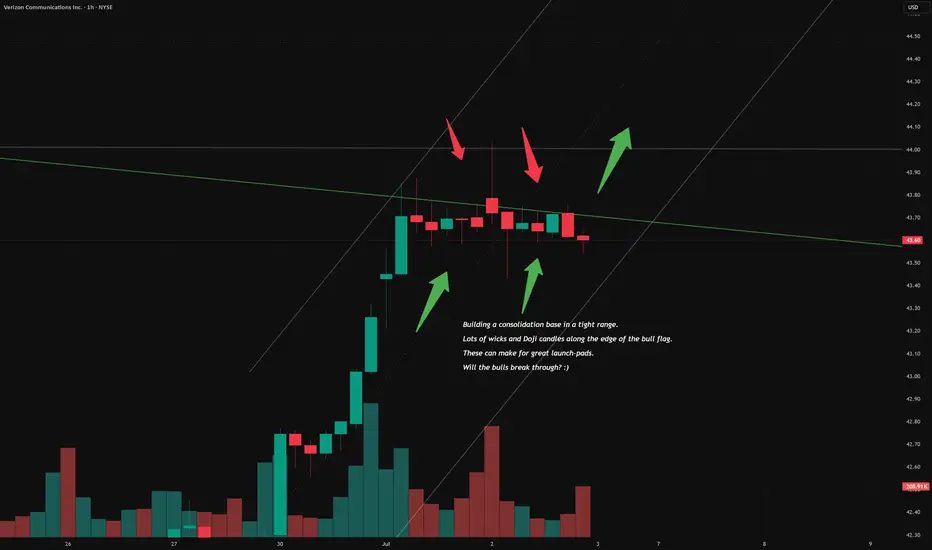
The battle has begun for VZ glory.Just taking a look at the hourly chart and it looks like the bulls broke through resistance, but the bears were able to push them back, for now at least. Every time the bears push the price down, the bulls push it right back up to the edge.
This is bullish IMO. It gives bears less liquidity to slow down the move upwards when the range is so tight. It will be interesting to see how things unfold.
Watch for high volume at the end of the session.
"The clock is ticking bears. Join us! JOIN THE LIGHT! DO IT FOR GLORY!" 🤣
HAL: fake breakdown and a possible bullish move.Stock: Hindustan Aeronautics Ltd NSE:HAL
• Timeframe: 1-day candles (each candle represents one day of trading)
1. Consolidation Zone: A grey rectangular box highlights an area of "consolidation" starting from around May 14th. This means the stock price has been trading sideways within a relatively narrow range, not showing a clear uptrend or downtrend.
2. Fake Breakdown: An arrow points to a price dip below the lower boundary of the consolidation zone. The annotation calls this a "fake breakdown." This implies that the price temporarily moved below the support level, but then quickly bounced back up.
3. Potential Trade Setup: The chart suggests a potential long (buy) trade based on the fake breakdown and the subsequent recovery.
• Entry Point: Around 4,897.55 (labeled "ENTRY" on the chart) which is the price at which the stock could be bought.
• Stop Loss: Around 4,733.75 (likely intended to be the "4733.60")
This is the level below which the trader would exit the position to limit potential losses if the price moves against them.
• Targets: The chart identifies three potential profit targets:
* Target 1: 5,087.85
* Target 2: 5,305.15
* Target 3: 5,497.80

EUR/JPY Analysis – Flag Breakout Signals Further UpsideHello Traders,
It's been a while. I trust you are good.
Kindly find below my analysis of EURJPY currency pair.
Overview:
EUR/JPY has been consolidating within a bullish flag pattern, characterized by lower highs and lower lows over the past few trading sessions. Price action has now broken above the flag’s resistance, indicating a possible continuation of the broader bullish trend.
Idea:
The breakout above the bullish flag suggests that bulls are regaining control. Price is currently hovering around 169.370, having just cleared the wedge’s resistance line.
Key levels to monitor:
1. Support Zone: Around 169.200–169.300
2. Resistance Level: 169.699
Trade setup:
Entry: On a successful breakout or break and retest of 169.200–169.300.
Stop Loss: Below 168.816 (beneath the flag's support and recent swing low).
Targets: TP1: 169.699, TP2: 170.000–170.200
Conclusion:
EUR/JPY has broken out of a bullish flag pattern, signaling momentum shift in favor of buyers. If price sustains above the breakout zone or clears 169.699 resistance, we may see an extended rally toward the 170.000 mark. Trade with caution.
Cheers and happy trading.

Long ConsolidationBNWM Analysis
Closed at 63.48 (18-06-2025)
Long Consolidation of 9 - 10 years almost.
Now either wait for Breakout above 69; or
Wait for a Good Support around 35 - 43.
Once 69 is Crossed & Sustained with Good
Volumes, we may witness 100+

this was depend on consolidation area which people are confuse this idea for only education purpose take action on your own risk and that this was going in uptrend this idea on price action study of candle sticks after one hour uptrand was going to starts be ready for your own risk

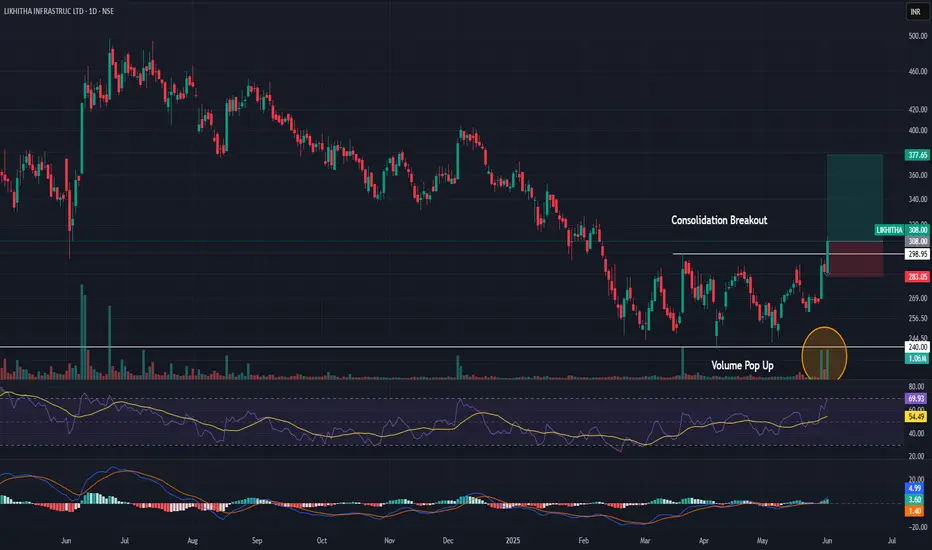
Momentum Trade in Likhitha Infra1. Positive Divergence on RSI
2. Good Volume
3. Consolidation Breakout
4. RSI near 70
5. MACD signal turning green
Conslidation Box
Closed at 9.14 (23-05-2025)
Trying to break the long consolidation box.
Important Support Zone is around 8 - 8.70
Channel bottom is around 5.30 which seems
unlikely as of now because of Bullish Divergence
on weekly tf.
Upside targets can be around 11 & then around 14

NEAR’s Pullback Zone Found — Is $4 Next?NEAR just pulled off a +50% rally from the 0.618 Fibonacci retracement at $2.224 — a strong show of force from the bulls. After that explosive move, price is now cooling off in a consolidation phase, preparing for the next leg higher.
🟢 Long Setup — Dip Before Lift?
The next high-probability long zone lies between:
$3.026 – $2.94
Possible but less likely of a deeper dip to $2.78 (0.5 Fib of the recent move)
Long entries can be laddered between $3.00 and $2.90 (even $2.80 if volatility kicks in).
Stop-Loss: Below the daily 21 EMA ($2.7344) and 21 SMA ($2.6739)
Target: $4.00
R:R: ~4:1 — clean and structured
This setup aligns with standard continuation behaviour after strong impulses — consolidation, retrace, and resume.
🔴 Short Setup (on Rejection at $4.00)
Entry: ~$4.00
Stop-Loss: Above $4.25
Target: Yearly open (~$3.65)
R:R: ~1.5:1 — not ideal, but valid on confirmation
🎯 Summary
NEAR is consolidating after a strong move — either ready to continue higher or retest deeper into Fib support
Long zone: $3.00–$2.90 (poss. $2.80)
Short zone: $4.00 (on rejection only)
Simple structure, clean risk, and nothing forced — exactly how it should be.
Sometimes, less is more. Let price show the next move. Stay ready. 📈
___________________________________
If you found this helpful, leave a like and comment below! Got requests for the next technical analysis? Let me know.

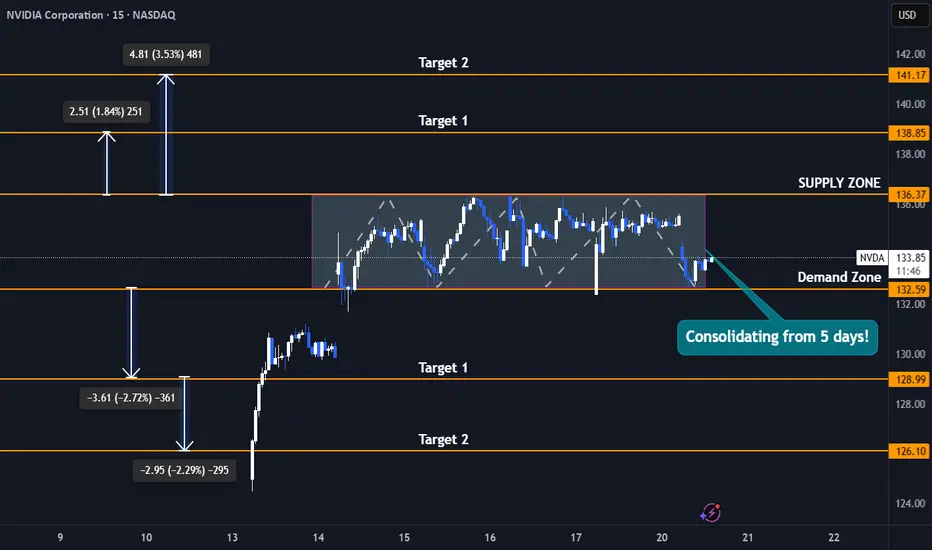
Nvidia Stock 5-Day Consolidation Breakout - Uptrend or Pullback?Trade Duration: Intraday
Trade Type: Breakout
- Nvidia is currently consolidating tightly between $132 and $136, forming a narrow range that reflects a balance between buyers and sellers unwilling to relinquish control. This range-bound action signals indecision, but it won’t last indefinitely.
- Typically, the longer the consolidation, the more significant the subsequent move. As new participants enter the market, a breakout—whether upward or downward—can trigger a powerful surge.
- This move is often amplified by breakout buyers joining in and stop-loss orders of trapped traders being triggered, creating an ideal setup for an intraday breakout trade.
- I plan to initiate either a buy or sell position depending on the breakout direction, capitalizing on the momentum generated by this tight consolidation phase.
Upside Targets : 138$ and 141$
Downside Targets : 128$ and 126$
Monthly Closing above 7.50 - 7.60 will be very healthy!
Monthly Closing above 7.50 - 7.60
would be a very healthy sign.
We may then easily witness upside
towards 8.70 - 9.10 & then 10.50 - 11
Remember it is in a long consolidation
with Slowly moving in an Upward Channel.

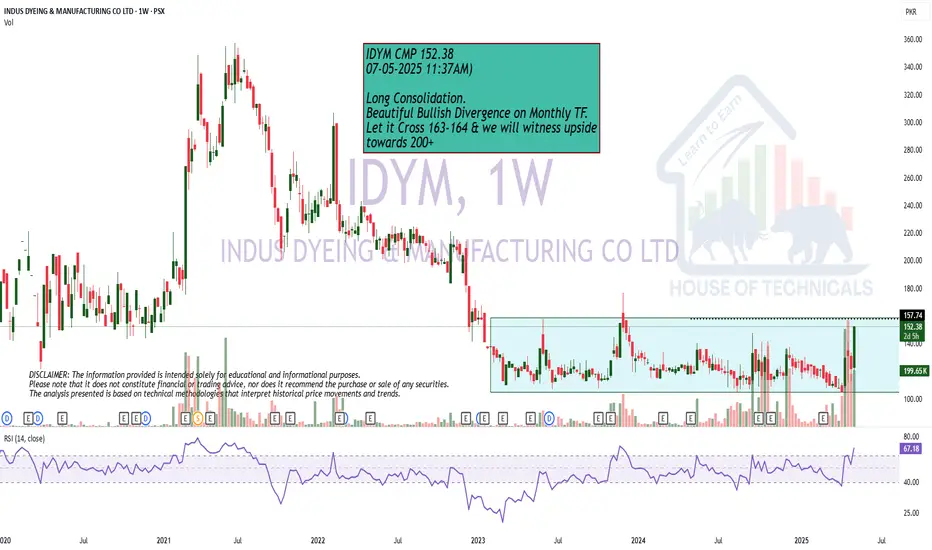
Near BreakoutLong Consolidation.
Beautiful Bullish Divergence on Monthly TF.
Let it Cross 163-164 & we will witness upside
towards 200+
EURUSD - Analysis and Potential Setups (Intraday- 22.04.25)Overall Trend & Context:
This pair is in an overall uptrend and has broken above last weeks highs.
Technical Findings:
Price is trading above 25, 50,100 and 200 EMA's on the daily and 4H charts.
Overall Bullish price action is evident.
Price has been consolidating through London session thus far, we can expect a tap into the demand below the liquidity (relative equal lows) before continuation of bullish cycles.
Notes:
Price is currently at a weekly supply level, we may bounce in and out of it a few times, so manage your risk and take this setup based on your own analysis as well.

Breakout Retest Possible?431 - 433 is a Good Support level as of now.
However, Extreme Pressure may bring the price towards
420 - 429 which is also the breakout re-test level.

GBPNZD - TECHNICALS & FUNDAMENTALS📊 Technical Analysis – GBPNZD
🔻 Market Context:
Current Price: ~2.2838
The pair has been in a downtrend, forming lower highs and lower lows.
Price recently revisited a previous support zone, indicated by the horizontal line and purple box, showing potential for either a reversal or a continuation.
🔍 Key Zones:
Support Zone: Around 2.2830 – 2.2800
Price is testing this area and has shown a few wicks indicating buyers are present.
Demand Reaction Needed: A bullish candle formation is crucial at this level to signal potential upside.
🔼 Bullish Scenario (Reversal Play):
If a strong bullish candle forms around current levels, it could lead to a push higher toward 2.3000 and potentially 2.3100.
Watch for a break of short-term lower highs with volume confirmation.
🔽 Bearish Scenario (Breakdown Play):
Failure to hold above the current support level (2.2830–2.2800) may result in a deeper drop, targeting the 2.2700–2.2650 area.
The Bear Bias zone (marked on the chart) suggests sellers are active and may continue to push lower if structure breaks.
🧠 Fundamental Probabilities – April 8, 2025
🇬🇧 UK Outlook (GBP):
No major economic data is scheduled today for the UK, but markets remain cautious due to:
Ongoing uncertainty around the BoE’s interest rate stance.
Sticky inflation and mixed signals from recent PMI data.
Pound strength has been mostly reactive to broader risk sentiment and interest rate expectations.
🇳🇿 NZ Outlook (NZD):
Key driver today: NZ Business Confidence & Dairy Auction
If business sentiment remains weak and dairy prices disappoint, NZD could come under pressure.
RBNZ's dovish bias is also lingering in the background; the central bank is expected to maintain or potentially cut rates if economic softness continues.
✅ Summary:
Bias Condition Target
🔼 Bullish Bullish candle at support 2.3000 / 2.3100
🔽 Bearish Break below 2.2800 2.2700 / 2.2650

Kotak Mahindra Bank Consolidation Rectangle Breakout.Kotak Mahindra Bank is Consolidating since 2021 in a Rectangle Pattern.
Breakout of the level 2050 with the Volume increase.
CMP 2079
It should Retest 2050 again and then rally towards atleast 2500
Lets! Hope for the Best!

XAUUSD Head And Shoulder pattern breakdownGold update 15m head and shoulder breakdown
Key Levels:
Resistance Levels:
3,040.000 (Immediate Resistance)
3,050.000
3,060.000
3,070.000 (Major Resistance)
Support Levels:
3,022.000 (Immediate Support)
3,014.000
3,006.500
2,999.000
2,991.000 (Major Support)
Price Action Overview:
Gold is currently trading at 3,033.785, showing a slight upward movement of +1.685 (+0.096%).
The price has been consolidating between 3,031.425 (Low) and 3,034.430 (High) in the last 15-minute candle. The market is testing the 3,035.410 level, which could act as a minor resistance.
Technical Indicators:
USB (Ultimate Support/Resistance Band):
Current Value: 38.301 (-1.279)
Indicates potential support/resistance zones around 3,830.4.
TAT & Skullers Indicator:
Current Value: -38.306 (-1.269)
Suggests a potential retest or breakdown level around 3,830.6.
Market Sentiment:
The market is showing slight bullish momentum, but the price remains within a tight range.
A breakout above 3,040.000 could signal a stronger bullish trend, while a breakdown below 3,022.000 may indicate bearish pressure.
Trading Strategy:
Bullish Scenario:
Entry: Consider a long position if the price breaks and sustains above 3,040.000.
Targets:
3,050.000 (First Target)
3,060.000 (Second Target)
3,070.000 (Major Resistance)
Stop Loss: Place below 3,022.000 to manage risk.
Bearish Scenario:
Entry: Consider a short position if the price breaks and sustains below 3,022.000.
Targets:
3,014.000 (First Target)
3,006.500 (Second Target)
2,999.000 (Major Support)
Stop Loss: Place above 3,035.410 to manage risk.
Risk Management:
Always use proper risk management techniques.
Risk no more than 1-2% of your trading capital per trade.
Adjust position sizes according to your risk tolerance and account size.

Mobius (MOT) is in more than 200 days consolidationHi Traders,
Mobius (MOT) is in more than 200 days consolidation.
Buy Price - 0.0005
Sell Price - 0.015
Profit - 3,000%
Happy Trading!

GBPUSD - LONGStrong cumulative flat. Buying opportunity after the formation of the Cypher pattern.
GBPUSD - LONG
ENTRY PRICE - 1.2912
SL - 1.28500
TP - 1.30780
Always follow the 6 Golden Rules of Money Management:
1. Protect your gains and never enter into a position without setting a stop loss.
2. Always trade with a Risk-Reward Ratio of 1 to 1.5 or better.
3. Never over-leverage your account.
4. Accept your losses, move on to the next trade and trust the software.
5. Make realistic goals that can be achieved within reason.
6. Always trade with money you can afford to lose.
Please leave your comment and support me with like if you agree with my idea. If you have a different view, please also share with me your idea in the comments.
Have a nice day!

DOTUSDTRange Breakout: The pair has been trading within a range, and the breakout from this range signals potential bullish momentum. A breakout indicates that the price is ready to move out of its consolidation phase, with buyers now in control.
Trendline Breakout: The price breaking above a key trendline further confirms a shift from a bearish or neutral market sentiment to a more bullish one. This is a strong signal that upward momentum is building.
