HLI to continue higher?* Exceptional earnings year over year
* Very strong up trend since inception
* Broke out of a month long consolidation with 72.99% more volume than average
* Under very tight accumulation for the past 5 weeks
* Pays out dividends with a Payout ratio of 26.70%. This means the company has a lot more room to grow and possibly increase dividends as well.
Trade Idea:
* Now is the perfect time to enter as it's still close to the broken level and is picking up momentum with volume.
* If you are looking for a small discount, this may come down to retest the $88.90 area before heading higher.
Consolidation-breakout

SYK breaking out once again with higher volume!* Exceptional earnings year over year
* Very strong up trend
* Breaking out of a 4 month consolidation period with 63.09% more volume than average
* Pays out dividends with a Payout ratio of 44.50% which means that the company has a lot of room to grow further and possibly increase dividends as well!
* Probable ROI is 12.98% if the trade goes in our favor
Trade Idea:
* This is a great time to get in as it's breaking out for the second time after using the $268 area as support that made a higher low!

AMRC to go higher?* Great earnings year over year
* Very strong up trend
* Breaking out of a year-to-date consolidation with 40.98% more volume than average
* This trade as a chance of giving an ROI of 86.26% if it plays out in our favor.
Trade Idea:
* Now is the best time to jump into this as it's very close to the breakout point and it's picking up volume as well.

TXN breakoutTXN is setting up nicely. Ascending triangle, bullish pin bar candle on the daily. Looking for a move to $191+ next week. Will look for opportunity to enter 9/17 $190 calls tomorrow. 50 MA is acting as resistance but should be able to push through.

TTEK building a base over base pattern!* Strong earnings quarter over quarter
* Strong up trend
* Broke out of a year-to-date consolidation
* Consolidating right above the broken level
Trade Idea
* Now would be a great time to get in on this given that it has broke out and is now creating a new support right above the broken level.
* However, if you are looking for a discount, this may consolidate a bit more before moving higher so you may look to enter around 142.80 and 144.70 area
Note
* This is a great long term hold given it's established growth
* and it pays out dividends with a Payout ratio of 19.70% so the company has a lot more room to grow and possibly increase dividends in the future

TREX attracting more volume* Very strong earnings year over year
* Very strong up trend
* Broke out of a 6 month consolidation
* Consolidating right above broken level and attracting more volume
Trade Idea:
* Now would be a great time to get in as it's building a new base right above the broken level.
* If you are looking for a discount, there is a slight chance of it visiting the $109 region before moving higher

INFO consolidating above broken resistance!* Excellent earnings year over year
* Strong up trend
* Broke out of a month long consolidation
* Consolidating right above broken level with higher than average volume
* Minimum probable ROI of 6.03% if the trade goes in our favor
* Given the established up trend it will most likely be more than that
Trade Idea:
* Now is the perfect time to get in and ride the next leg higher
* However, if you are looking for a discount, the price may visit the $119 area once more before heading higher!
Note:
* This is a long term hold given its growth
* And it pays out dividends with a Payout ratio of 45.40% which means the company has a lot of room for growth and possibly increasing dividends in the future!

NFLX setting new support levels?* Relatively strong earnings quarter over quarter
* Strong up trend
* Broke out of a 14 month consolidation with higher than average volume
* Creating a new base above broken level of $593.29
* Minimum probable ROI of 28.03% if the trade goes in our favor
Trade Idea:
* Now would be a great time to get in on NFLX as it's creating a new base right above the broken level.
* $593.29 is expected to hold as support
* A break below that would make $575.37 a nice entry if you're looking for a discount.
* Worst case scenario we could see a low of $558.30 which would be the last level of support before further downside.

ABT finally broke out!I last spoke about ABT when it was peaking at a breakout. Now, with slightly higher than average volume, it finally broke out.
Now is the time to get in
Here's a recap of what I last mentioned
* Strong up trend
* Consolidating since beginning of 2021
* Strong earnings
* Lower than average volume
All signs point to it breaking out soon. Due to the lack in volume ABT may visit the $126 area before breaking out.
Trade idea:
* Wait for a break before entering
Target after breakout would be $151.65
Looking at its growth, ABT is a great long term hold that pays out dividends!

CTAS Broke out of month long consolidation* Strong earnings quarter over quarter
* Very strong up trend on the longer time frames
* Broke out with higher than average volume
Great momentum stock to get in. The price is ready to move higher!

TSCO broke out with volume!!* Strong earnings quarter over quarter
* Strong up trend
* Pays out dividends with a Payout ratio of 24.30% which means the company has a lot more room for growth
* Broke of a 4 month consolidation out with higher than average volume (19.09%)
* Making a new all-time-high
* Probable ROI of 17.19% if the trade plays out in our favor
Trade idea:
* $200.75 is expected to hold as support due to high volume breakout
* This may come back to retest $200.75 area so if you're looking for a discount that may be a great entry point
* Or you can buy in now and ride the trend if you can stomach a slight move down
A probable ROI of 17.19% would place the target at 240.03 area
Note:
* This is also a great long term hold as it pays out dividends

BNL broke out of consolidationBNL had a pull back mid June and has since recovered to make new all time highs.
Since breaking out it has been consolidating right above resistance hence making it a new support level.
* New company
* Steady up trend
* Pays generous dividends
* Broke above pull back with relatively higher volume (7.28%)
* Creating new support level from the broken resistance
* Price is at a great point!
Trade Idea:
* Entry at previous close $27.63
* Stop at $26.20 (~5%)
* Target at $33.17 (~20% ROI)

TSM to breakout from consolidation soon?TSM have been consolidating in the rectangle since March with several attempts to break the $125 resistance. But with US market looks very likely for correction will TSM finally be able to break the $125 resistance? Let's find out soon

PPD to continue higher* Relatively young
* Steady up trend
* Strong earnings
* Breaking out of a 4 month consolidation
* Breaking out with higher than average volume
Trade Idea:
* This is a great time to buy PPD as it's still close to the broken resistance and its 10EMA

REXR to continue higher!* Strong earnings quarter over quarter
* Strong up trend since inception
* Consolidated for a month after a move higher
* Retested the broken level as support with higher volume than average
Trade Idea:
* This would be a great time to enter a trade
* Or if you're looking for a discount, you can look for buying opportunities around the $61.70 area

SBNY breaking out* Relatively stable earnings
* Strong up trend since November 2020
* Breaking out of a 5 month consolidation
* Breaking out with higher than average volume
Trade idea:
* $260.37 should hold as support so you can look for buying opportunities there
* Or if you're not looking for a discount, you can jump in now and ride the next leg higher.
Be sure to place some distance between you stop due to market volatility these days.

SUNPHARMA price action analysisNSE:SUNPHARMA is in a ttm squeeze with increasing momentum which indicates that it could give big move up anytime soon.
Besides that, below are the additional confirmations that makes it bullish for short term.
1) All the EMAs are stacked up
2) It bounced off of 21 EMA and now it's consolidating at the resistance level which it created a month ago.

ZTS to head higher * Very strong earnings quarter over quarter
* Very strong up trend
* Broke out of a roughly 1 month consolidation with close to average volume
Note: This is a solid growth stock to trade short term but also hold for the long term.


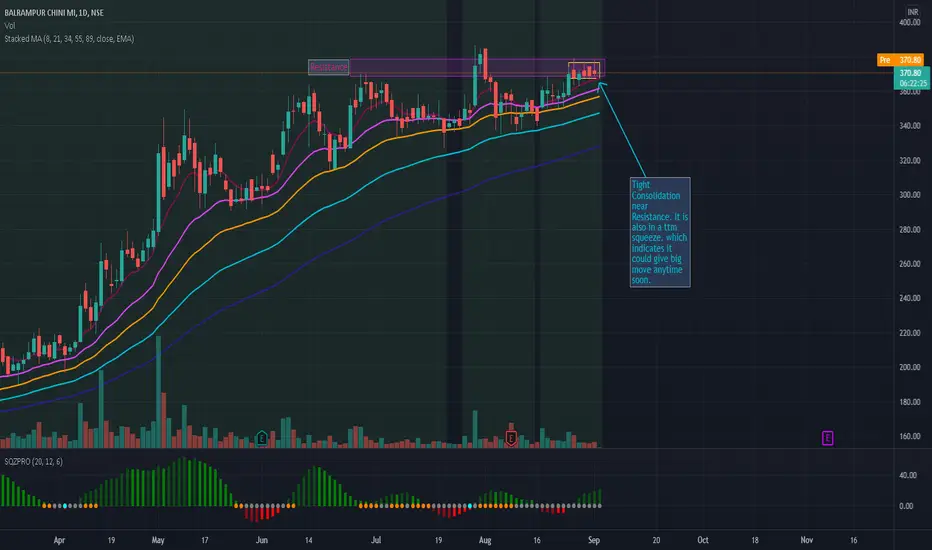
BALRAMCHIN - potential breakout playNSE:BALRAMCHIN is in a tight Consolidation near resistance. It is also in a ttm squeeze with increasing momentum which indicates that it could give big move up anytime soon. If it breaks out then we could see it go 400-420.
SHOP sideways about to breakoutSHOP has been consolidating after a daily triangle breakout
Nice sideways action preparing for another leg to the upside.
I will be watching price at $1558
Great potential for a runup

CHILIZ (CHZ) has been consolidating for the past ~100 daysCHZ has been consolidating for the past 100 days or so. Last time this happened was in back in December 2020. We have a low volume, same thing as in dec 2020.
On the weekly timeframe, the MACD just turned bullish! Let wait and see.
I'm expecting a bullish move soon.

ADA continued breakoutWith buying pressure increasing, ADA has completed a full standard deviation on the way to 5$
