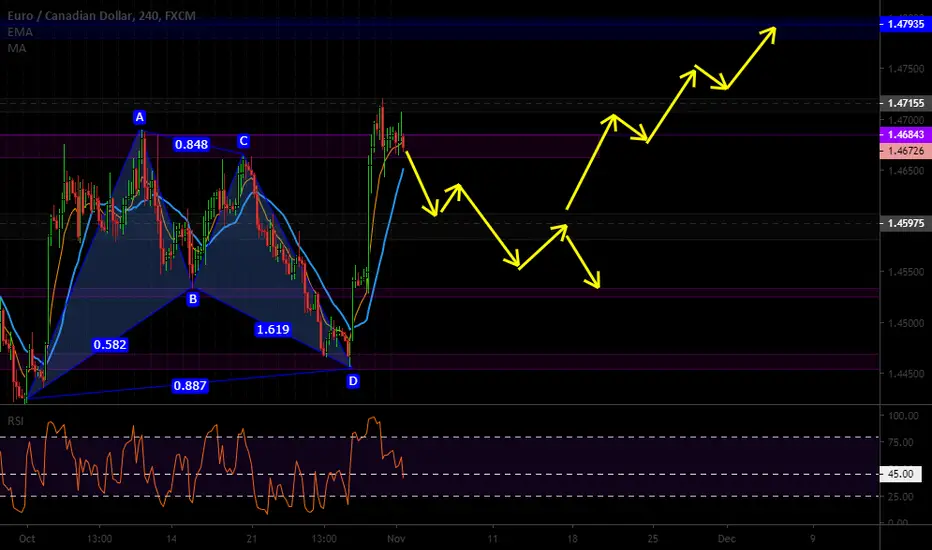
Possible Bullish ContinuationWe are currently in a big range according to the weekly.
But thanks to the big boost from news week, we could possibly bust out this week -- as long as we stay bullish.
Since we had a big impulse move Friday, we should have some pullback before continuing up.
With price beginning at consolidation, we should prepare for a big impulse move again this week too.
BULL TPS:
Beginning at 1.45975
• 1.46321
• 1.46612
• 1.47072
• 1.47476
• 1.47935
BEAR TPS:
Beginning at the current position
• 1.46321
• 1.45975
• 1.45608
• 1.45251
Consolidation-breakout
EURJPY - High & Tight Flag Potential Breakout PatternOne of the main trading ideas of my radar for the week ahead comes on the EURJPY. Following an impulsive bullish move to start October, we've seen the market create a sideways consolidation pattern. This is a combination that forms what's called a "High & Tight" flag formation and it's one of the most powerful breakout patterns in the market. For me personally the only thing stopping this from being a grade a setup is the fact that if you look left on a higher timeframe you'll notice that we are currently trading AT previous structure resistance where a VIOLATION of would have been ideal. Nonetheless, this is still a good setup in my opinion.
In the YouTube video walking you through this idea (Preparing To Trade Breakouts) I share with you 3 ways to attack a breakout pattern, but for the purposes of me simply writing less let's concentrate on entring at the bottom of the channel.
On the last test of the channel lows price created a double bottom pattern which essentially means it tested the level twice and held twice before breaking higher. If price were to retest that level once again we'd have something that I like to call a 2618 setup which would provide another reason to get long at the lows.
PROS - The benefit of entering at this level as you can probably see is the quality of risk to reward. Not only can you take a conservative initial target at still maintain a close to 2:1 ratio but if you're playing for the breakout as well (or with a partial position) then the opportunity is that much better given the very low risk.
CONS - At this point, we have no confirmation that the breakout will happen so it's slightly more risky in comparison to a trader who takes the approach of waiting for a confirmed breakout.
I hope you guys enjoyed this trading idea and as always I'd appreciate it if you hit that "like" button as well as share any opinions or analysis that you may have relating to this pair or setup.
Have a GREAT WEEKEND
Your Trading Coach - Akil

Gold, consolidation is ending.The gold is in strong consolidation zone for the past 2 months. Now if it is a breakout from triangle, it is possible to start a strong upward movement and continue the trend. It is also possible to see that strong resistance is broken.

In Consolidation Awaiting BreakoutGold is just chilling in a consolidating range right now awaiting the next big breakout.
We've been enjoying a nice, but jittery downtrend since September.
But with a wedge showing it's nearly filled on both a smaller and larger scale, we can enjoy a nice move on either end.
Ler's wait and see.
For now, here are the TPs I marked up for this trade:
BULL TPS:
1503.63
1515.56
1527.05
1537.30
BEAR TPS:
1503.63
1489.61
1480.94
1474.91
1460.33

LONG - NULS - Trading OpportunityBeautiful consolidation on a key support, we have been resting above it for the past couple of months and now is looking ready for a leg up.
Entry: 0.00004266
TP 1: 0.00004705
TP 2: 0.00005219
TP 3: 0.00005806
SL: 0.00004106
CryptoCue is not providing investment advice and is not taking subscribers’ personal circumstances into consideration when discussing investments. Investment involves a high degree of risk and should be considered only by persons who can afford to sustain a loss of their entire position.
CryptoCue is not registered, licensed or authorized to provide investment advice and is simply providing an opinion, which is given without any liability or reliance 1.71% whatsoever. The information contained here is not an offer or solicitation or recommendation or advice to buy, hold, or sell any security. CryptoCue makes no representation as to the completeness, accuracy or timeliness of the material provided and all information and opinions provided by CryptoCue are subject to change without notice and provided on a non-reliance basis and without acceptance of any liability or responsibility whatsoever or howsoever arising. You hereby irrevocably and unconditionally waive, release and discharge: (a) any and all accrued rights and/or benefits you may have against CryptoCue in respect of any opinion expressed or information conveyed by CryptoCue at any time; (b) any and all Claims you may have against CryptoCue arising out of any opinion expressed or information conveyed by CryptoCue at any time; (c) CryptoCue from all and any claims (whether actual or contingent and whether as an employee, office holder or in any other capacity whatsoever) including, without limitation, Claims you may have against CryptoCue arising out of any opinion expressed or information conveyed by CryptoCue at any time. ("Claims" shall include any action, proceeding, claim, demand, judgment or judgment sum of whatsoever nature or howsoever arising.) You hereby agree to indemnify and hold harmless CryptoCue in respect of any and all Losses paid, discharged, sustained or incurred by CryptoCue in the event of bringing any Claim against CryptoCue. (“Losses” shall include any and all liabilities, costs, expenses, damages, fines, impositions or losses (including but not limited to any direct, indirect or consequential losses, loss of profit, loss of earnings , loss of reputation and all interest, penalties and legal costs (calculated on a full indemnity basis) and all other reasonable professional costs and expenses and any associated value-added tax) of whatsoever nature and/or judgement sums (including interest thereon).)

LONG - WAN - Trading OpportunityNice bottom consolidation forming an Adam&Eve, expecting something close the previous high.
Entry: 0.00002523
TP 1: 0.00002797
TP 2: 0.00003067
TP 3: 0.00003689
SL: 0.00002378
CryptoCue is not providing investment advice and is not taking subscribers’ personal circumstances into consideration when discussing investments. Investment involves a high degree of risk and should be considered only by persons who can afford to sustain a loss of their entire position.
CryptoCue is not registered, licensed or authorized to provide investment advice and is simply providing an opinion, which is given without any liability or reliance 1.71% whatsoever. The information contained here is not an offer or solicitation or recommendation or advice to buy, hold, or sell any security. CryptoCue makes no representation as to the completeness, accuracy or timeliness of the material provided and all information and opinions provided by CryptoCue are subject to change without notice and provided on a non-reliance basis and without acceptance of any liability or responsibility whatsoever or howsoever arising. You hereby irrevocably and unconditionally waive, release and discharge: (a) any and all accrued rights and/or benefits you may have against CryptoCue in respect of any opinion expressed or information conveyed by CryptoCue at any time; (b) any and all Claims you may have against CryptoCue arising out of any opinion expressed or information conveyed by CryptoCue at any time; (c) CryptoCue from all and any claims (whether actual or contingent and whether as an employee, office holder or in any other capacity whatsoever) including, without limitation, Claims you may have against CryptoCue arising out of any opinion expressed or information conveyed by CryptoCue at any time. ("Claims" shall include any action, proceeding, claim, demand, judgment or judgment sum of whatsoever nature or howsoever arising.) You hereby agree to indemnify and hold harmless CryptoCue in respect of any and all Losses paid, discharged, sustained or incurred by CryptoCue in the event of bringing any Claim against CryptoCue. (“Losses” shall include any and all liabilities, costs, expenses, damages, fines, impositions or losses (including but not limited to any direct, indirect or consequential losses, loss of profit, loss of earnings , loss of reputation and all interest, penalties and legal costs (calculated on a full indemnity basis) and all other reasonable professional costs and expenses and any associated value-added tax) of whatsoever nature and/or judgement sums (including interest thereon).)

The Break of Bitcoin's Range (BTC)I gave this consolidation after the first leg down a bit of time to show if the strength of the bear was alive and well. It's been about 20 days since the breakdown happened and I'm convinced we've reached a cycle low of 7.7k which was tested 3 times already. A rally above 8.8k and close would be solidification of the fact. Price action here on the 1H and the daily chart of the bear market $3k chop look eerily similar. I suggest whoever views this to look and come to your own conclusion. Liquidity in this range is at the highest it's ever been, a lot of Bitcoin's are exchanging hands here. I'm one of the buyers here for sure.

My AAPL play has worked out GREAT!YouTube: Dumb Money Trader
twitter.com/dumbmoneytrader
facebook.com/dumbmoneytrader (New FB group. Very few restrictions, unlike a lot of other investment groups)
www.dumbmoneytrader.com

Lululemon (LULU) moves off Trendline Support and Breaks HigherLULU has been rising in a trend channel since April. The price recently pulled back to channel support and then consolidated there. On Oct 10 the price broke above the consolidation signaling a long entry.
The chart shows two trade scenarios. One is entering when the price breaks above the consolidation. This trade has a 6:1 reward to risk based on the estimated exit (top of channel). Spotting the channel and the consolidation would have alerted a trader to be on the lookout for an upside breakout. I posted this on Oct 9 in my free Facebook swing trading group (www.facebook.com). An order could have been placed to enter when the price broke above the consolidation high.
The other scenario is a late entry near the closing price on Oct 10. Still a good trade potentially, but the reward:risk drops to about 3:1.

Consolidating At A Very Strong Level For Possible ReversalAUDCAD tried to give one more run to the downside last week but ended up stalling out and landing into consolidation. This area has a strong history of consolidation leading to reversals for the long. Let's see if that's what we are building up to this week. If not, we'll continue down to my next daily SR level and if we break through that, I'll post new TPS.
BULL TPS:
0.89873
0.90242
0.90513
0.90522
0.91362
BEAR TPS:
0.89372
0.89025
0.88893
Will post new Bear TPs if the daily SR level becomes broken.

AUDUSD analysis higher chance for reversingMy opinion after analysis i expecting here from Monday bigger jump i price. The pair is be in consolidation, for now we can see low periodic moves higher, i expecting break and higher push up in price. price is saturadet, AUD one of strongest, USD is start losing power on Friday. Tuesday RBA have Interest Rate Decision which in my op will have positive impact on AUD,- will push him higher.
ENTRY: 0.67670
TP: 0.68000
SL: 0.67400
If be chance i will upd TP2.
Chart time frame - 1D
Time for reaching TP - 8 - 72 hours
Follow, Like, Share or Comment
Thanks on supporting!
All best!

Will It Return To Monthly High or Keep Sinking?I'm beginning to backtest US30 since its the hot currency pair to trade in my circle.
So I'll be posting trades I am currently practicing with all TPs to get adjusted to it. As you notice, I can only trade this thing on the 4hr. moves to fast for me on lower timeframes.
Consolidation happened at the monthly high. This is the 2nd time price has visited the area. but let's see this week will we make the drop back down the weekly SR level or will we create a new market high for this pair.
Right now, a pullback is due from the breakout it had. From there, we will see where price will go next.
BEAR TPS: after pullback
26908
26724
26430
26130
BULL TPS:
27061
27185
27138
27645

More SPY consolidationSPY is consolidating on the 1 hour chart.
With recent events - air strikes on Saudi refinery, possible war with Iran, Fed uncertainty, etc - I am leaning towards "option 1."
Volume has steadily declined since the start of the consolidation which tells me a break out is soon to occur. The RSI has been trending downwards since before the consolidation, which tells me the break-out has a bearish bias. Combine these with all the uncertainty right now, as well as an overpriced market (based on S&P PE ratio), and I believe the break will be to the down side. There is also the problem SPY is having trying to break back above the long-term up-trend.
If it breaks below consolidation, I think it's virtually a free fall down to where the initial gap up started. From there, who knows? Maybe the gap will get filled ... I will have to re-evaluate at that time. And, this is all assuming a break to the downside happens. When it breaks (either up or down) I plan on entering an options position.

XRPUSD Ripple Is At A Strong Weekly Support And Now We Broke OutXRPUSD is at a major weekly support level, if you look on the daily it will be easier to see.
I was waiting for the market to break out of its Daily consolidation and today it did with Volume supporting the move, this could be the start of the next big rally.

COMPARING 2 DIFFERENT SUNDAY NIGHTS AUG 19 - SEPT 152 DIFFERENT OUTCOMES WITH THE SAME BUILD UP
"HOPIUM IS A HELLUVA DRUG" - QUOTE RICK JAMES

NO BREAK! But SPY, DIA, and QQQ broke...The Russell ETF could not break out of consolidation, but the other 3 majors did break.
The Russell - being the major small cap index - is an indicator of risk. When the Russell is rising, investors are less fearful. When the Russell is falling, investors are cautious ... That's the basic concept anyways.
I think this Russell chart is showing that maybe people aren't as optimistic as Thursday's rocket ship would have implied. While the 3 biggest indexes broke through strong resistance pretty convincingly, the Russell stayed put ... it tried, but did not succeed. IWM also bounced off its 50 day MA.
In addition to that, Friday's close was less than impressive. I'm betting on at least a bearish start to next week, and possibly for the week as a whole. Jerome Powell, yet again, gave no clear-cut direction to the Fed's interest rate plans, leaving the market to wonder what's going on. All economic indications (and technicals) are pointing towards - at the very least - a strong market correction. I think Powell's speech, mixed with the very poor jobs report, put a bad taste in the markets mouth.
I bought some TVIX yesterday, because I'm thinking Monday might be a little ugly. Looking at this IWM chart makes me feel even better about my TVIX purchase ... for Monday anyways.

BTCUSD - Key-Levels to watch before break-out! _______________________________________________________________________________________________________________________________________
Hello traders investors and community, today i will have a closer look on Bitcoins price action. We are looking on the 4-hour chart.
_______________________________________________________________________________________________________________________________________
As you can see in my chart, BTCUSD is consolidating in a triangle. The consolidation is holding quite long now, normally after such period a break-out will oc-
cur, either up or down. In this case the bullish break-out scenario is highly possible.
_______________________________________________________________________________________________________________________________________
BTCUSD is trading at around 10600 now after a decent up-move we see a small consolidation. In my chart you can see the support between 9930 - 10100,
this is a very important zone for BTCUSD because we bounced there several times in the last days and weeks. It is also an psychological price level, as full
numbers like 9000, 10000, 11000 and so on form important price levels for support or resistance.
_______________________________________________________________________________________________________________________________________
I am expecting a correction to the range at 9930 - 10100 before an break-out and uphtrust will occur. You can see the upthrust range at 11000 USD, this is
the level very many stop-loss will be hit when triggered and a shift up in price-movement.
_______________________________________________________________________________________________________________________________________
The correction will be a good spot to open a LONG position, i myself just looking for an entry there. The total first target for this trade will be 12500 - 12750
_______________________________________________________________________________________________________________________________________
Hopefully everybody is doing well with his trades! May all luck come to you friends! I appreciate everybody who takes some seconds to support, more insight
will follow! This is only educational information and should not be used to take action in markets.
_______________________________________________________________________________________________________________________________________

Facebook, Holding between ranges. FB- Canary Jones
Market Climate:
Neutral. Hold. Going-Long.
Industry:
Internet Services
Indicators:
None
Patterns Identified:
Rising Channel
Broadening Wedge
Facebook stock price has for the better of eight years remained trading within a highly respected bullish rising channel. Similar to other major securities or blue chips currently on the S&P 500 or the Dow Jones, Facebook has recently broken beyond major resistance signifying a continued confidence in the integrity of both the security and of overall US economic health. During this breakout, volatility has significantly increased both abroad and domestically. This can be seen by the developing broadening wedge synonymous to the expansion of market volatility.
Canary Jones analysts have identified the broadening wedge of Facebook as a potential consolidating structure. Although the price has re-trended back into the original rising channel, the price has also exited and entered on other occasions. Yet, the stock continues to respect the prevailing macro trend.
Although Facebook user activity has remained a challenge for the company to retain high usage and greater amounts of screen time, Facebook has directly taken actions to prevent its consumers from spending exorbitant amounts of time on its platform. This has slightly made Facebook a less attractive advertising alternative to other existing platforms such as Google ads, YouTube, and even now Amazon.com.
Facebook’s continuing dominance of online social media has also for the most part created a negative consumer consensus that directly impacts their willingness to continue use for prolonged periods of time. Additionally, a string of data breaches and questionable ethical activities has simultaneously disrupted consumer image of the company and its brands.
Facebook’s stock price is currently trending between both the consolidating wedge, and the macro rising channel. This crossover has lead Facebook bulls to being indecisive of both direction and reasonable entry. Facebook bulls should consider entry on the supports of either the rising channel, or the broadening wedge so long as confirmation of candlesticks is also evident.

SPY breakthrough?Is the consolidation trying to break finally? I dunno... On the 4 hour, it looks like it just tried to. The most recent 4 hour candle/volume is notated with blue arrows, and the same 4 hour period from 24 hours ago is notated with black arrows.
I noticed a couple things: In comparison to the same period 24 hours ago, the volume was light this time. Not only that, but the candlestick 24 hours ago was MUCH bigger (without getting into ticks moved and percentages gained). So, is it trying to break? Or is this going to be another rejection? I'm leaning towards rejection based on volume and tick movement... But I have definitely been wrong before.

/ES bearish outlook - 4 hour short termSame story as the SPY... Looks bearish to me for the short term. It looks like we might move lower from here and test the bottom of the consolidation, then bounce back up to retest the top (red arrow). Or, we might FINALLY breakthrough the bottom and retest the lows from a couple weeks ago (other red arrow). Either way, until something solid happens with the trade war, in a positive way, I have a bear bias for the S&P. If we can break through this consolidation to the down side, I will then look to add to my short position all the way to the low from August 5. Then, I will keep my eyes open and look for a break and close below that, because then the bottom will drop out. However, if we end up breaking consolidation to the upside, I will look to ride it all the way to the all-time highs. At that point, I would be cautious and looking for a double top. Again, if we break and close above the all-time high, I will probably go long until there's a reason not to, lol.

Will the USDSEK Breakout?Last post: See link below.
Review: Price was in a bullish trend .
Update: Price soon moved into a circa 3-month consolidation .
Conclusion: Looking for the current bullish momentum to take price out of consolidation and towards the major round number of 10.0000. We are currently long on this and will look to compound/add further long trades once 10.0000 is confirmed as support.
Any comments or questions, do not hesitate to leave them below. Give us the thumbs up if you share our sentiments!
Sublime Trading

REVEALING BITCOIN HALVING-CYCLES - 120.000 USD AFTER NEXT ONE?! _______________________________________________________________________________________________________________________________________
Hello traders investors and community. There is an interesting observation which i made and want to share with you today. It is revealing the magic bitcoin
halving-cycle in which we seen huge growing of price after the past halvings.
_______________________________________________________________________________________________________________________________________
The last weeks we are facing a consolidation period, exactly what we have seen in the past before halving break-outs happened. Before the first halving and
break-out BTCUSD consolidated between 2 and 15 USD, after the halving we have seen an enormous growth of 90.52 X before the first major top formed.
The same happened after the second halving, in this case BTCUSD made28.74 X after a longer consolidation period in which price consolidated between
160 - 700 USD.
_______________________________________________________________________________________________________________________________________
In my chart you can see the red boxes which show the consolidation periods before BTCUSD broke out and entered the growth phase (green-boxes), exactly
after the halving!
_______________________________________________________________________________________________________________________________________
I am expecting the consolidation period in which we are trading now to hold on until the halving or beyond, after this we will face the next big
bitcoin-halving growth period of BTCUSD.
_______________________________________________________________________________________________________________________________________
Consider this: We made 90.52 times price-growth after the first and 28.74 after the second halving.
Now this gives an average of 59.63 X.
Just when we underbeat this mark and make 10 times more after the next halving that would be 100.000 - 120.000 USD.
Looking on the information i am expecting a similar growth-period for BTCUSD like the one seen after the first halving.
_______________________________________________________________________________________________________________________________________
Okay hopefully everybody enjoyed! May all luck and happiness come to you! For more market insight feel free to support!
The information provided is for educational purposes only and should not be used to take action in markets.
_______________________________________________________________________________________________________________________________________

Consolidation triangle for reversal marketSo after we made some very good shorts thanks to so many resistances its time to decide if the bears have won.
Confirmation for reversal market:
1. If we go below 9950 (Symmetrical triangle) and continue the break to below 9850
2. If volume buying power OBV goes below the last low OBV means the buyers lost their volume
3. We already confirmed all the rejections on 4h cloud, sma200, ma200 - too strong, everytime rejected harder...
4. If we go below 9050 it means we broke the descending triangle as well, means we are going to crush towards the first support at 8200...
5. If we won't hold it for enough time then we will see correction towards the 5-7k....
___________________________________________________________________________________________________________________________________________
* If you like what I do, please push "follow" and "like".
* Also if you want live time signals and learn with the community then you are welcome to join here: t.me
* If you want to appreciate my work with spare BTCs then you are welcome to send them to: bc1q8kzn0x8j4dmws00ntuhyma8p4c9jwyj0gzxua9
Cheers, love <3
Hedgehog King!
___________________________________________________________________________________________________________________________________________
