EURJPY short positionMarket was producing an uptrend, however, market has been failing to break resistance (Wick rejection)
There is also visible exhaustion on the bullish momentum and more bears are entering the market
Entering into the market can be at turquoise line based on the wick rejection at the bottom
Wait for a break and retest of area before entering the market
When market moves 30+ pips in, move SL to break even
Big opportunities in the market this week
Happy Trading!
Consolidation-breakout

"Good profits come to those who wait"My USDJPY trade idea has been in the making for the past 5 trading days, over a week now!
Its important though that as a trader you are willing to wait for the right criteria to be met, and to only enter the market on your terms... not the markets. So this is a matter of stalking the market and reaping the rewards later.
Ever since the JPY liquidity crash on January 2nd, the rising channel has supported USDJPY, this level has been strongly defended by the bulls, never more so than the past 5 days. I think the reason why is that if this level is broken, then there is considerable downside available to the bears, with little in the way of support.
So... Onto the setup. You should able to see the point of interest highlighted as the yellow box, showing us the daily Inside Candle setup. This isn't just any inside candle setup however, as it has now stretched to 4 inside candles inside the mother bar! This level of consolidation simply means the breakout could be even more powerful.
Because the Inside Candle Pattern is located on a key market level, it gives it relevance, I wouldn't be interested in trading an inside candle setup in the middle of nowhere with little market relevance. Also it gains further importance due to being formed on the Daily time-frame. All setups and candlestick patterns formed on the daily chart are significantly more reliable than lower time-frames.
To add even more confluence to the trade setup, you can see some further resistance that will be broken by the blue trend-line, any candle breaking the inside bar high, will also break this level. Equally any break to the downside breaks the long term trendline from 2nd January, simply meaning we can expect a big move following any breakout.
There are two ways to trade this setup. The aggressive approach would be to take your entry long when price breaks the high of the mother bar, or a short when price breaks the low of the mother bar. The conservative approach would be exactly the same but you only enter the trade once the candle has actually closed - this avoids the potential of a false breakout but also means you might miss out on some potential pips.
The targets for long trades will be the top of the rising channel.
The targets for short trades will be the next Daily Key Level around 109.000

Gold daily forecast - Weak Rebound May Push Price LowerIn my previous analysis on gold, the price indeed has rebounded off from the demand zone around 1292 and climbed highest to 1297.
However, the rebound was too weak and shallow which may cause the price to pull back and retest the low once again.
The price has been consolidating upwards, forming a short-term rising channel which seems to be completed soon.
If the price can break below the channel, we can look for a short-term sell towards the demand zone below.

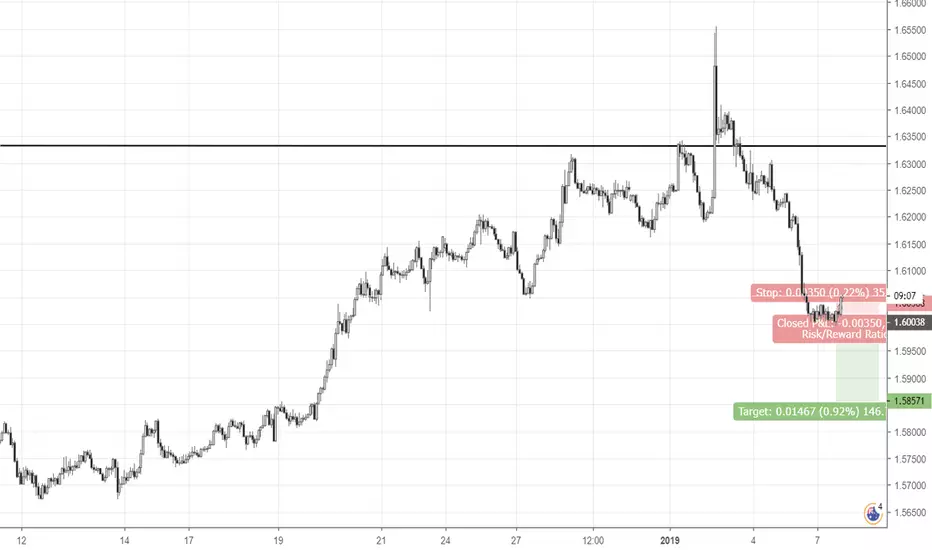
USDJPY SHORT- Pair broke out of zone of the downside
- Currently testing support as resistance
- Pair was recently overbought on both RSI and Stochastic Oscillator on 4-hr chart
For a safer trade may want to wait until pair tests EMA (25, close) or a strong bearish candlestick closes


GBPJPY revision after the fantom newsGBPJPY revision after the fantom news
Could trade it within the range of consolidation but I'm looking for the breakout and retest on either side of the consolidation. At the moment, price action implies this will move to the downside but, we all know anything could happen. No TPs and entries at the moment but I'll likely revamp this later with an updated version.

GBPJPY 4H SHORT TRADEPrice is in a sideways consolidation
Macd is over-bought so I have a Bearish Trade Bias
Watch Macd for confirmation of Bearish direction
Watch for Bearish breakout of 800 sma
Short Trade
Sell Stop @ 143.95
Sell Take Profit @ 143.35
Find SL

USDJPY waiting for a Bullish BreakoutUSDJPY has a strong resistance test for a while making a Bullish Continuation Pennant. The overall structure of the market is going up. Waiting for the resistance to break for a nice move upwards.

GBPUSD consolidating, waiting for support/resistance breakoutThe market is under consolidation for couple of hours, it has strong support and resistance so look for opportunity for buy or sell after support/resistance breakdown and retest.

Ascending triangle/tightening towards the trendGot in within the ascending triangle. The position is towards the main trend.
1)Stop loss is under the consolidation low.
2)Profit target is around May highs.

EURUSD ConsolidatingEURUSD has been trading in this range for quite a bit. Thought there was going to be a break last week, but it ended up coming back down into this range. Watch for a break above or below and then trade accordingly. Happy trading!

Consolidation before major moveAUDJPY has been hovering between the 77.7 and the 78.7 zone.
Must the same as most AUD pairs, we have been in a long term down trend, but price action has started showing reversal signs. Upon breaking through the consolidation zone and (if up) the 200 EMA, we have a nice healthy area for a long position.
No trade yet - watch for movement out of the consolidation zone

STRATBTC Momentum AnalysisI beleive that the bearish momentum has now been exhausted, and a bullish reversal is likely because the macro level analysis of STRAT BTC shows a clear parabolic, bullish move, followed by a consolidation trend, down to the 0.0002 satoshi level. The 0.0002 satoshi level would be my ideal entry point, however on the smaller time resolutions there are also some local support zones which could be used. A close below 0.0002 satoshis could also indicate that the bearish trend is not yet over, i would be very cautious entering a long below that zone.
Not an expert, not financial advice.
Biffy

Big Picture View on AUDUSDWe can see the impulse move to the downside on the left of the chart, indicated by the first pink arrow. Then there was a consolidation structure formation which completed 5 waves and broke to the downside. This indicates that we are in the second impulse move, indicated by the second pink arrow on the right. Based on the initial impulse length, we can expect a fall to around the 0.5600 mark which is still a long way down!
Obviously this will not go in a straight line and there will be many trade opportunities on the way down on smaller time frames. Check out our trading signal service to get the exact entry, SL and TP levels for our trades.
Happy Trading!
Linton

Short - 1280 IncomingPrice has clearly consolidated around the 1290-1297 range and has tested these two price points nearly all week.
Price hasn't been able to push through the zone and we should see a retest of the 4 hour trend line and the 200EMA at around the 1280 mark.
Watch this trade carefulluy

USD/CAD: Is the Worst Over? USD/CAD has had a very negative start to the year. For a while, CAD was actually the best performing currency in the world, year to date. But has the pair finished its down trend? Since Wednesday, there has been significant consolidation and a stop in the decline. It dropped as low as 1.31804 before climbing back up slightly.
I think given the significant level of 1.3200, which the pair has been testing around over the last 3 days, the down trend may be over. I would look for a slight retracement back towards the 1.3200 level before the pair reverses and begins a new up trend.
Going back a few weeks, this pattern is actually quite similar to the pattern formed from November 20 - November 28 2018. After an up trend (albeit a short one), the pair reversed and began a down trend, before hitting below the 1.3200 level. Once around that level though, it bounced back upwards, retraced back down to the level, and then broke out to the upside. I wonder if something similar will happen this time.
I would suggest placing a buy order on the retracement back to 1.3200 with a stop loss of 1.3160 and a take profit of 1.33144, a level of resistance multiple times since November 2018.

Breakout of the consolidation against the local trendAfter the failed attempt of the breakout of the consolidation towards the local trend. Now I'm trying to catch the correction after quite long down-move by flipping my position.
1)Stop loss below the lows of the consolidation.
2)Profit target based on the recent technical structure.


Breakout from the consolidation towards the trendGot in the breakout of the local consolidation towards the short term down-trend.
1)Stop loss above the high of the consolidation
2)Profit target is based on the recent technical structure.
(Posted post factum)
Down-move: breakoutAfter the steady up-trend, the up-trend structure was broken and it started to look like the reversal. I got in at the breakout of local consolidation.
1)Stop loss above the highs of the consolidation.
2)Profit target is based on 2018 Jun highs.
(Posted post factum)


Holy sideways movement BATmanWe continue to have sideways movement between well established lines of support and resistance. The line of support has been tested 8 times.
However, movement downward is running out of steam as evident by the last dip that was unable to reach our support line. So it's no surprise the price is now flirting with a breakthrough of our line of resistance. If this happens, look for the price to retest the line of resistance as our new level of support. If it holds as our new line of support and volume is sufficient, look for price increase equal to at least the height of our existing support/resistance boundaries, to around the 118000 mark.
Our buy mark would be just above the existing line of resistance, and if you miss that, it could retest the line as our new level support, which would provide a second buy opportunity.
Our stop could be located in two possible positions. First position is at the our existing line of support around 104000. Alternatively, if the price breaks out and then falls back into our existing support and resistance lines, a new upward trend line might be forming, and our stop would be at that line (low point of the orange line).
