Eur/Aud Short OpportunityEUR/AUD is at a daily double top
Also, notice we are in a level of consolidation.
We may see a breakout to the downside long term.
Always use stops!
Cheers.
Consolidation-breakout

LTC Consolidation BreakoutLTC is in a falling wedge but consolidation is possible if support holds $166. As volatility cools LTC will become range bound until the bulls make a break above $168.

GBPJPY Breakout continuation?Stochastic and structure is bunching up at the top of the Flag/wedge which could be signalling a possible continuation. Bands on TDI are also tight which normally precedes a breakout. A buy stop is put in place.. nothing is sure now but something to watch for.

$IOST - A quick TA of an impending breakoutQuick TA of the falling wedge
Red boxes: failed breakouts, as indicated by shooting stars on the candlesticks.
Red lines: resistance lines formed by finding the failed breakouts.


LISK going into FebruaryAnother good coin to buy is LISK
It had a nice run up to long term resistance trend en is now consolidating
It also has a rebranding end of january + LISK CORE 1.0 launch
LISK getting ready to blow up
A break of long term resistance trend will give us a buy opportunity
Good luck!

SHORT IN EURAUDAfter broken the consolidation in 1D, the price formed an ABC Diagonal on 4H chart. We have divergence in MACD, so now I'm waiting for drop, with the target at the top of ABC.
----------------
Después de romper la consolidación en 1D, a formado en el gráfico de 4H un ABC Diagonal. Tenemos también divergencia en MACD, así que busco una caída, con un primer profit en el tope del ABC.

BTC Getting Squeezed. I think we’re still in a downward trend but this triangle could squeeze BTC and make it pop out for a possible trend reversal.
Elliot wave suggests we will complete the 5th wave in a downward movement to pop off of the $8K-8.5K level. Its a pivitol moment so worth continued dollar cost averaging while BTC is on sale. Let’s grab some more while we can.
If we buy now, wait till we see it breakout and hook the trend line for “confirmation”.
Or else we head back down to the 8K area.

BTC finalizing consolidation faseWe can see here a Bullish falling wedge pattern on the BTCUSD pair. The 3 hour RSI has some more room to Grow, I see Bitcoin attempting to break resistance and fall back one more time. We are getting close to two strong support lines, the first one is holding since September '17.
Sell Range: 11850 - 12400
Buy Range: 8600 - 9400
In case we fall below the buy zone, next support will be at 5600. But there we will face a big buying pressure, so I don't expect this to happen. But you'll never know. I could also be wrong.

Waves TriangleWAVESBTC is inside a "huge" symmetrical but we can see a strong support at the 0.618 Fib level, it got support there 3 times, making a triple bottom.
Because of that support we see a (Bull) Descending Triangle forming, normally this pattern indicates a drop in price (continuation of the fall) but since WAVESBTC made that triple bottom it should have "power" to break the "downtrend" line, thus meaning it could rise in price.
Careful if it drops bellow the Yellow support!
Its possible that it does another bounce then it "explodes" or one way or the other so wait for a breakout confirmation to start your positions!
Trade safe!

XRP Possible ConsolidationXRPUSD may see a consolidation as there is a resistance line that the most recent climb has dropped from. Could see some consolidation before it really takes off. Thoughts?

ADANIPORTS Short term Positional Call Adani Ports Trading technical call for short term
CMP 433.5, Closed Based SL 415 Targets 445 450 456
For Education purpose only


Marico Ltd Short term Positional callWww.techno-funda.com
CMP 318.9, Closingbased SL 312.9, Targets 323, 326, 331
* Consolidation Breakout
* Swing high Breakout
* Trend line breakout
* Swing Retracement
* Mini Morning Star pattern formation
Disclaimer: All levels are for education purpose only.

BF UTILITIES Short term Positional CallBf Utilities Limited NSE: BFUTLITIE
Short term Technical Trading Call.
CMP: 506, Closing Basis SL: 484.9, Targets: 525 534
Technicals:
* Trend line breakout
* Channel Break out
* Pull back trading
* Fibonacci level Breakout
* Volume Breakout
* Short consolidation breakout

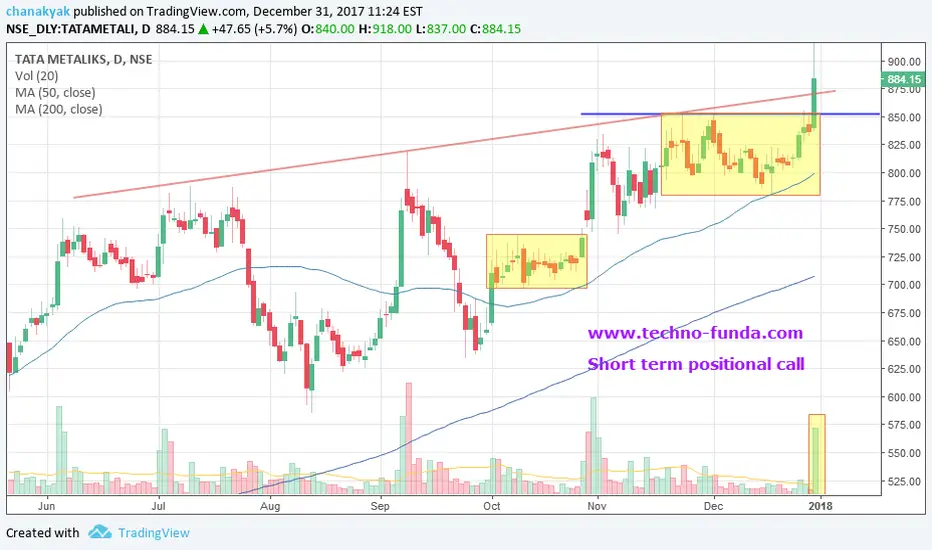
Tata Metalicks Medium Term positional CallTata Metaliks Limited Trading technical call for medium term
NSE: TATAMETALI
CMP: 884, Closing based SL 829, Targets: 920 945 959
Technicals:
* All time high and Close breakout
* Consolidation Breakout
* Trend Line Resistance Breakout
* Volume Breakout
* Swing high breakout
* Good Fundamentals
Discliamer: All levels are for Educational Purpose Only.
Capital First Short term positional callCAPF Capital First Limited Technical trading call for short term
CMP: 721, Closing basis SL 684, Targets 751 761 769
Technicals:
* Volume breakout
* Trend line breakout
* Swing high breakout
* Consolidation breakout

XVGBTC - Consolidation for a few weeks + BreakoutVerge has been up and down over the past few weeks, thanks to bickering between their marketing team and McAfee. It's stabilized around 1000-1100 sats, and seems to be consolidating. 4HR chart indicates a convergence around 1/25. Looking for a bounce off of the 1050 long term support line today. Then we have to break short term resistance.
Should see a slow rise to 1350-1450 around the 25th, peppered with a couple spikes. We could see it get back up to the 1700-1800 level. Resistance lines at 1400, 1600, and 1850 back to Christmas Eve.
I'd bet on a breakout to 1800 by the 25th followed by a selloff to the 1400 level before stabilizing again around 1600. I'll update as we get closer.


LTC Long Setup - Retest of ATH 400+LTC experiencing some healthy consolidation around the 0.5 fib level. RSI and MACD so far holding up healthy with Bollinger bands tightening up for a move. I think we could see a move to 280 in the next 24 hours followed by a retest of ATH.
This trade relies on BTC holding steadily upwards/downwards with no drastic movement.
To summarize:
Target 1: 280
Target 2: 320
Target 3: 400
Stop loss: 235
Not a professional. DYOR.

TRIP consolidation breakdown most likely or breakoutLikely consolidating for earnings. could go either way. looks more bearish because of failed breakout

[LBC/BTC] Great long term hold!! %200-%300+ possible!! QUICK UPDATE;
is looking bulish after a slight correction! RSI's are all positive.
Cloud exit on 1D, has potential to breakout with this setup!
Compare todays volume to the last run, and this alt looks super cyclical (alt life cycle) and its got huge potential.
MacD shows a promising steady growth from hitting a low for so long.
According to my analysis 200% profits is easily reachable. if you'd like to hold longer you can aim for 300% and more ++!
You wait, you win.
Patience is key.
As always this is my trade opinion. Do your own research and never risk more then you can afford to loose! Feel free to ask me questions and or comment your thoughts and ideas.

BTC 300 EMA supported 4 hour triangle patternmassive triangle, supported by 300 EMA on the 4 hour period. the consolidation could essentially be over right here.
