GILD bounces from all-time low since year 2014. A BUY.1. Fundamental = Buy.
2. Technical = Buy.
3. News/Rumors = Buy.
Consolidation-breakout

$cbs breakout lookout! breakout in progress after consolidation and closed above 50 day-strong momentum
looking for move up to next prior pivot high of 66.0x area of resistance
monitoring for possible false breakout- high r/r

GNT/BTC Consolidation Breakout, More UpsideGNT/BTC recently broke out of a long consolidation. Will be expecting more upside because of this. Trade safe traders.

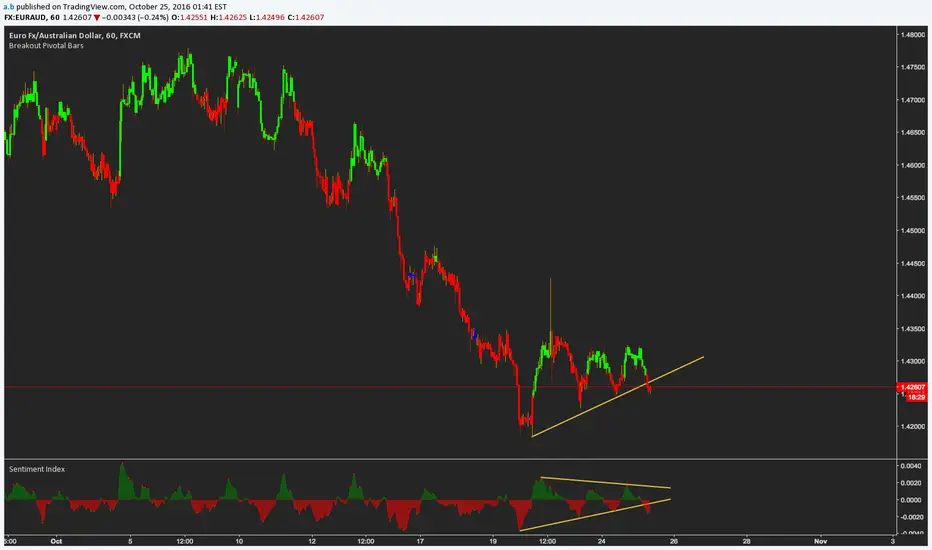
Time to break down from consolidation?EURAUD exchange rate for a week is moving in more than 150-pips consolidation, which was formed after setting the maxima at 1.5073. The wider trend remains bullish, but signs of weakening are showing, even in the form of the discussed consolidation.
Currently the rate is at the lower limit of this consolidation, which is located at 1.4930. Successful breakdown of this support may involve further price declines. The nearest target for falls in this scenario will be around 1.4800.The alternative in this case is consecutive reflection from support, which will result in continuation of sideways movement.


Bitcoin Breakout after consolidationBitcoin has a tendency to consolidate before breaking out and we are consolidating currently.

USDCAD triangle pattern formingI don't really know where will this one go, but if anyone can give their analysis, would be much appreciated.

USDJPY Daily OutlookUSDJPY is consolidating between the 112.00 support zone and 115.00 resistance zone. The box consolidation is clear and have been formed since 2017 first days.
We're now close to a breakout and down to 110.00 area? Or we're about to bounce back to the top of consolidation?
The next days will clear things out, the way I plan and execute my trades is more on breakout moments. So I'll watch closely today and tomorrow price reaction to this support zone and if it presents me as a break, I'll be there. If price starts to feel strong support and come back at higher leves, I'll be watching aside.

USDCHF 30' BreakoutUSDCHF is breaking the 30' box. The top of consolidation was just confirmed by previous candles, and the final target is on the top of a bigger consolidation as seen at 1h.
The major resistance zone is 1.00 (big number), which is close to 1:1 risk to reward. If price reach that area I'll bring SL to breakeven.

EURUSD 30' Bull Flag BreakoutFX:EURUSD
I'm long again on this Bull Flag breakout. The market reading is the same as today earlier, but with a different timeframe and momentum.
The actual candle just formed a big Bullish Outside Bar, breaking up the consolidation box and showing the strong up momentum.
The day trading relies good part on timing and momentum, it's important we realize that.

EURJPY: Where Previous Support Turns to Potential ResistanceAfter breaking down from a 2 month consolidation. The EURJPY is now returning to the level that at one point proved to be a significant level of support. After the violation we are now looking for this previous level of structure to potentially flip and act as resistance, offering a bearish trading opportunity with a very positive risk reward.
On the right of the chart are the 3 potential levels of profit taking that we discussed ranging from the conservative to the more aggressive.
My apologies for being absent, but between a rough start to the trading year and the launch of a new course, sharing on Trading View was a very low priority. Hopefully as things start to slow down towards the spring & summer, I can return to positing more consistently.
Either way i appreciate your continued support as we have a GREAT community of traders on this site!

Consolidation CADJPY - Potential Short to 84.40CADJPY appears to be consolidating near a previous support around 84.82
Watch out for a breakout of the previous low at 84.90 which would open a target at 84.40

EURJPYAt D1 price is near the support zone of consolidation, at H1 there is consolidation. Sell at breakout pullback.


Bullish Cypher on USDCAD Completing at Prev consolidationOpportunity for an aggressive entry with Bullish Cypher pattern on USDCAD ONLY if it fits your trading strategy, otherwise sit back and wait. That's what I'll be doing, waiting for my entry signal and desired R/R.


USDCAD Sell the BreakoutUSDCAD has finally approached the area at the top of the channel which will likely provide the best area to short the market. We will be looking to sell the breakout out of this smaller consolidation channel.
I have waited for this consolidation to publish an idea, as it would suggest the upturn in price of the last few days seems to be losing all steam as it approaches to upper channel resistance allowing for market bears to re enter.
We can expect price to breakout of this channel pretty soon, however you must always wait for confirmation to trade.

Wockhardt Pharma Breaking Consolidation, Next 865 On hourly chart, the price action breaks out from a consolidation that shall move prices to next resistance level of 865 levels.
Target 865
Stoploss: 830

Market SymmetryHello traders,
This is my symmetrical approach on eurusd,
I've seen the notion of symmetry as a reoccurring theme in the markets.
Don't place trades if price stays in consolidation zone.
Trade safe, trade well.

Long breakout of consolidationConsolidation structure with high probability of breaking out to the upside

Possibly a long consolidation period | Weekly chartHi guys;
As human nature like simplicity, a long consolidation period due to being the price around 100 is highly possible. It will move up or down but, after a while
